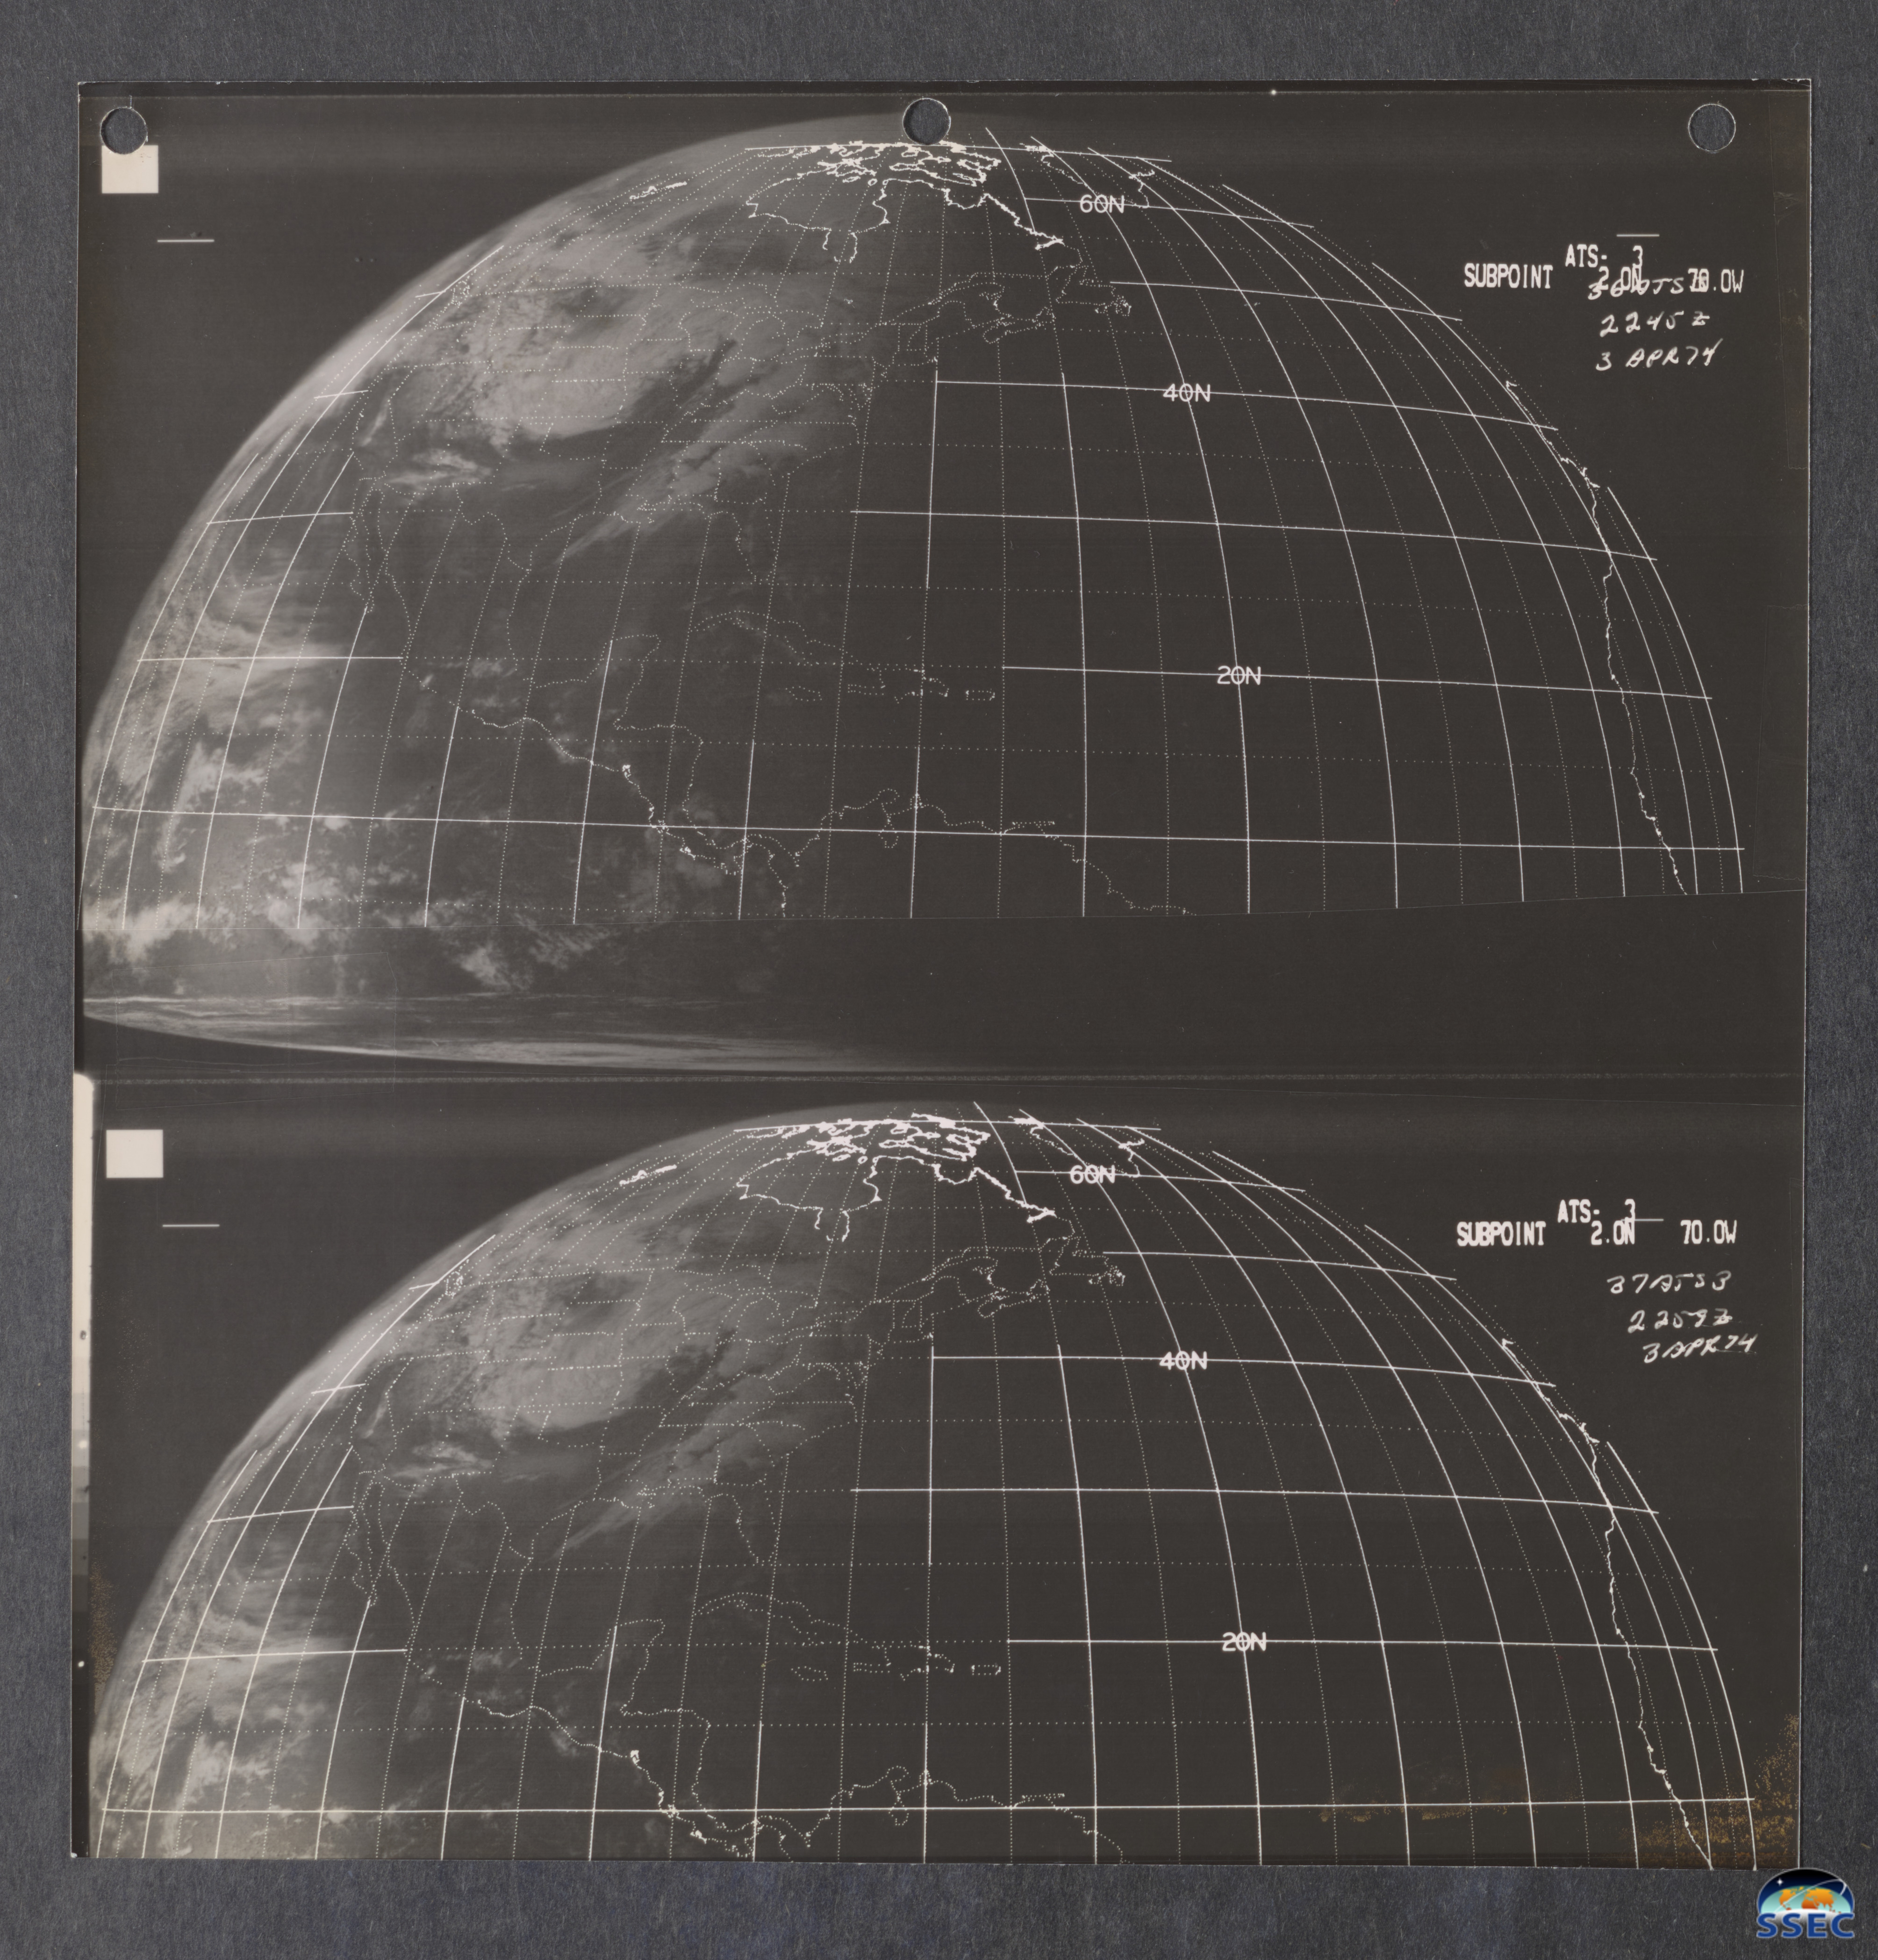
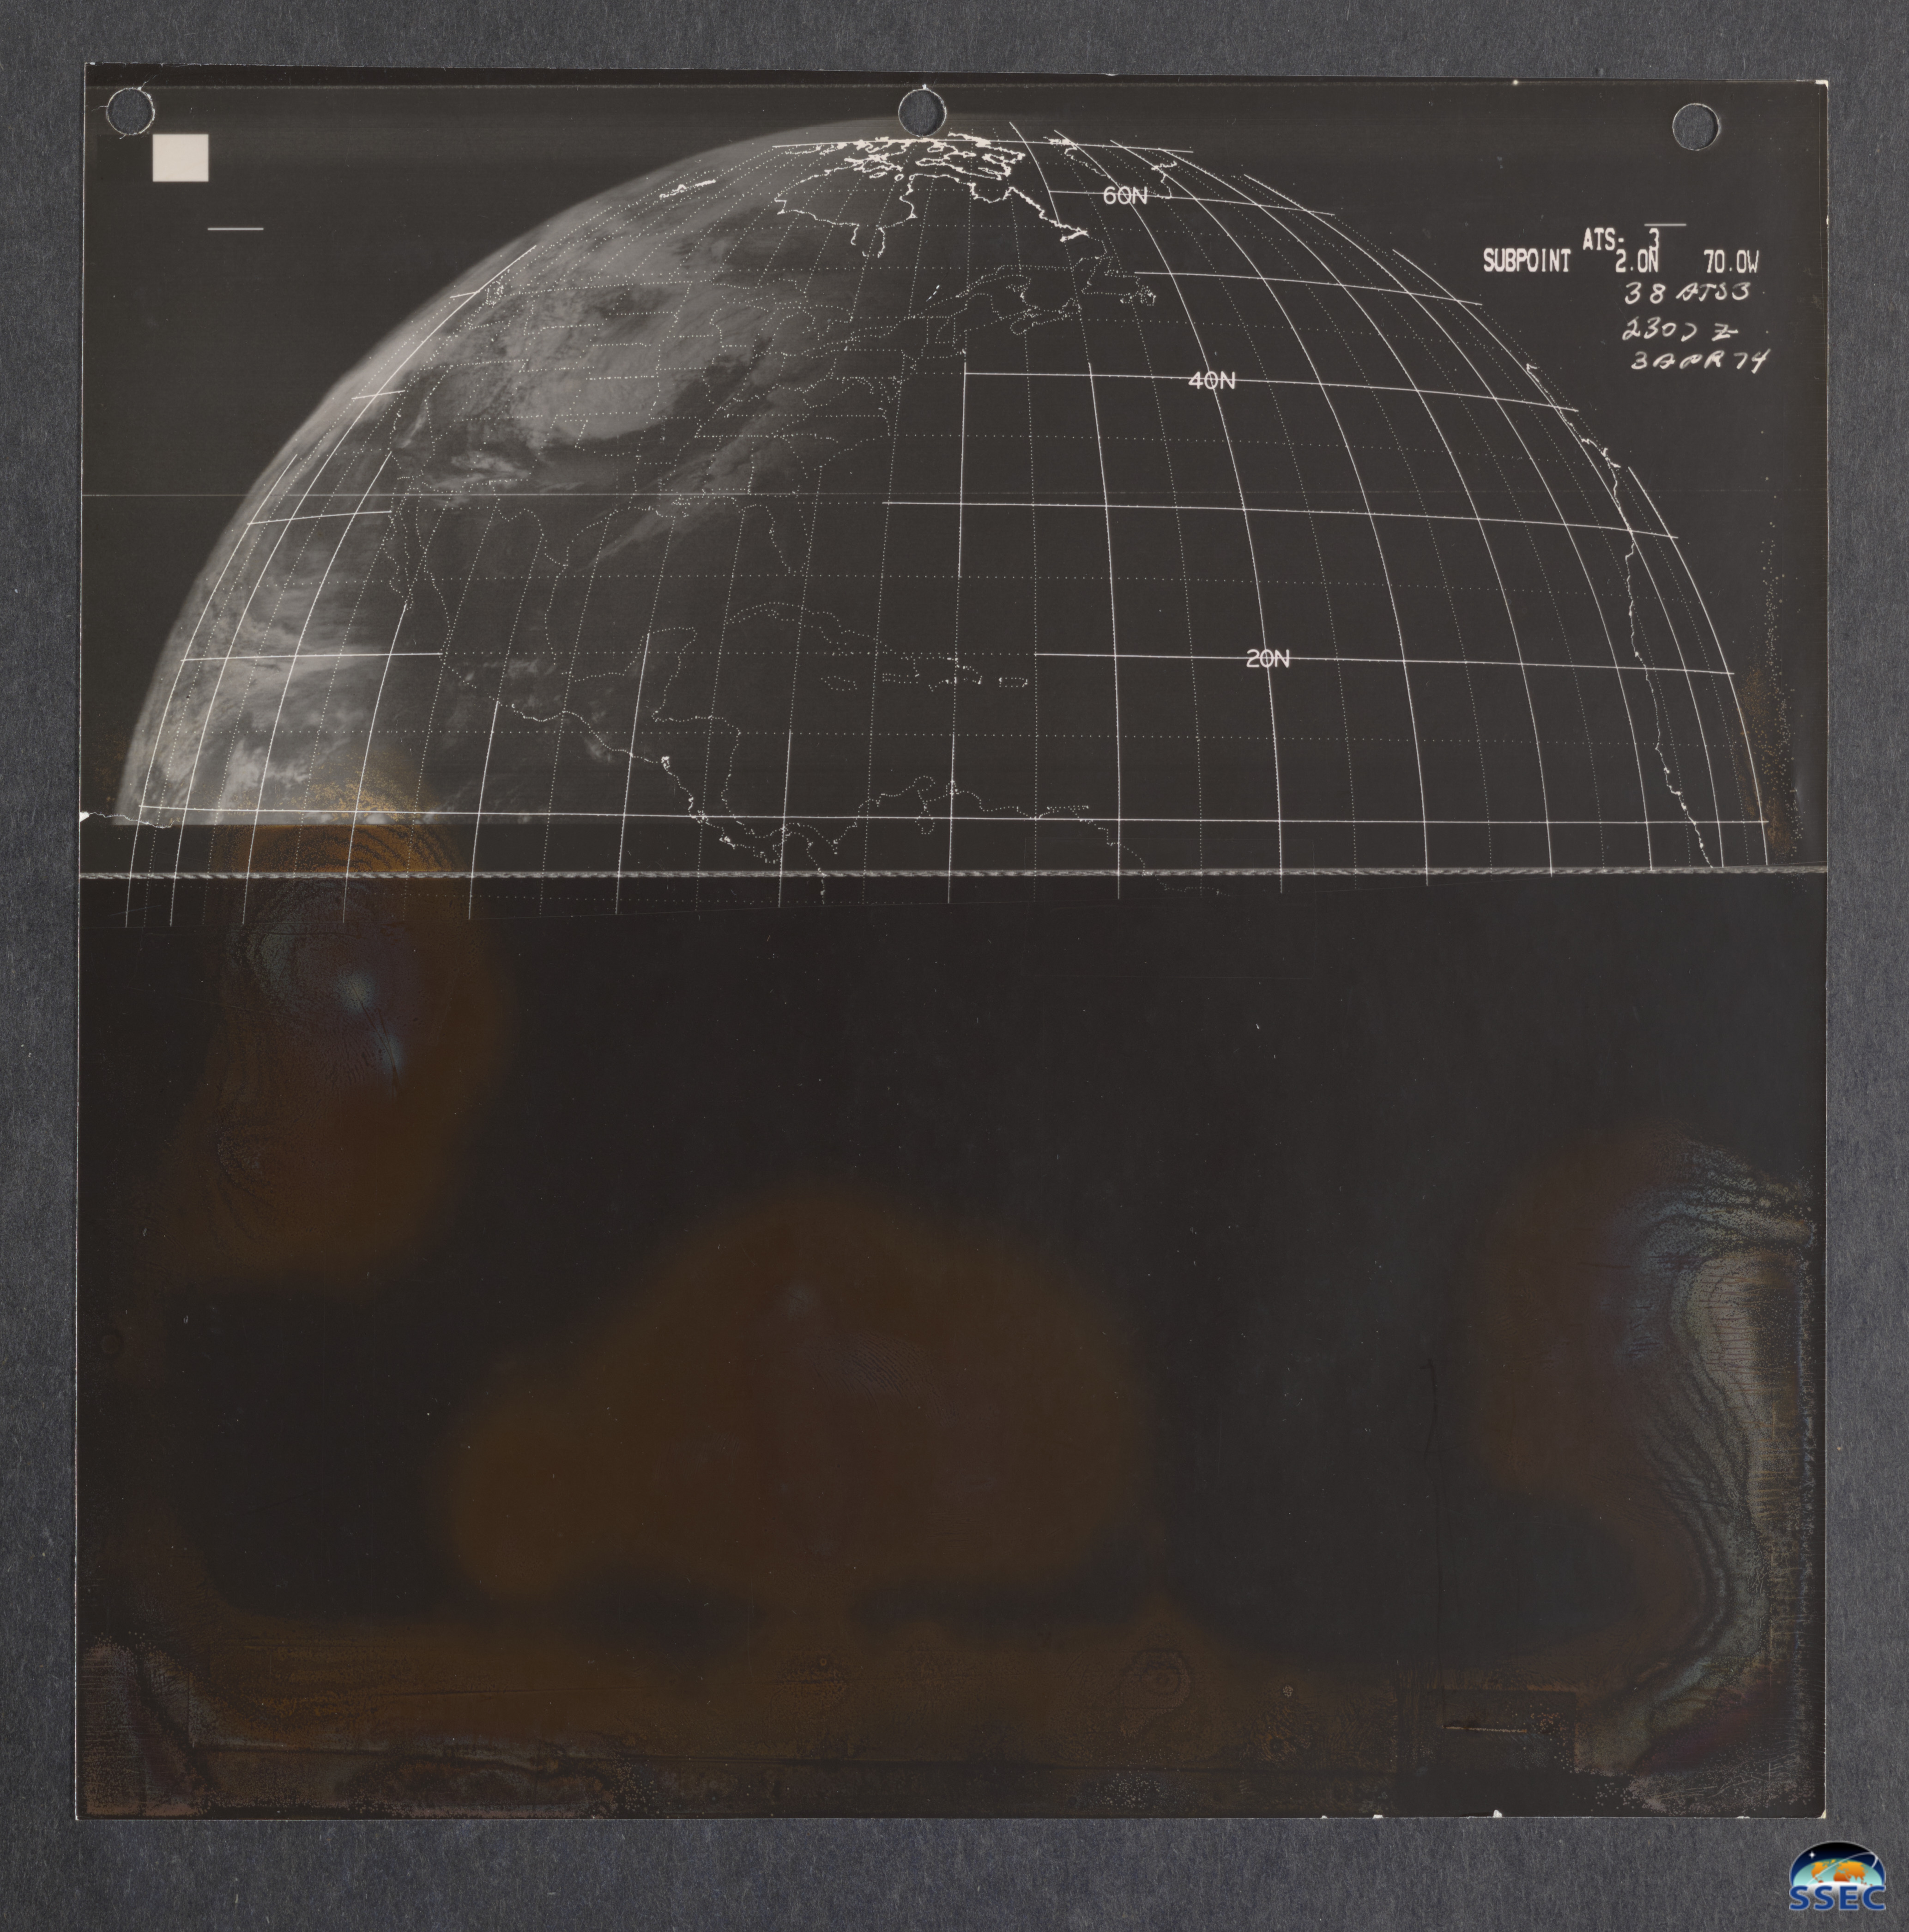
The 3-4 April 1974 Super Outbreak (NWS Wilmington OH | Wikipedia | StoryMap | Interacive WebMap | Monthly Weather Review) was one of the largest and most deadly tornado outbreaks on record in the United States. Several images from the ATS-3 satellite are shown below (thanks to the work of SSEC Satellite Data Services and Atmospheric, Oceanic and Space Sciences Library staff!). The University of Wisconsin-Madison Space Science and Engineering Center recently digitized over 66,000 Applications Technology Satellite (ATS)-1 and -3 images from the late 1960s to early 1970s. ATS-1 and -3 were experimental NASA geostationary satellites that carried Verner Suomi’s Spin-Scan Cloud Camera (SSCC). The camera, developed at UW/SSEC, allowed for nearly continuous viewing (usually every 30 minutes) of weather systems. Some of these images have been added to the UW Digital Collections (The “Super Outbreak“). Much work remains to prepare the larger dataset for use, including adding day/time stamps, quality control and navigation correction of the images.
The SSCC on ATS-1 and -3 had only visible spectral bands, hence only provided imagery during the daylight hours.
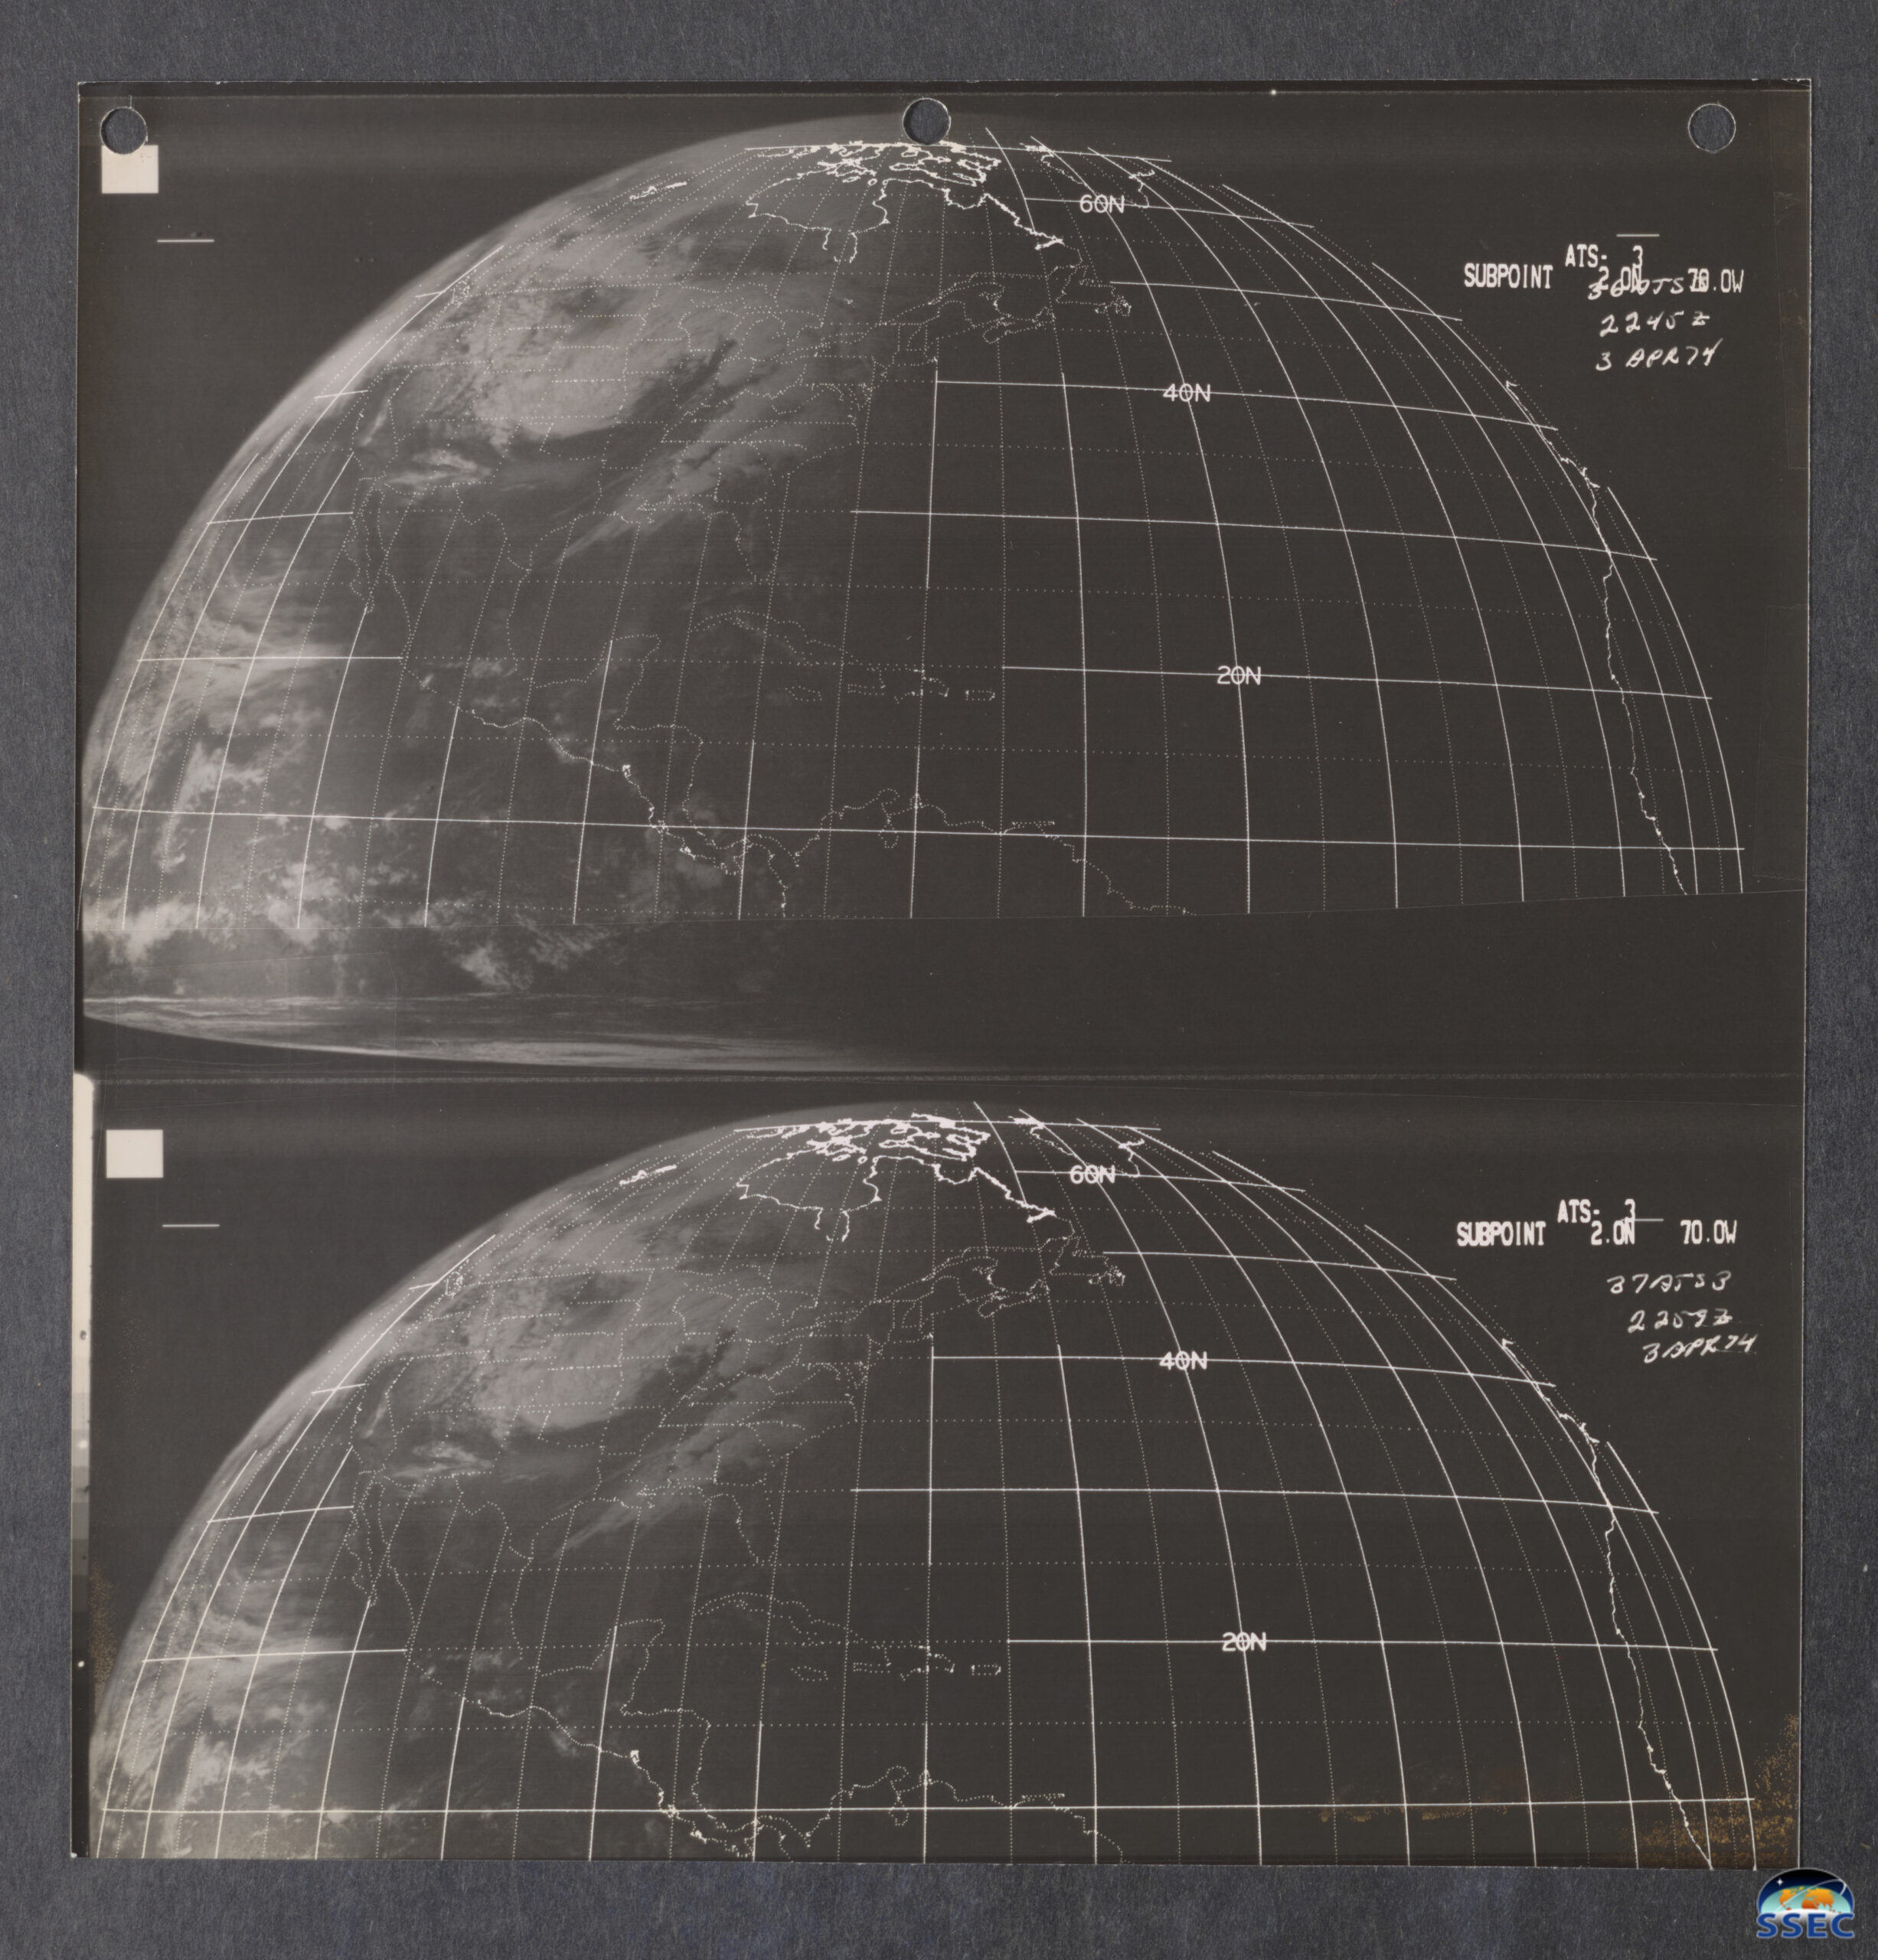
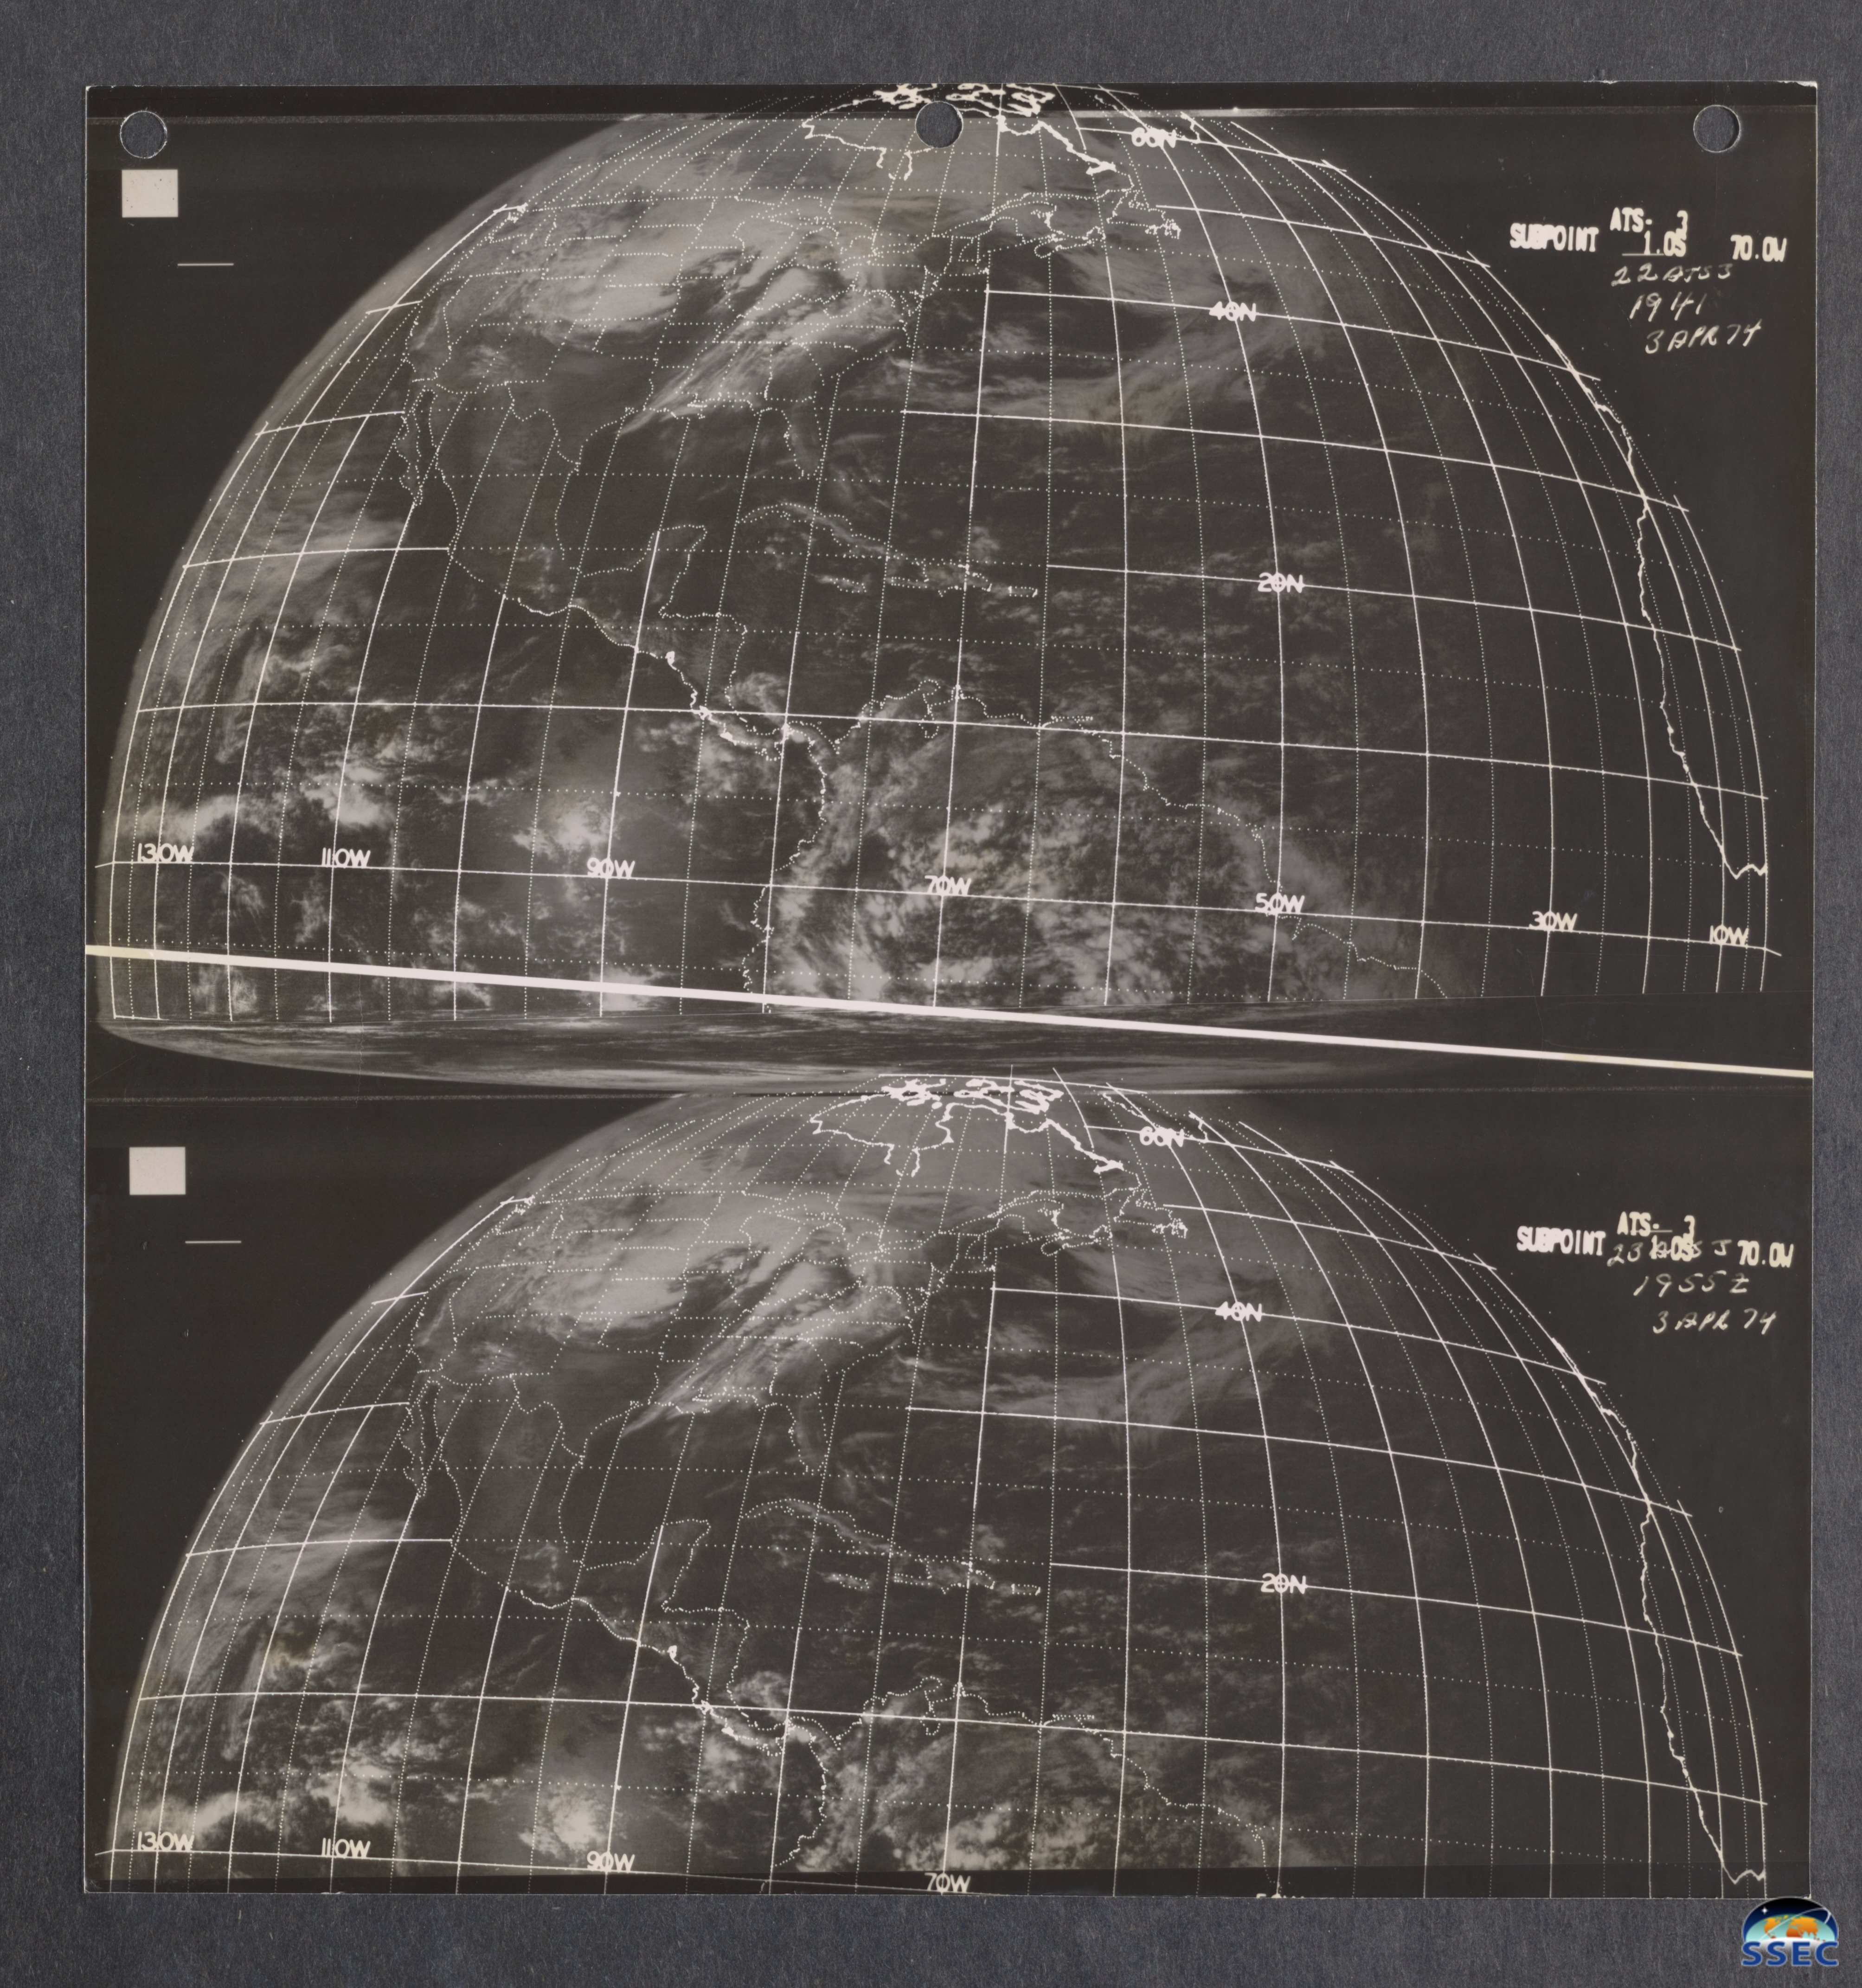
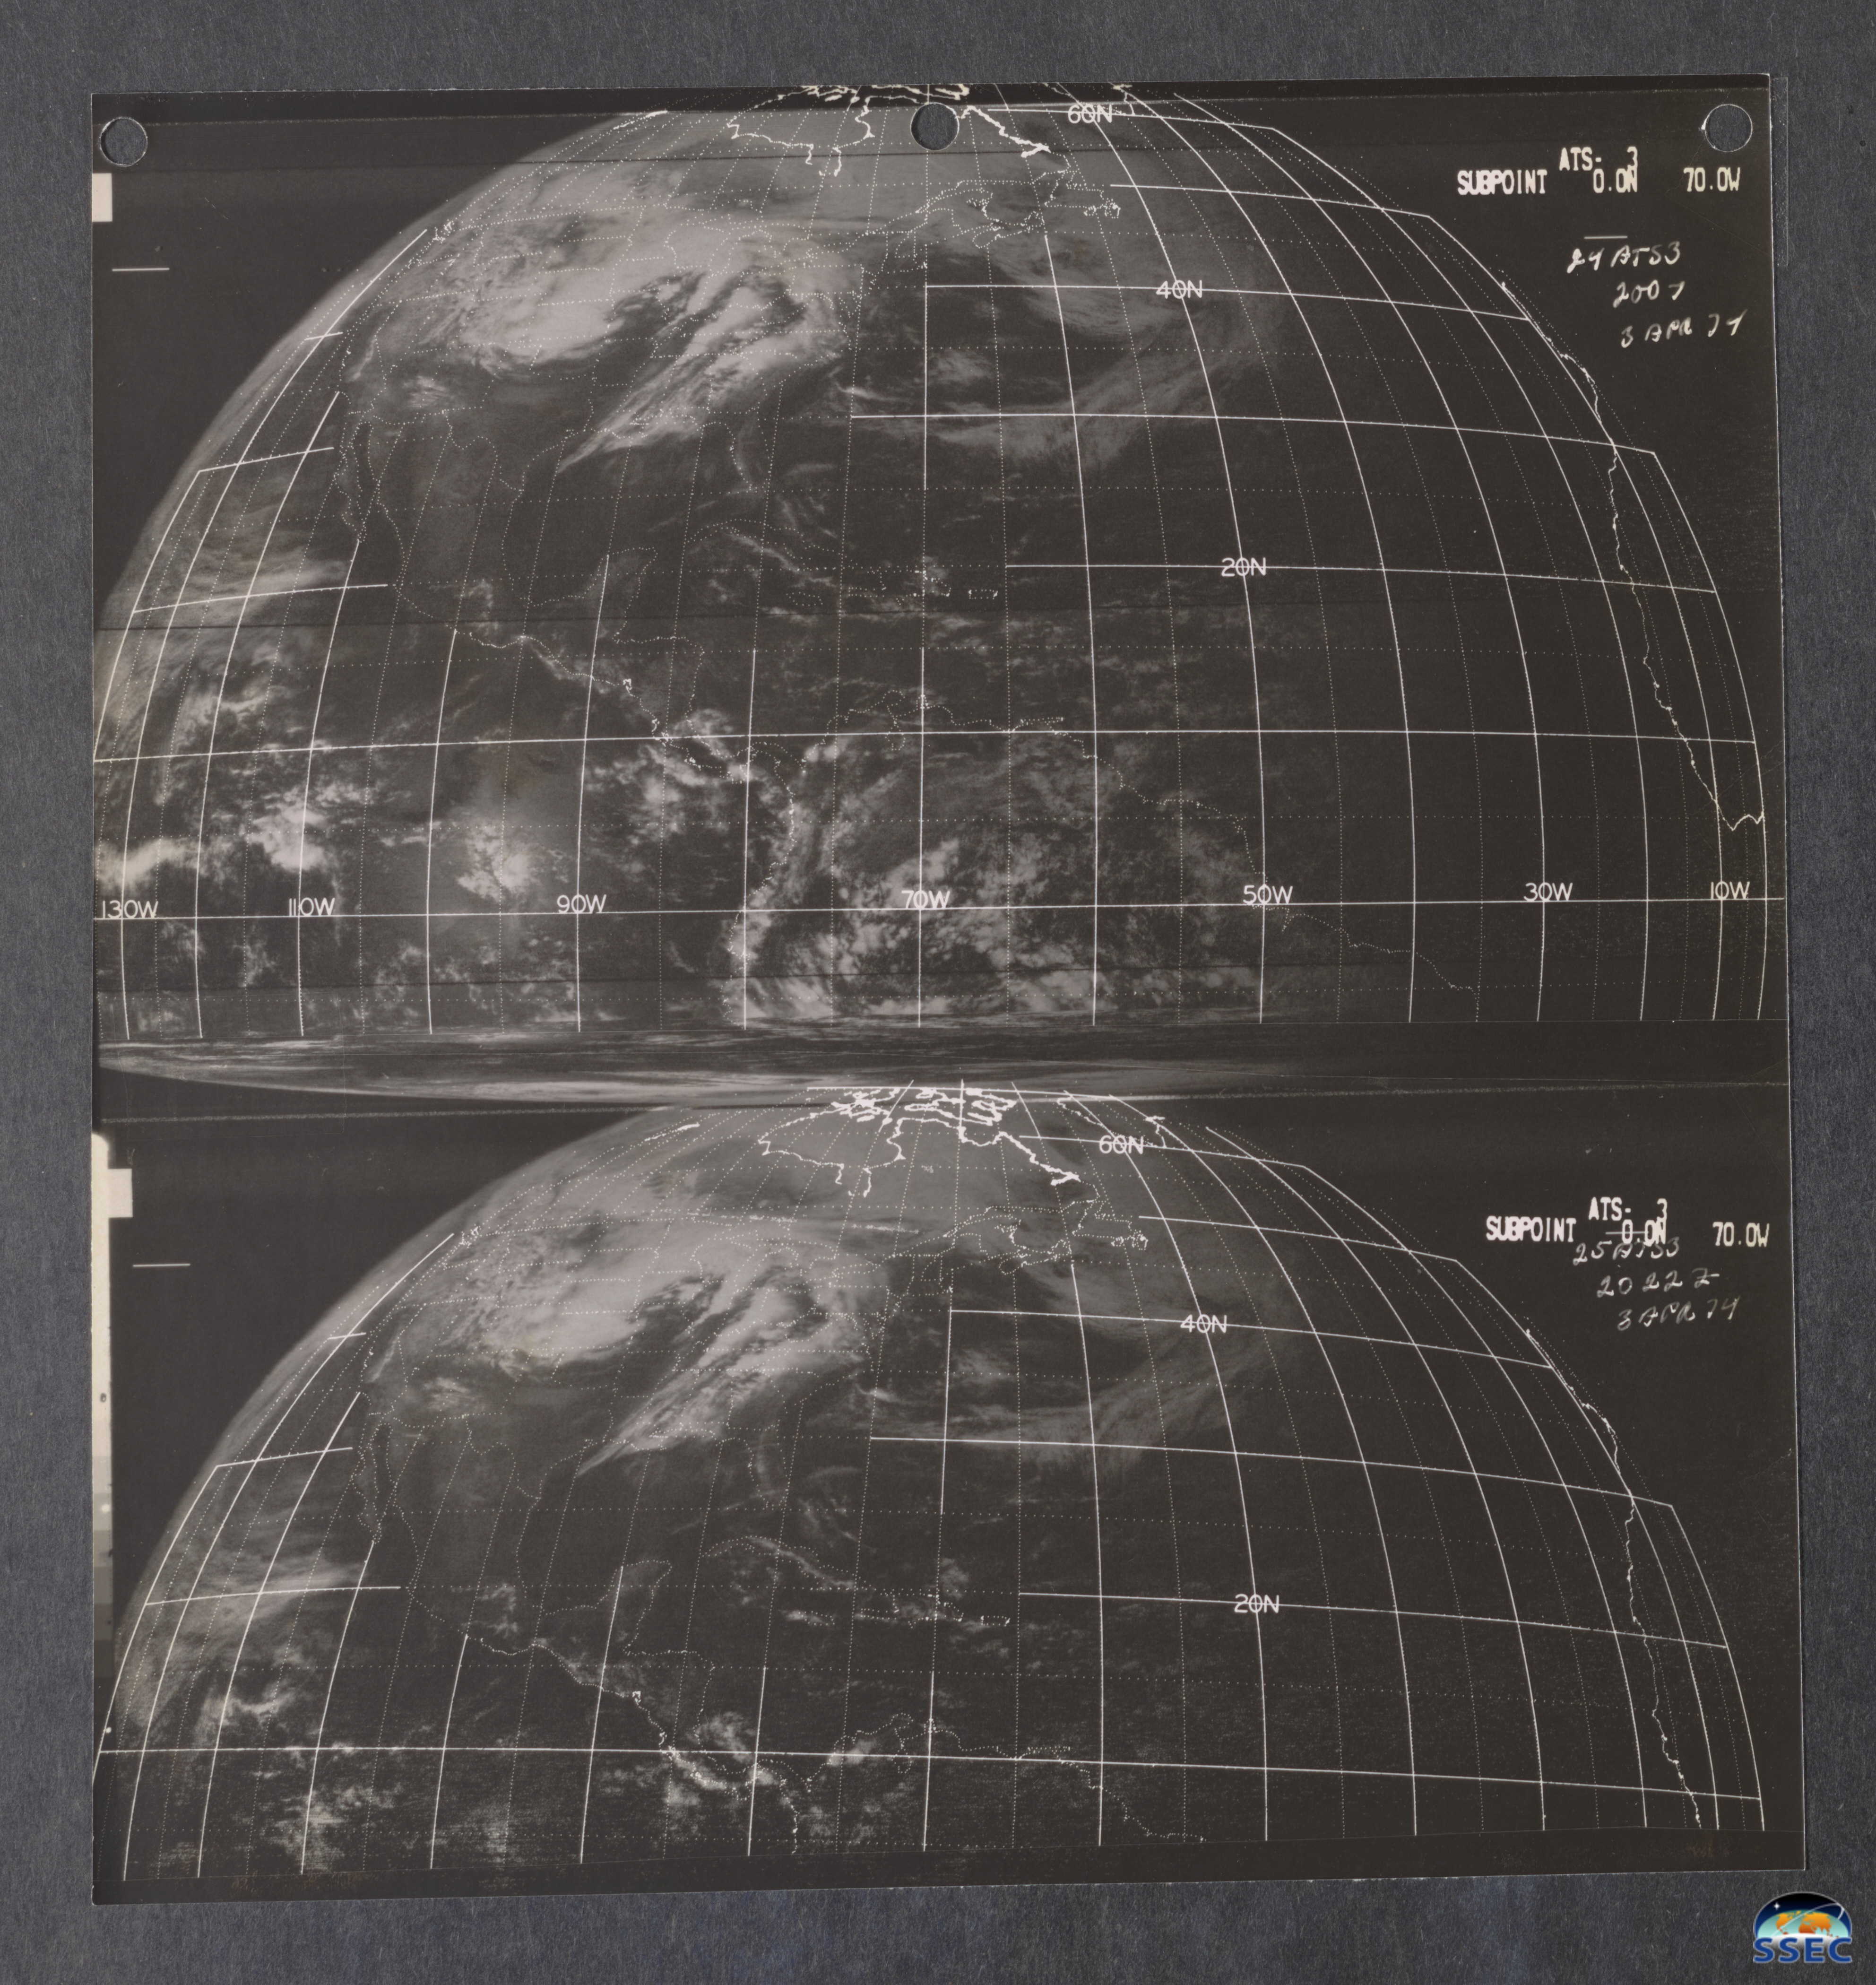
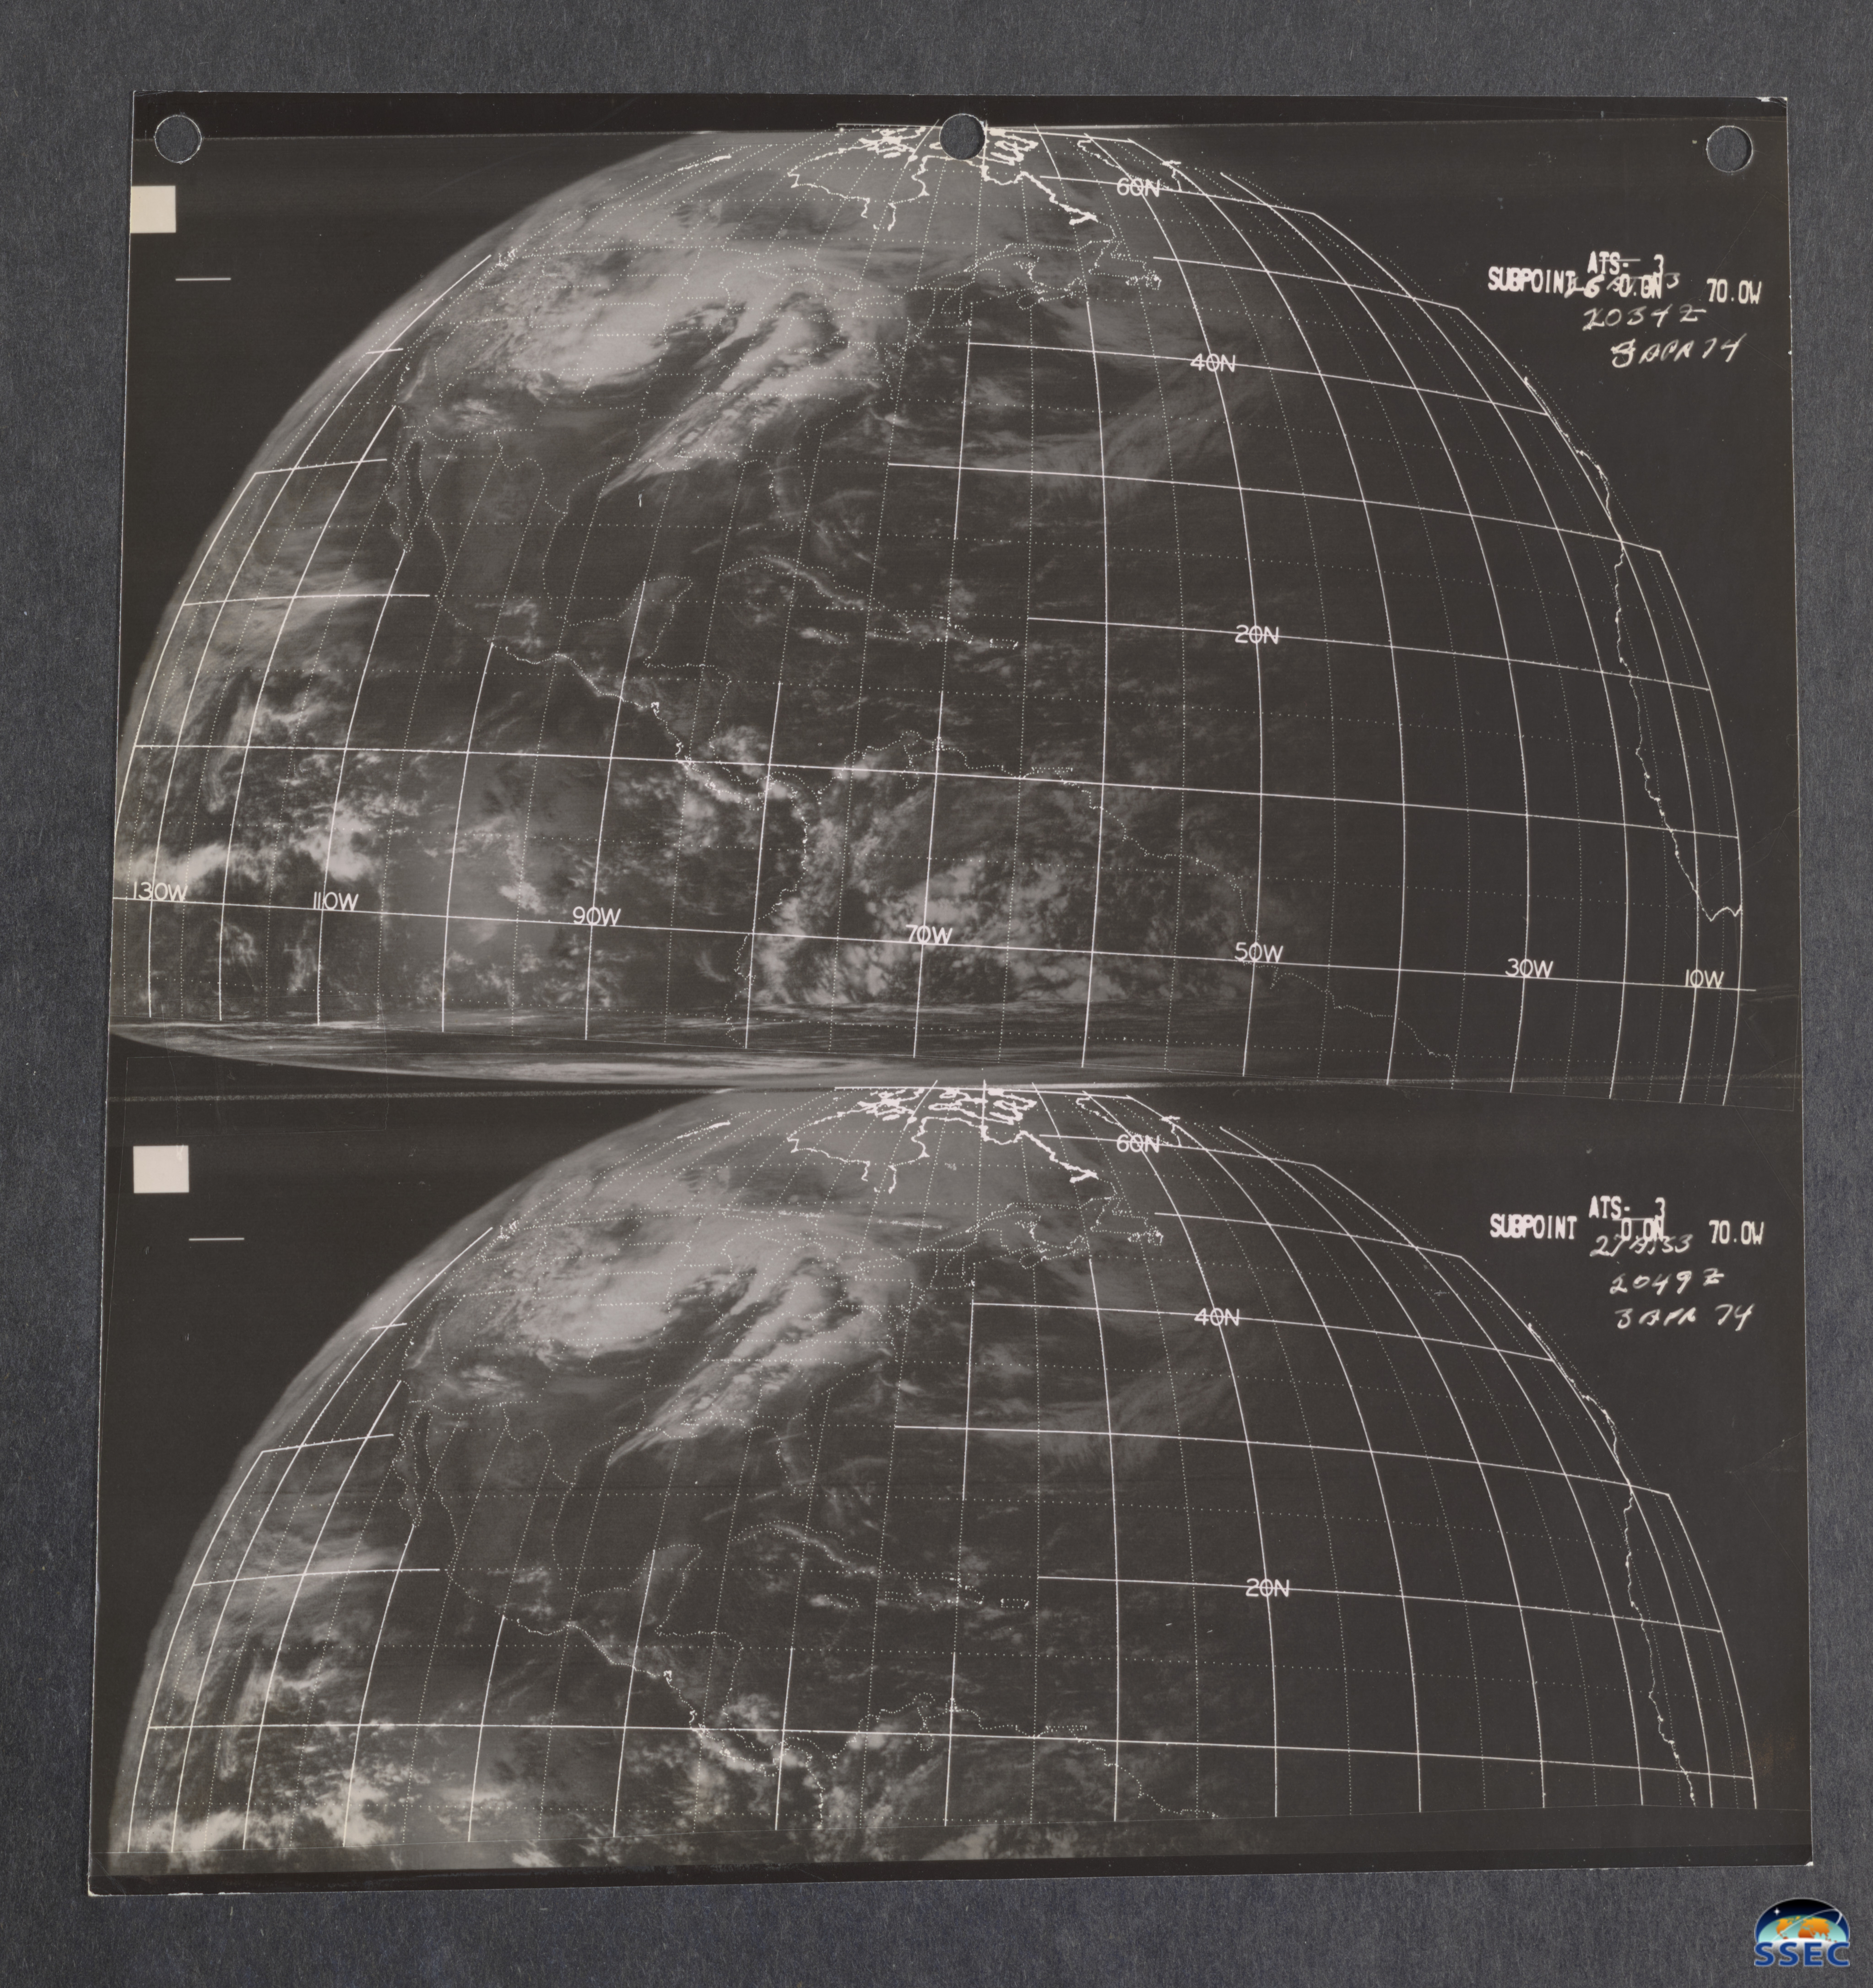
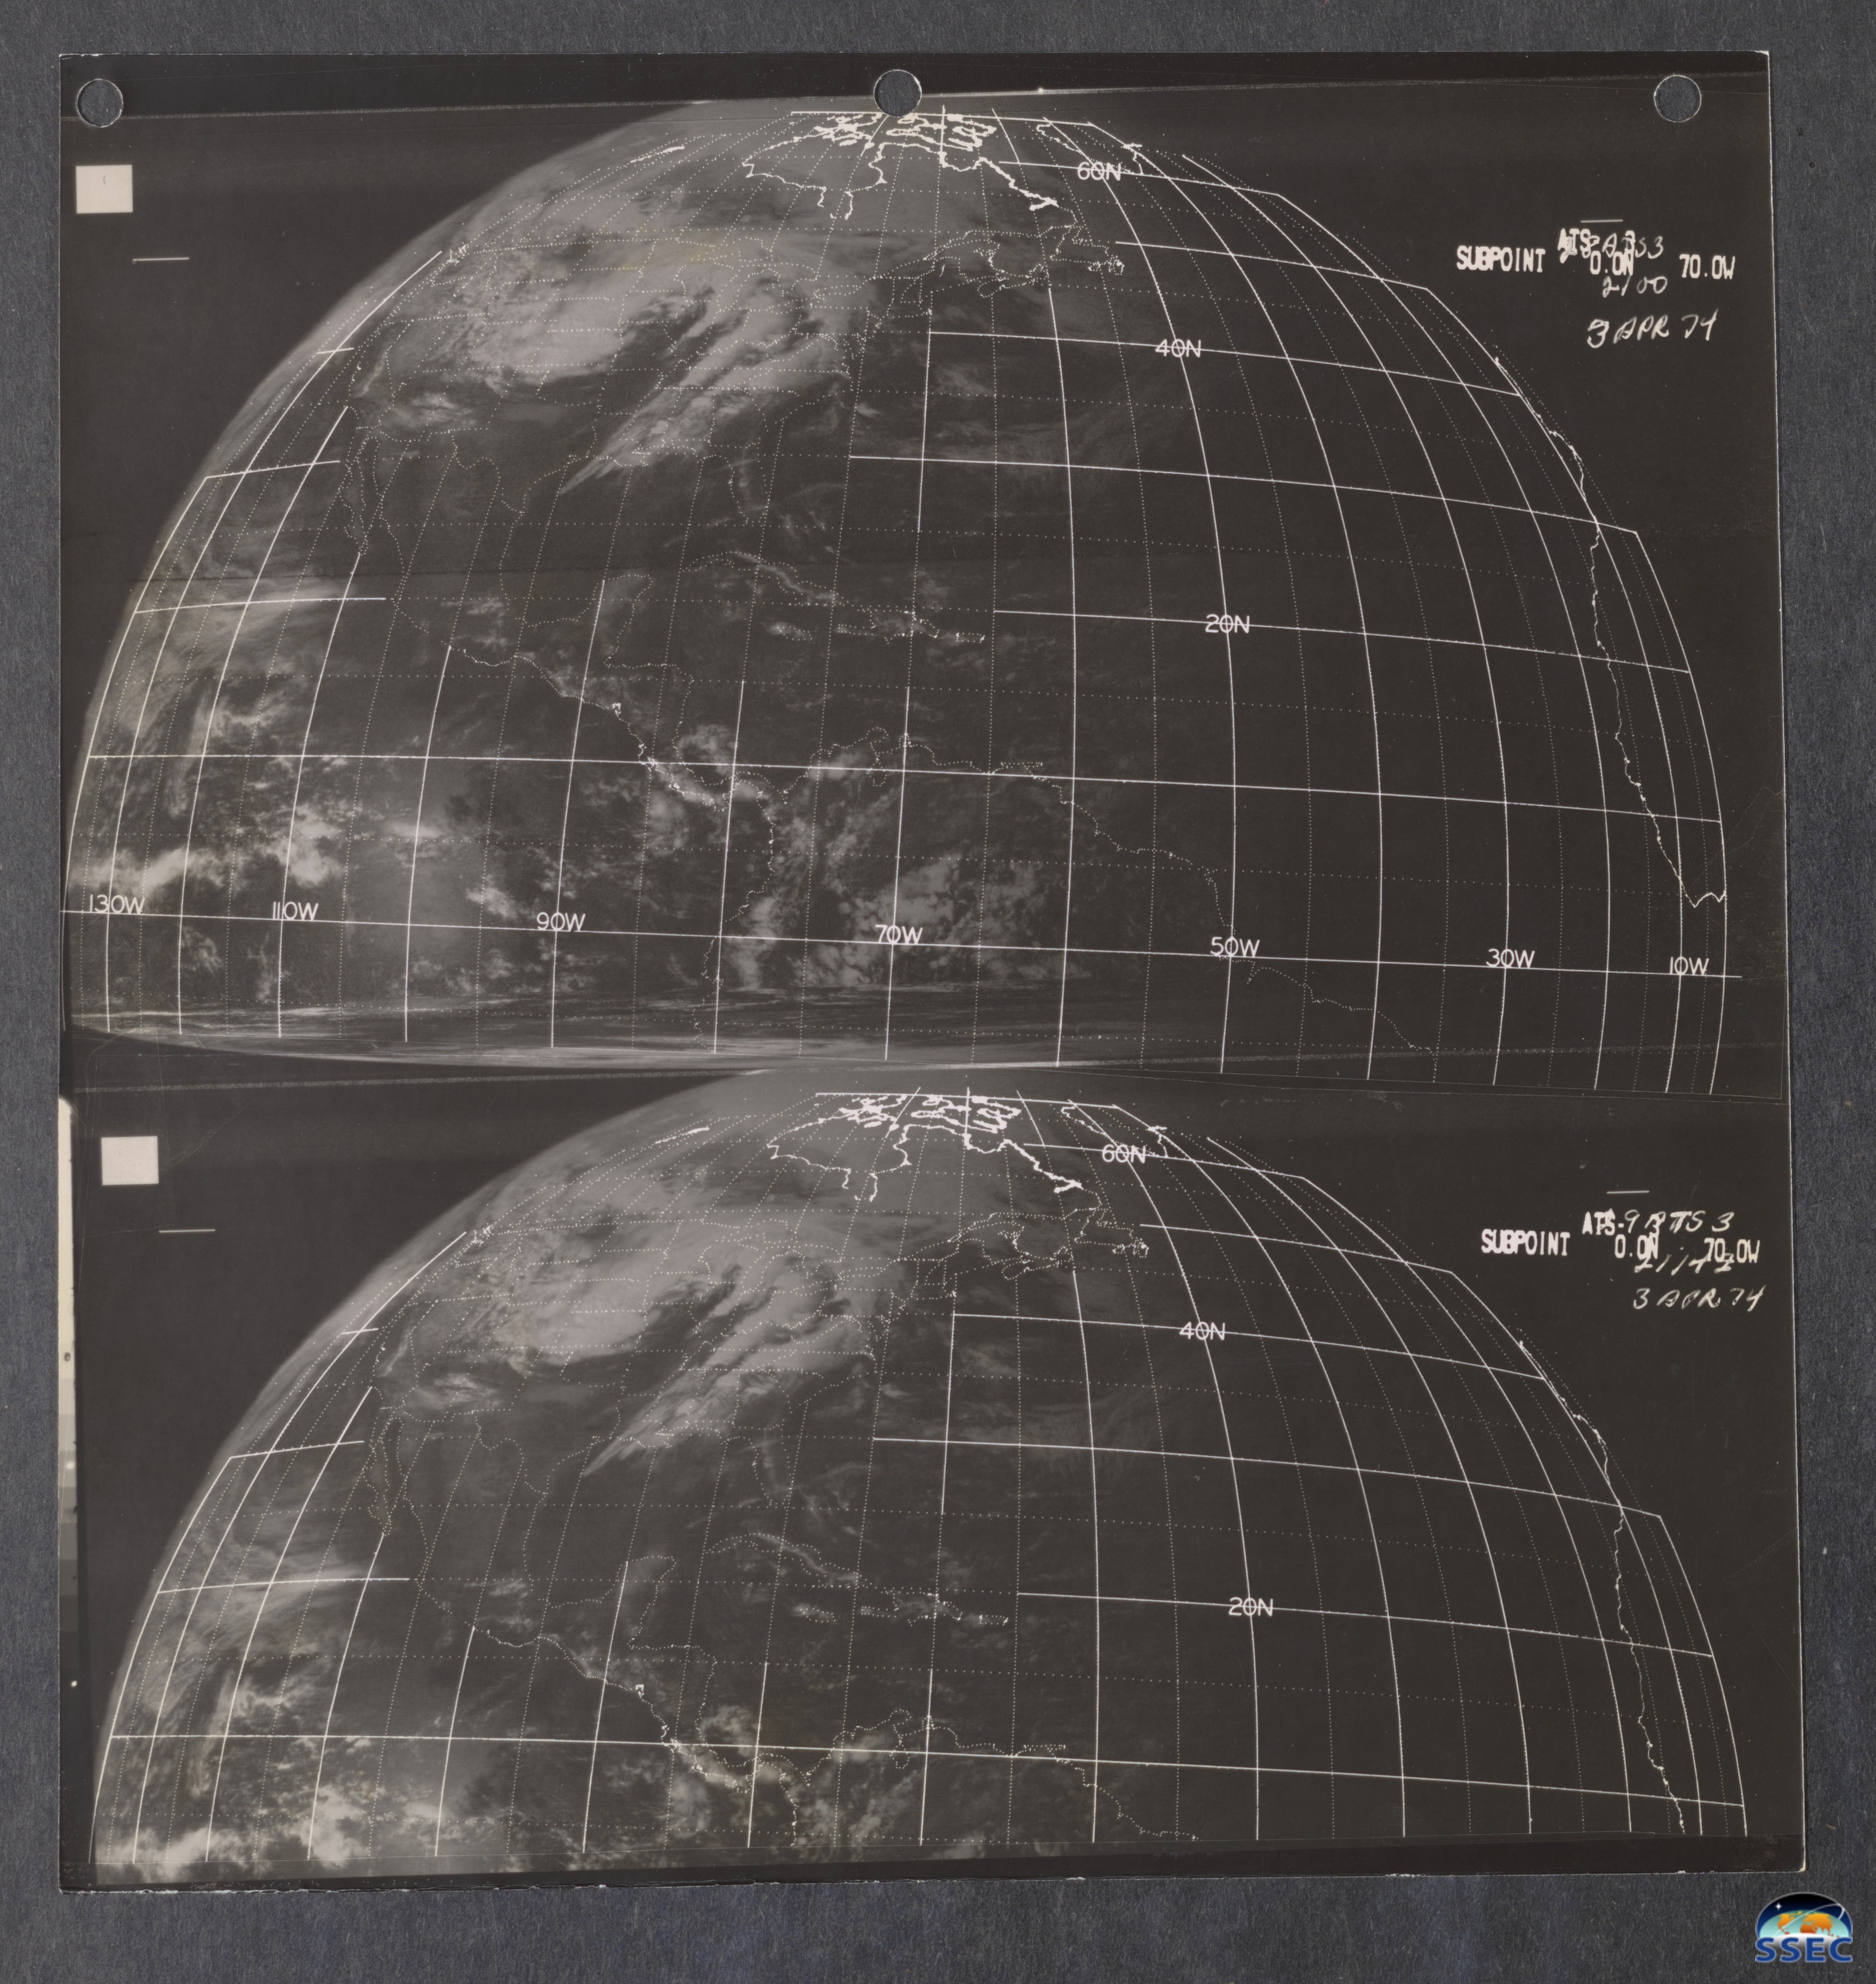
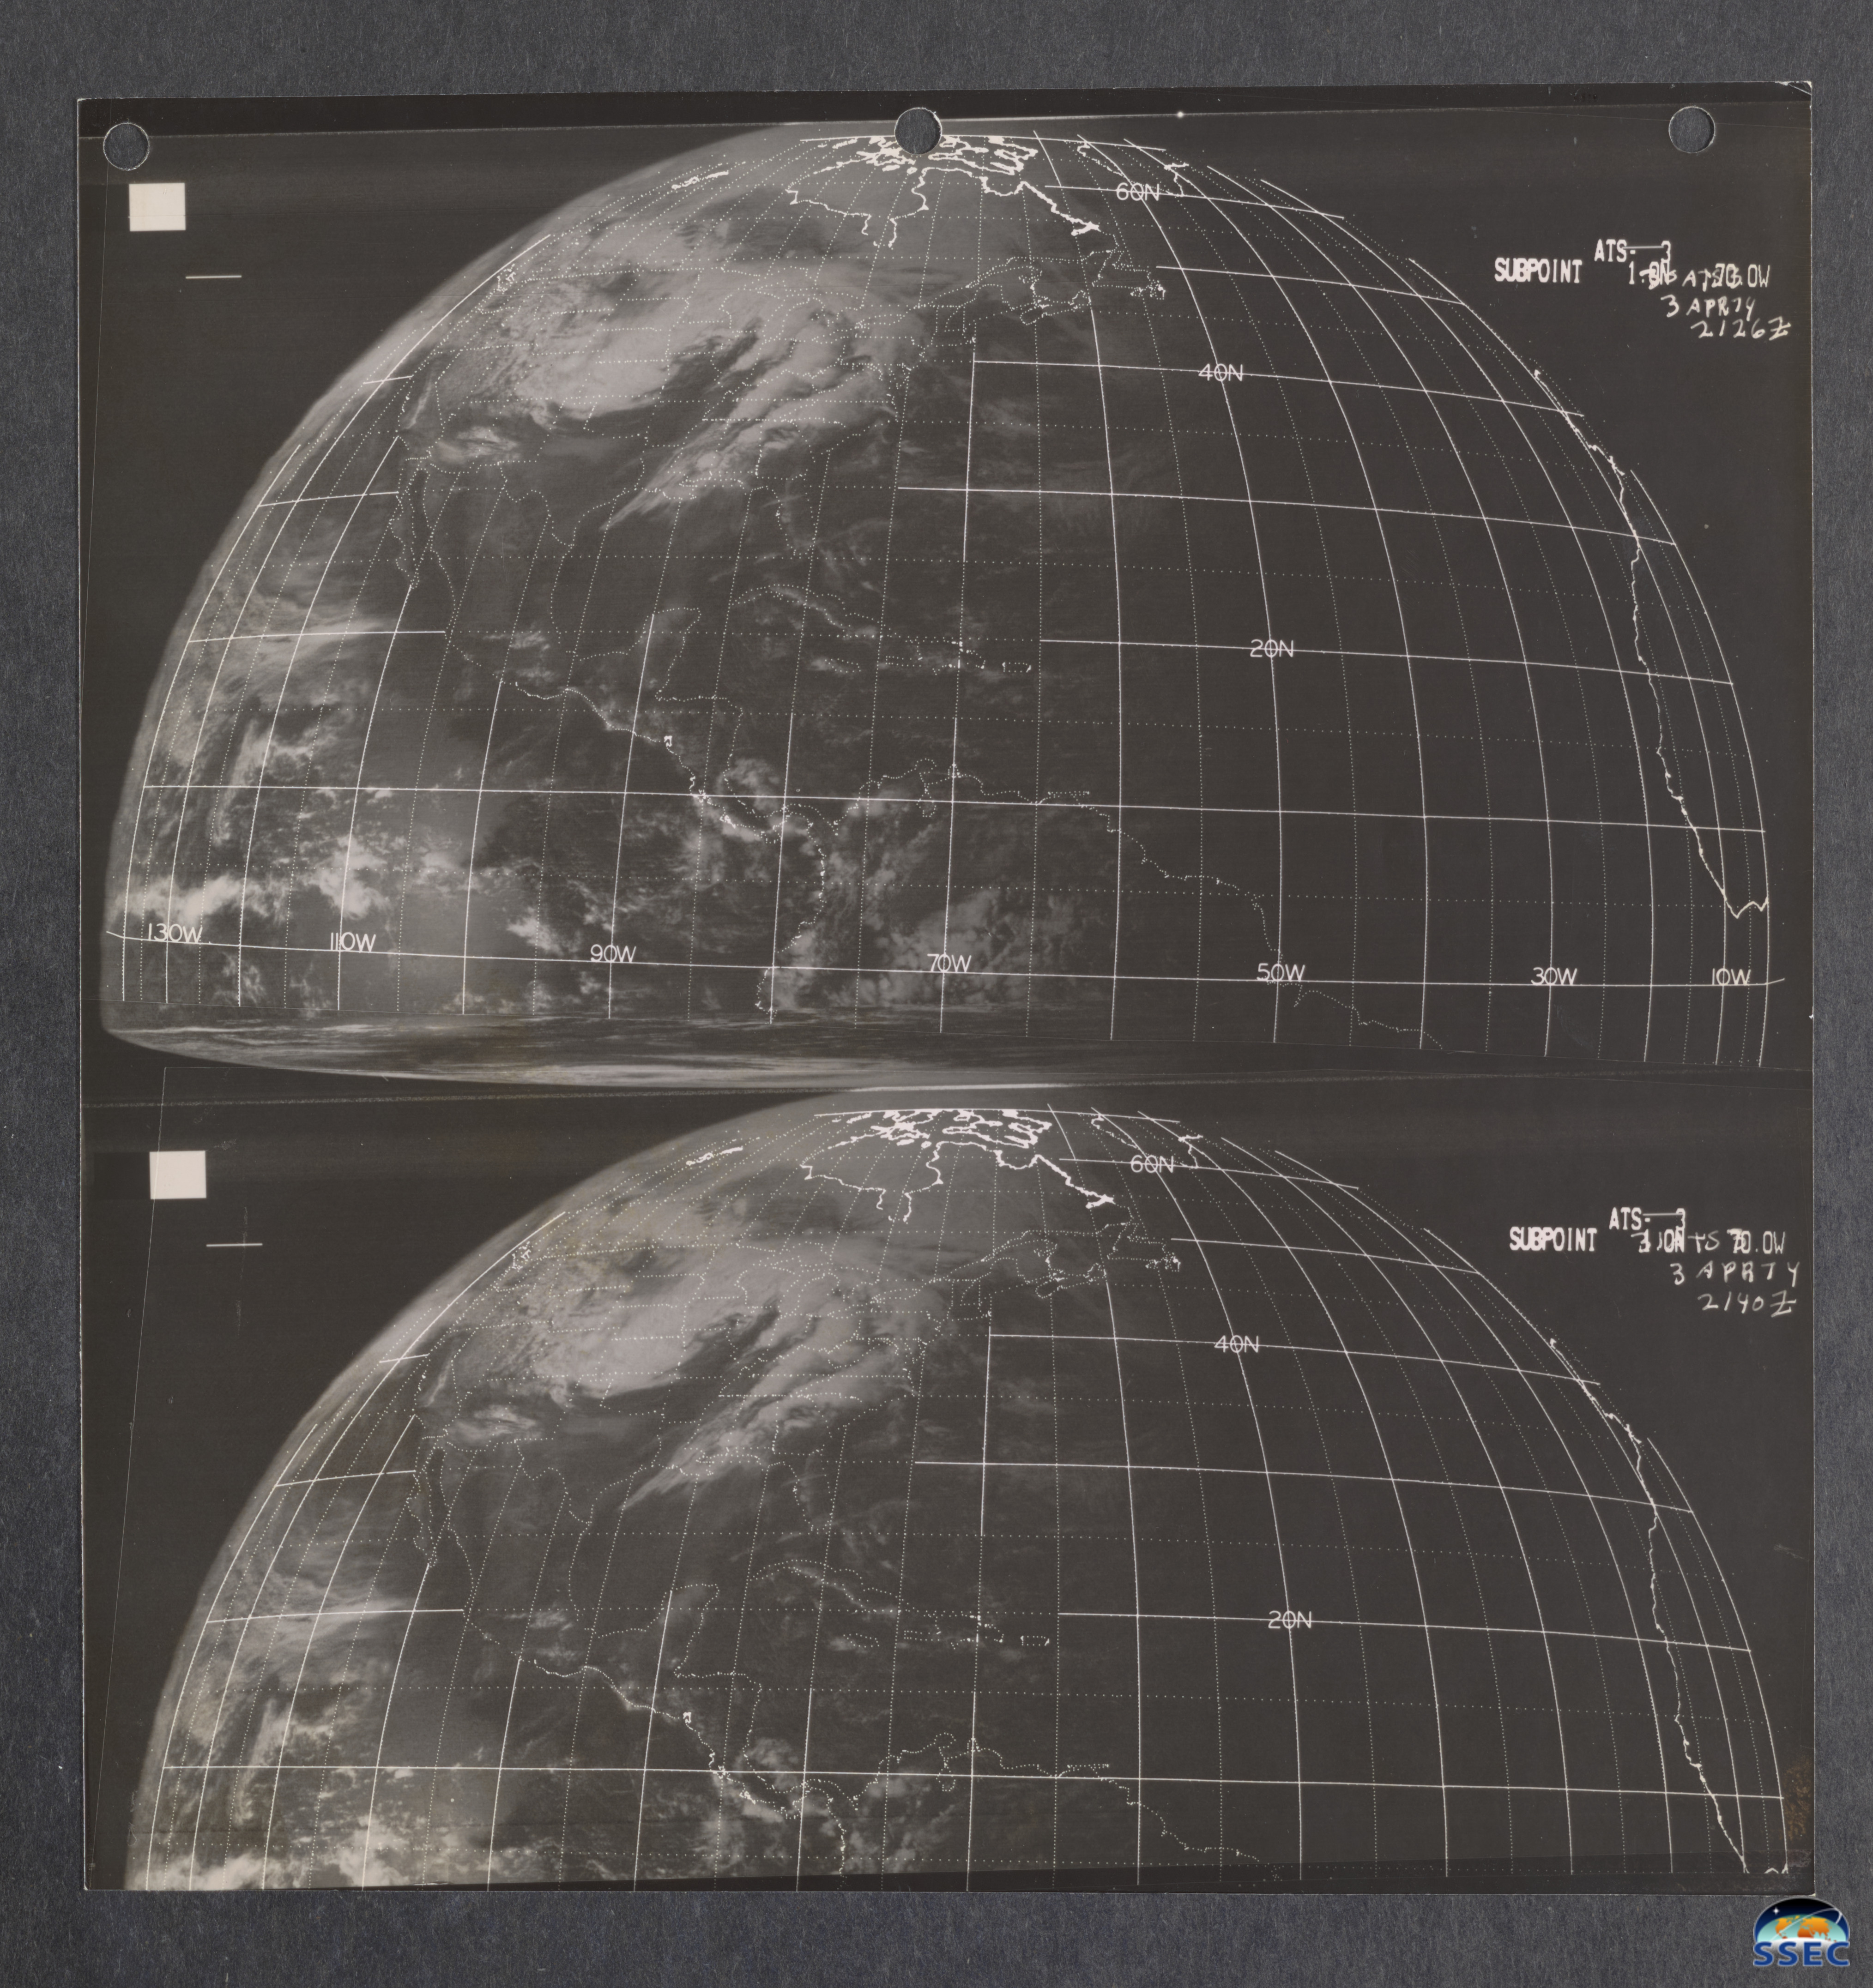
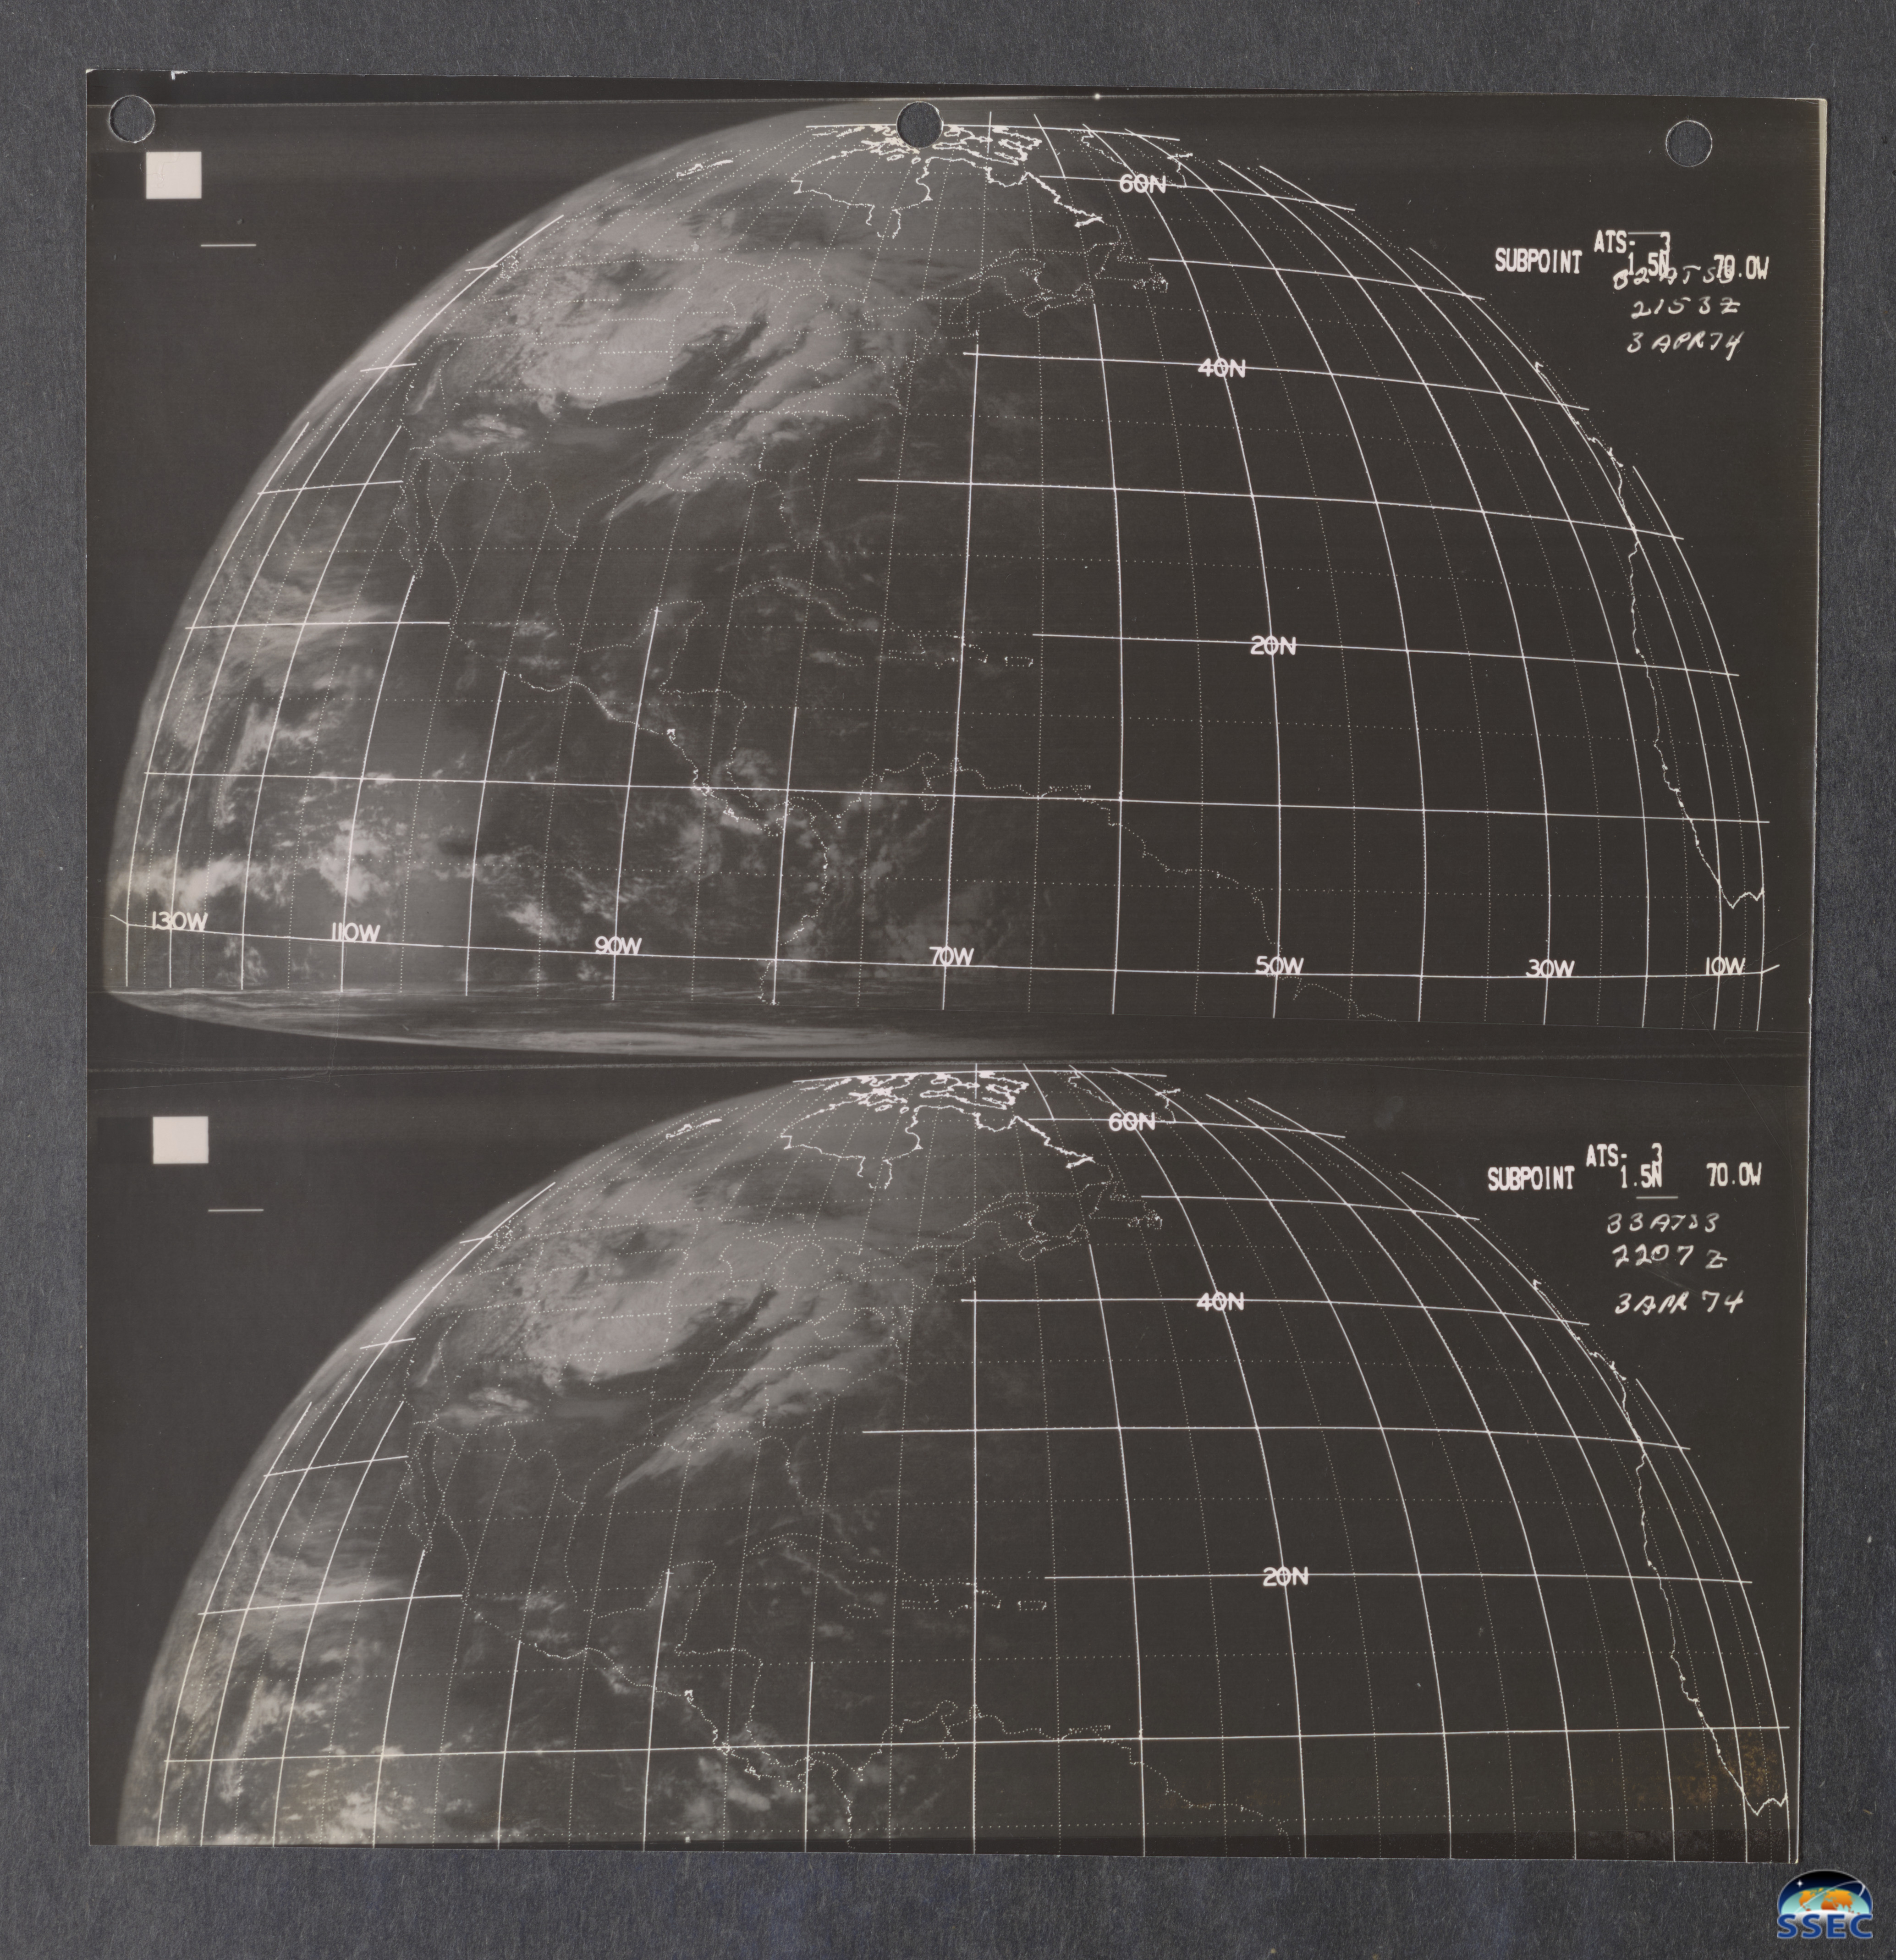
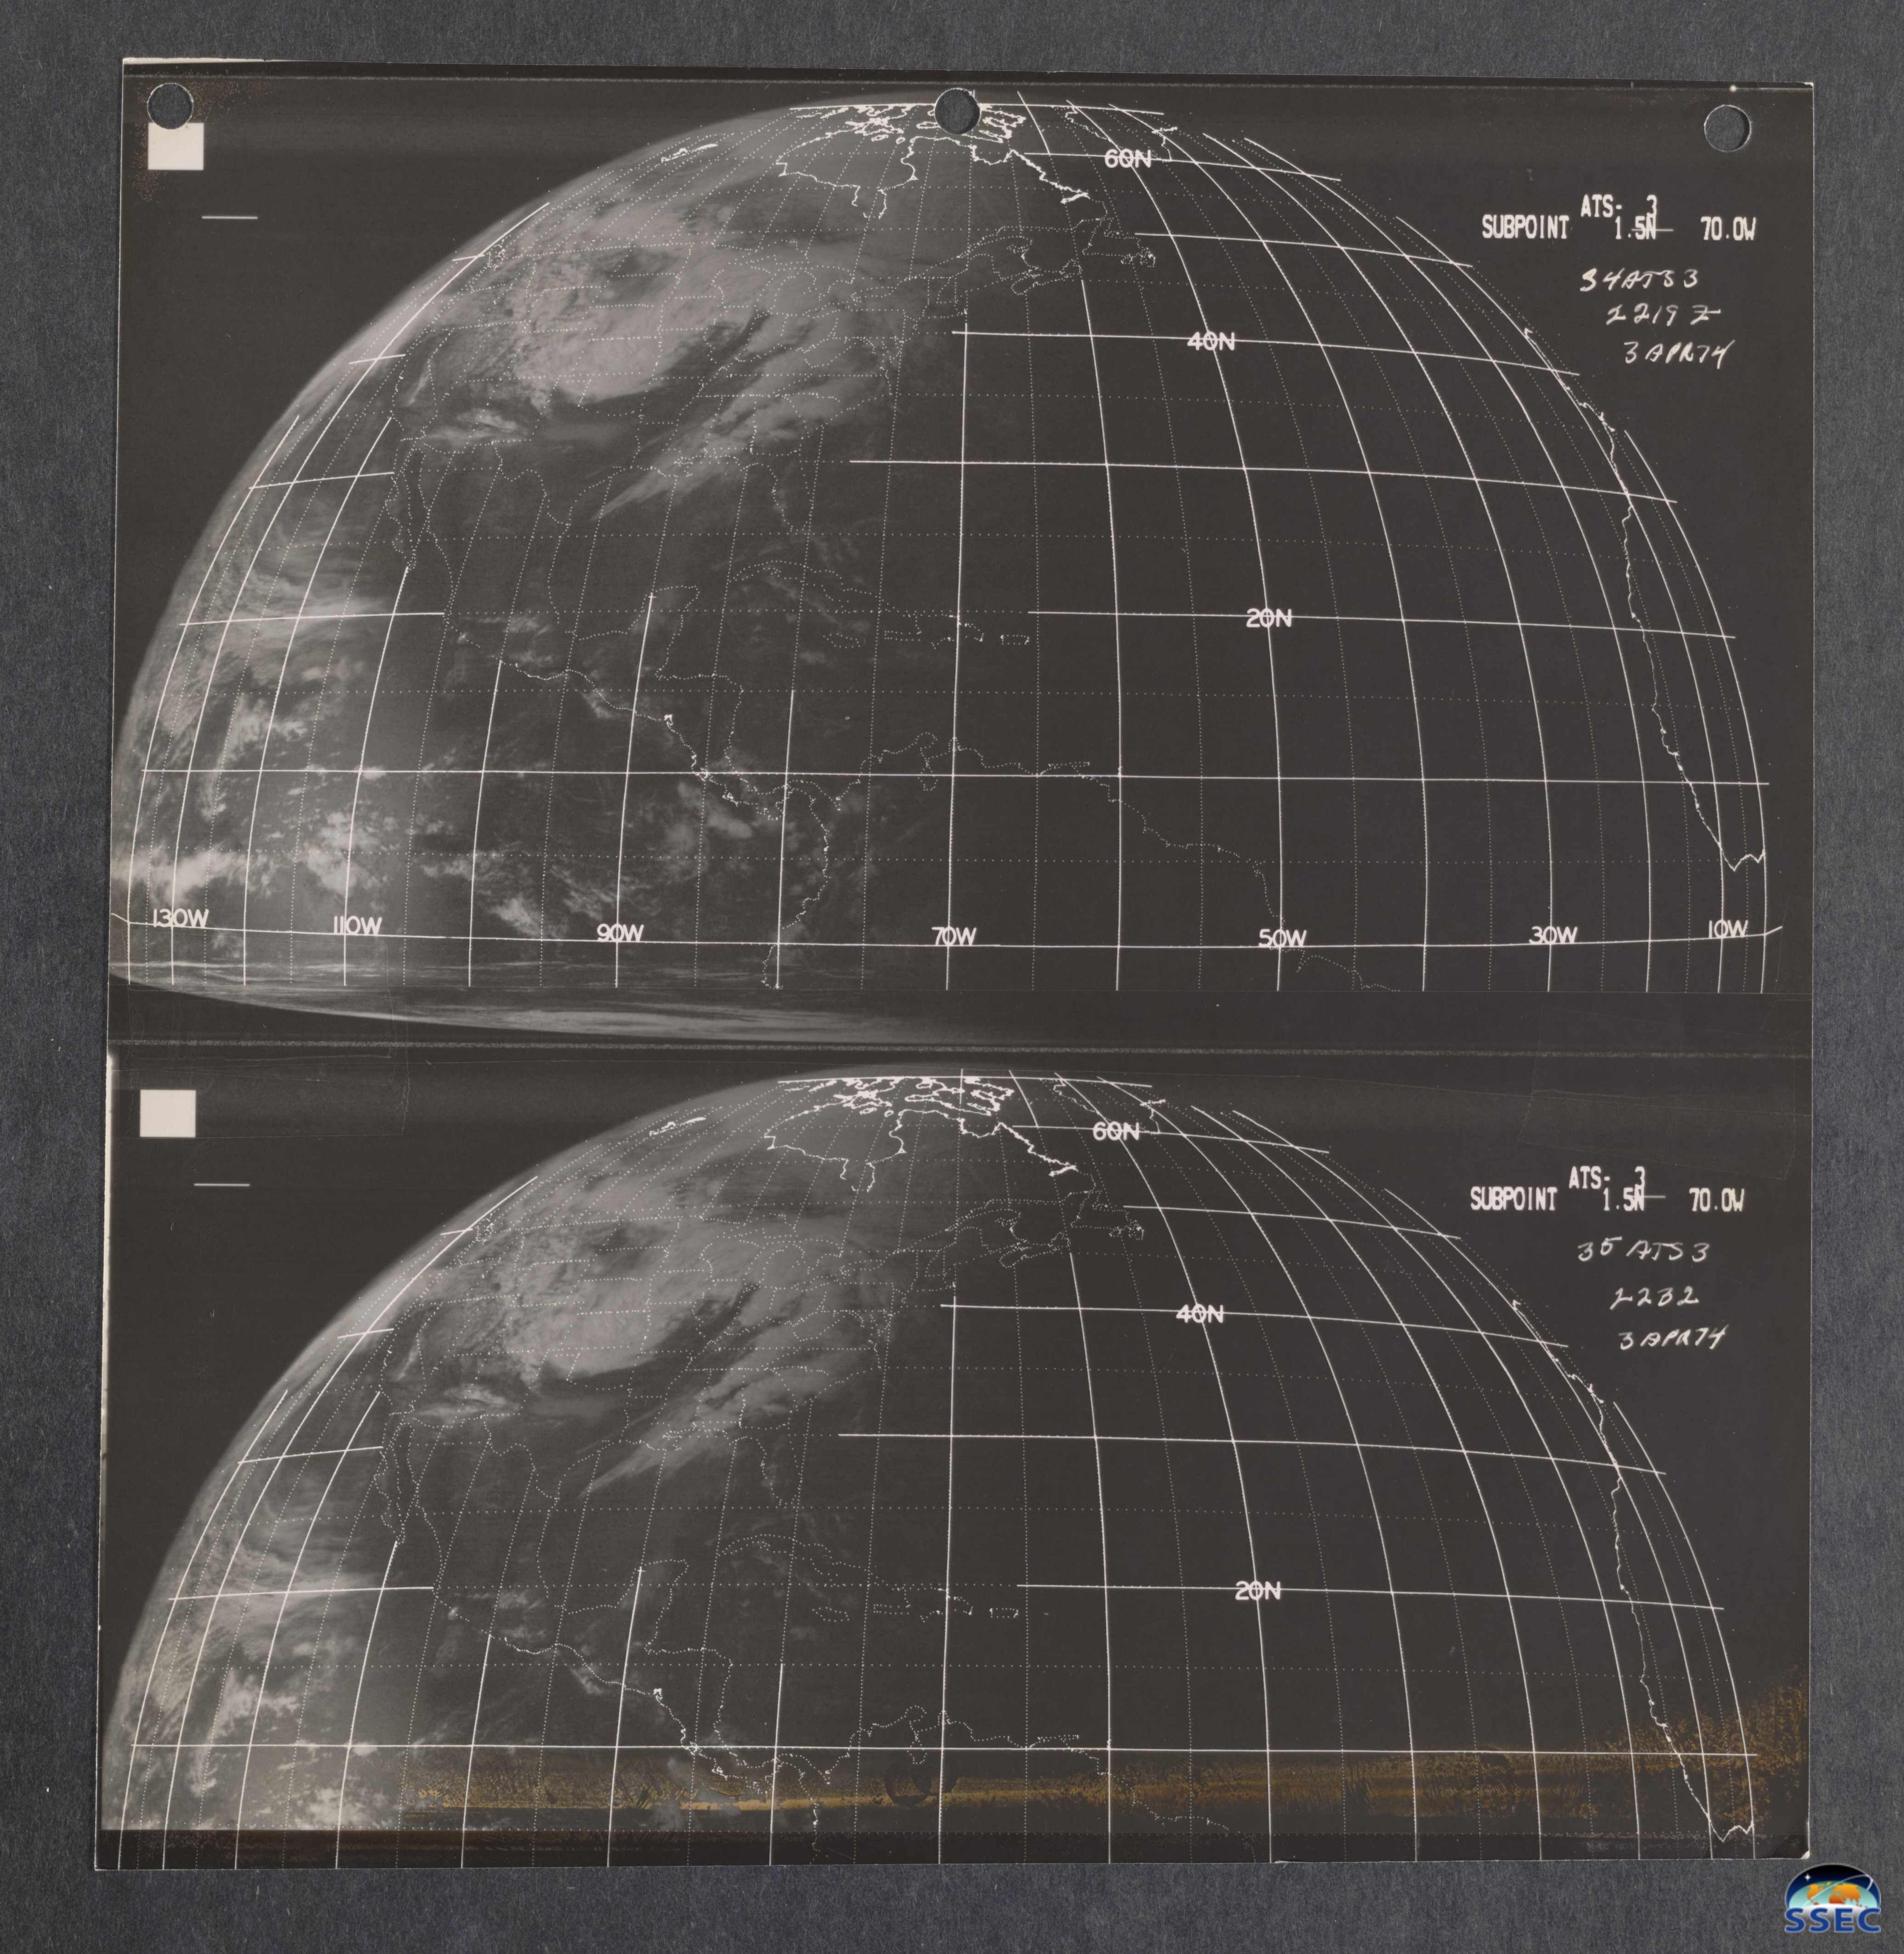
15-minute Imagery
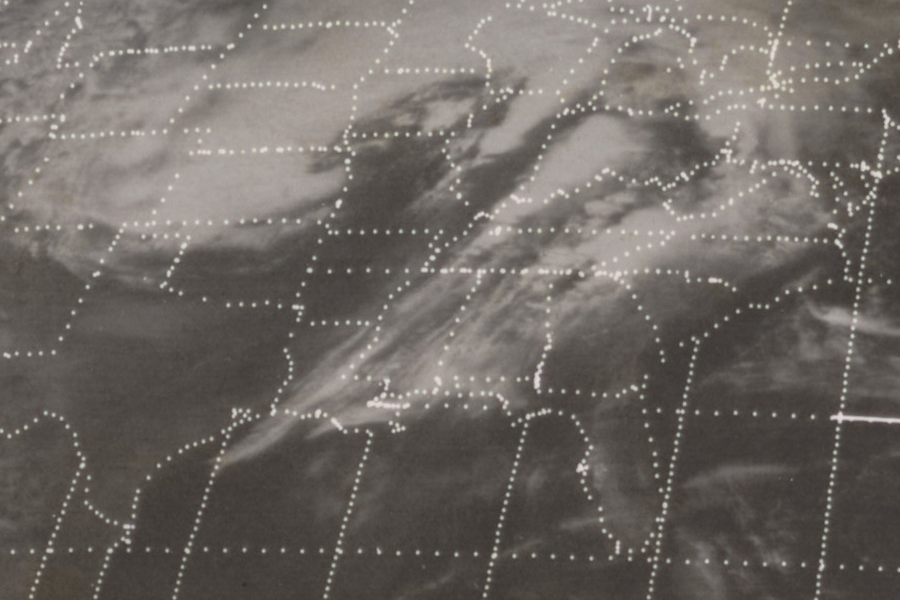
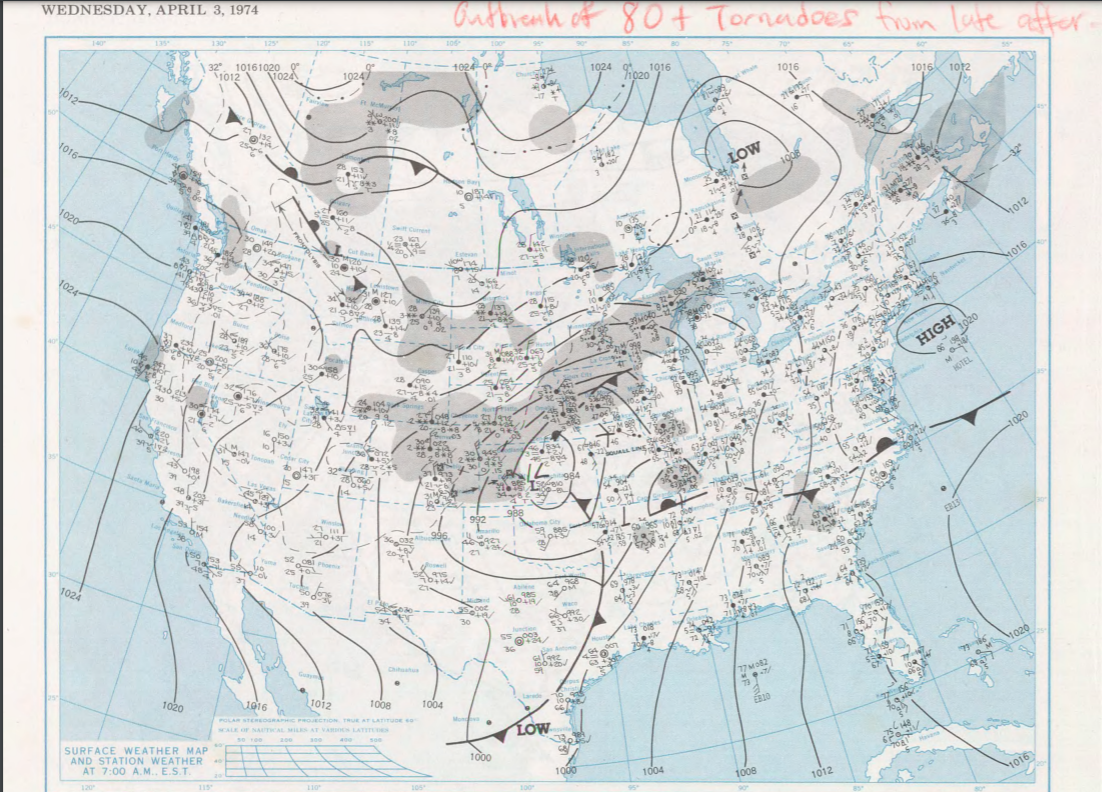
Normally, the ATS-3 acquired a Full Disk scan approximately every 30 minutes — but during this event two Northern Hemisphere sectors were scanned, providing 15-minute imagery for part of April 3, 1974. Individual images from 1941 UTC to 2307 UTC are displayed below. Large clusters of thunderstorms that produced many of the tornadoes were very apparent, along with a hazy plume of blowing dust that moved across much of North Texas in the wake of a strong cold front (surface analysis).
View only this post Read Less


