This website works best with a newer web browser such as Chrome, Firefox, Safari or Microsoft
Edge. Internet Explorer is not supported by this website.
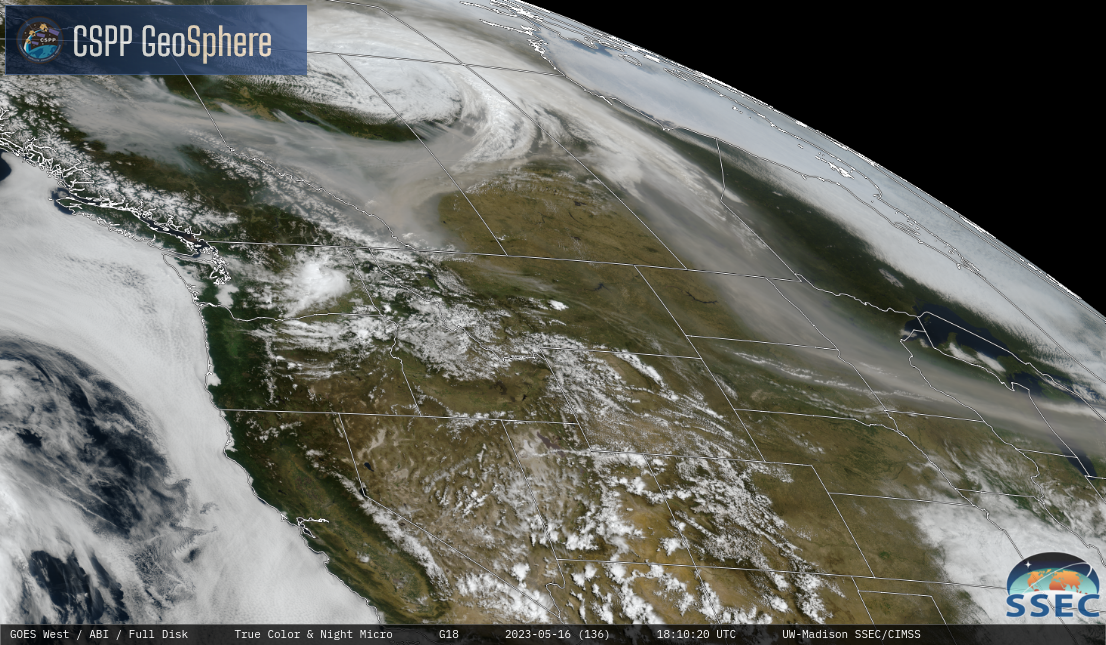
True-Color imagery from GOES-East (above, from the CSPP Geosphere site) and GOES-West (below, also from the CSPP Geosphere site) from 1720-1910 UTC show multiple active fires in British Columbia, Alberta and Manitoba, and a wide plume of smoke entrained into a storm centered just north of Saskatchewan (one wonders if the rain from the storm... Read More
True-Color imagery from GOES-East, 1720-1910 UTC on 16 May 2023
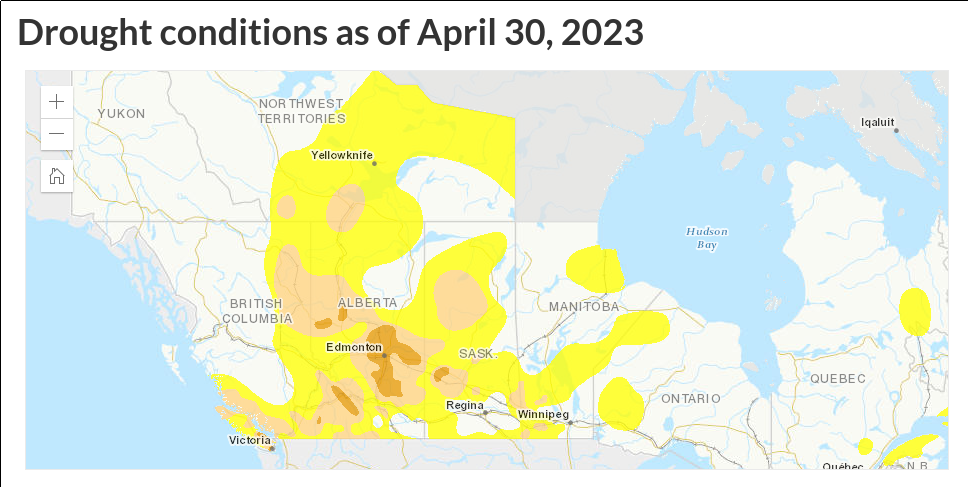
True-Color imagery from GOES-East (above, from the CSPP Geosphere site) and GOES-West (below, also from the CSPP Geosphere site) from 1720-1910 UTC show multiple active fires in British Columbia, Alberta and Manitoba, and a wide plume of smoke entrained into a storm centered just north of Saskatchewan (one wonders if the rain from the storm is somewhat muddy) and also moving south of the storm into the atmosphere above the Great Lakes. Drought conditions that have been widespread over Alberta (from this site) likely are contributing to the smoke production (which has been ongoing — see this CIMSS Blog Post from early May).
True-Color imagery from GOES-West, 1720-1910 UTC on 16 May 2023
TROPICS (Time-Resolved Observations of Precipitation structure and storm Intensity with a Constellation of SmallSats) satellite observations include microwave data at 12 different frequencies between 91.6 and 204.8 GHz. (Click here for a Satellite Book Club presentation on TROPICS). A TROPICS launch occurred from New Zealand in early May (link), boosting two satellites into orbit; a second launch is pending. In addition, TROPICS Pathfinder... Read More
TROPICS Pathfinder imagery, 91.6 GHz (top) and 204.8 GHz (bottom) for five scans from 20:52 UTC on 11 May 2023 through 19:45 UTC on 14 May 2023 (Click to enlarge)
TROPICS (Time-Resolved Observations of Precipitation structure and storm Intensity with a Constellation of SmallSats) satellite observations include microwave data at 12 different frequencies between 91.6 and 204.8 GHz. (Click here for a Satellite Book Club presentation on TROPICS). A TROPICS launch occurred from New Zealand in early May (link), boosting two satellites into orbit; a second launch is pending. In addition, TROPICS Pathfinder launched in 2021 (link), was designed to test TROPICS capabilities (see this blog post), and is still transmitting the data used in this Blog post. The animation above, from a website internal to SSEC, shows TROPICS data over the Indian Ocean from 11 May through 14 May. Land/sea differences are discernible in the 91.6 GHz imagery on top, but not in the 204.8 GHz imagery on the bottom; microwave energy at 204.8 GHz is absorbed by water vapor in the atmosphere.
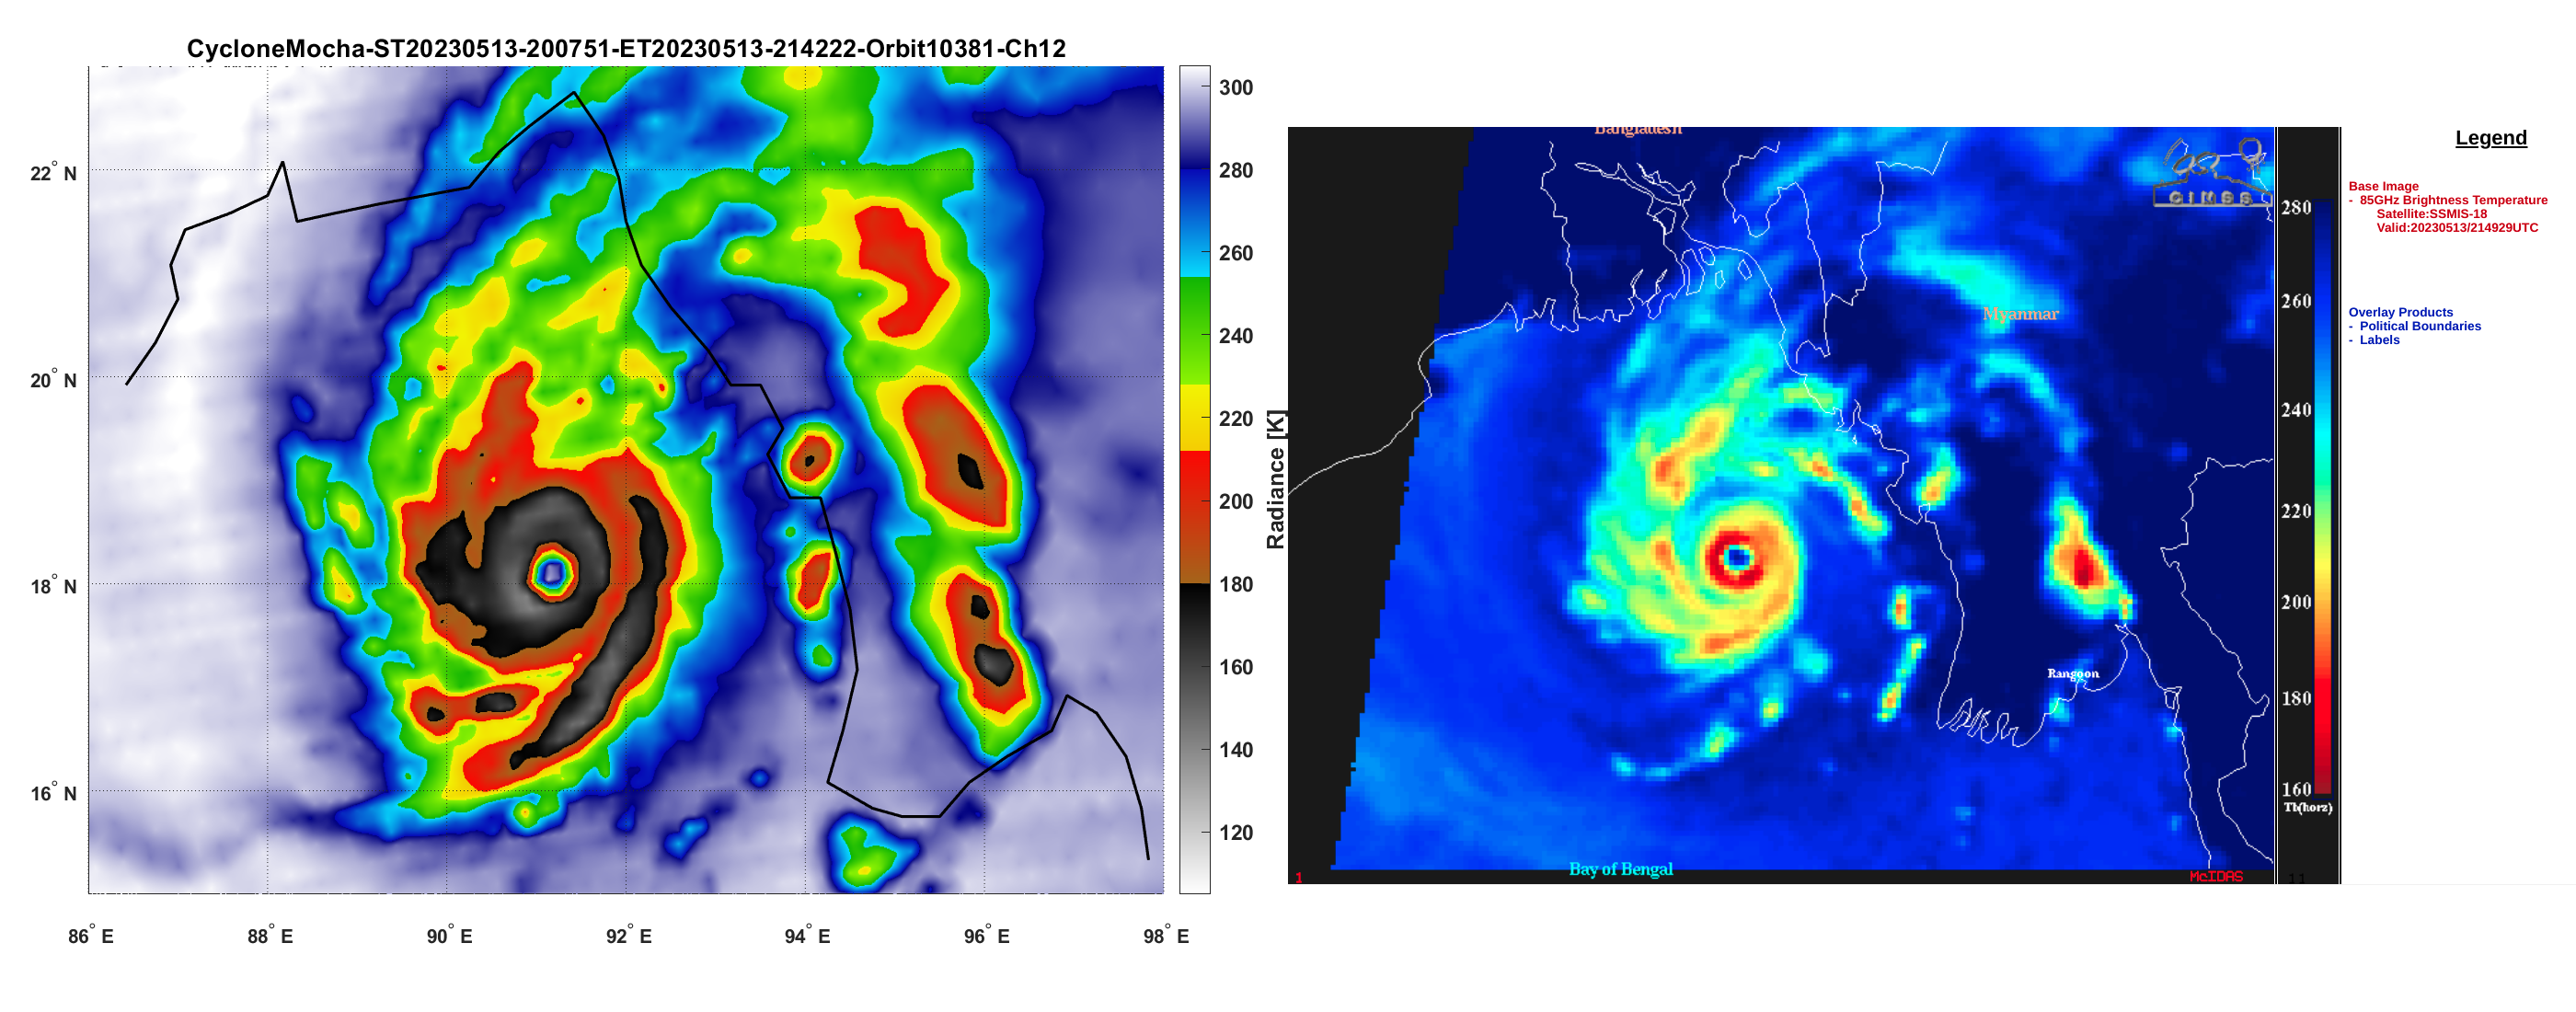
Storm-centered (and zoomed-in) imagery from TROPICS (204.8 GHz) (courtesy the TROPICS team including Glenn Perras at Nick Zorn at MIT/LL), shown below, is compared from the DSMP SSMI/S imagery (85 GHz) (from this CIMSS Blog Post, courtesy Scott Bachmeier) at nearly the same time. The TROPICS Channel 12 data is more influenced by water vapor in the atmosphere; the SSMI/S 85 GHz data is more affected by scattering by ice. That could account for some differences in the imagery, especially in rain bands. There is excellent overall agreement between the two images, however.
TROPICS Channel 12 (204.8 GHz) at 2142 UTC on 13 May 2023 (Left) and DMSP-18 SSMI/S 85 GHz at 2134 UTC on 13 May 2023 (Right); Click to enlarge)
Earlier overpasses over the storm are shown below (images also courtesy of from Glenn Perras and Nick Zorn, MIT/LL). The ongoing organization of the storm between the two times includes the development of a cold brightness temperature ring around they eye. The evolution of the Himawari-9 Clean Window Band 13 (10.4 µm) imagery (at half-hour time-steps) spanning the two times below is here. It also shows increasing organization.
TROPICS Pathfinder Channel 12 (204.8 GHz) at 2204 UTC on 12 May and 0731 UTC on 13 May 2023 (Click to enlarge)
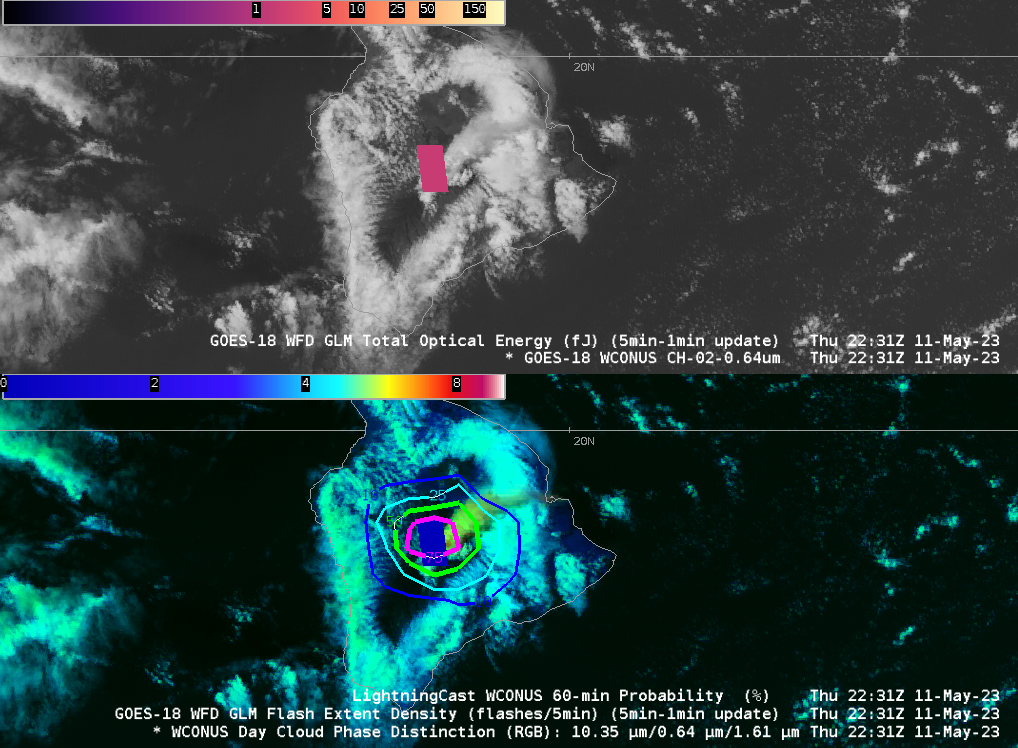
The animations above show thundershower development over the Big Island of Hawai’i on 11 May 2023. LightningCast Probabilities correctly diagnosed the increasing lightning threat, with elevated probabilities (50%) occurring before the first observed Geostationary Lightning Mapper (GLM) flash at 2136 UTC. LightningCast gave situational awareness on this day. (The images... Read More
Top Images: GOES-18 Visible Imagery (Band 2, 0.64 µm) and GLM Total Optical Energy (scaled from 0-300), 2046 UTC 11 May 2023 through 0201 UTC 12 May 2023; Bottom Images: GOES-18 Day Cloud Phase Distrinction, GOES-18 GLM Flash Extent Density (scaled from 0-10) and contour of ProbSevere LightningCast Probabilities, 2046 UTC 11 May 2023 throuigh 0201 UTC 12 May 2023 (Click to enlarge)
The animations above show thundershower development over the Big Island of Hawai’i on 11 May 2023. LightningCast Probabilities correctly diagnosed the increasing lightning threat, with elevated probabilities (50%) occurring before the first observed Geostationary Lightning Mapper (GLM) flash at 2136 UTC. LightningCast gave situational awareness on this day. (The images above were created using the TOWR-S AWIPS Cloud Instance: Thanks!)
The NWS Forecast Office in Guam sits under the footprint of Himawari-9, a satellite that does not carry a Geostationary Lightning Mapper (GLM). LightningCast Probability was trained to predict GLM flash events based on a combination of ABI Bands (2, 5, 13 and 15 at 0.64 µm, 1.61 µm, 10.3 µm and 12.3 µm, respectively; a training video describing LightningCast is available here). The corresponding bands on AHI are 3, 5, 13 and 15 (at 0.64 µm, 1.61 µm, 10.4 µm and 12.3 µm, respectively); the 1.61 µm band on AHI has 2-km resolution rather than 1-km as on ABI. Ground-based lightning is used to detect lightning at Guam because Himawari-9 does not carry an optical lightning detector such as ABI’s GLM. (Indeed, the only satellite detection of lightning that occurs at Guam is from the LIS (Lightning Imaging Sensor) on the International Space Station. It was not overflying Guam during the times shown above). Ground-based lightning detection networks may not detect in-cloud or cloud-to-cloud lightning strokes that are detected by GLM. Thus the lightning detected in the animations below is possibly less than what a GLM instrument would have detected. The animations below do show lead time for situational awareness of lightning given the 10-minute scanning cadence of Himawari-9 full-disk imagery.
Nine-panel AWIPS display 0220-0310 UTC on 11 May 2023 (Courtesy Brandon Aydlett). Top Row, upper left: HImawari-9 Visible imagery (Band 3, 0.64 µm) and Infrared (Band 13, 10.4 µm) along with LightningCast Probability contours (left, center). Other panels show various Radar fields, including Base Reflectivity (upper right) (Click to enlarge). Note the NLDN Lightning Strikes from 0300 – 0310 UTC. Himawari does not send AHI data at 0240 UTC.Nine-panel AWIPS display 0310-0540 UTC on 11 May 2023 (Courtesy Brandon Aydlett). Top Row, upper left: HImawari-9 Visible imagery (Band 3, 0.64 µm) and Infrared (Band 13, 10.4 µm) along with LightningCast Probability contours (left, center). Other panels show various Radar fields, including Base Reflectivity (upper right) (Click to enlarge). Note the NLDN Lightning Strikes from 0450 – 0500 UTC.
What do the two scenes from Hawaii and Guam have in common? On both days, the trade winds were not strong. That can be inferred by the ring of clouds — a sea breeze front — that encircles the big island. In addition, SMAP data (from this site) show weak winds on 11-12 May. (ASCAT winds at this time were on either side of Hawai’i, but not really over it!)
Derived SMAP winds on 11 – 12 May 2023 (click to enlarge)
Similarly, AMSR-2 wind speeds near/west of Guam show weak winds. There are differences in lightning morphology in tropical airmasses (vs. continental airmasses) as noted in this paper; however, that paper does not consider the effect of horizontal wind speed, if any.
GCOM-W1 ASMR-2 Wind Speeds, 0400 UTC 11 May – 0500 UTC 12 May 2023 (Click to enlarge)
LightningCast probability fields are available at this website. A menu at that site allows the user to view probabilities in a variety of sectors, including PACUS (that includes Hawaii), Guam and American Samoa.
JMA Himawari-9 Infrared Window (10.4 µm) images of Cyclone Mocha in the Bay of Bengal on 13 May 2023 (above) displayed cold clouds surrounding an eye that gradually became more cloud-cleared — with isolated cloud-top infrared brightness temperature values of -90ºC and colder (yellow pixels embedded within dark purple regions).... Read More
JMA Himawari-9 Infrared Window (10.4 µm) images [click to play animated GIF | MP4]
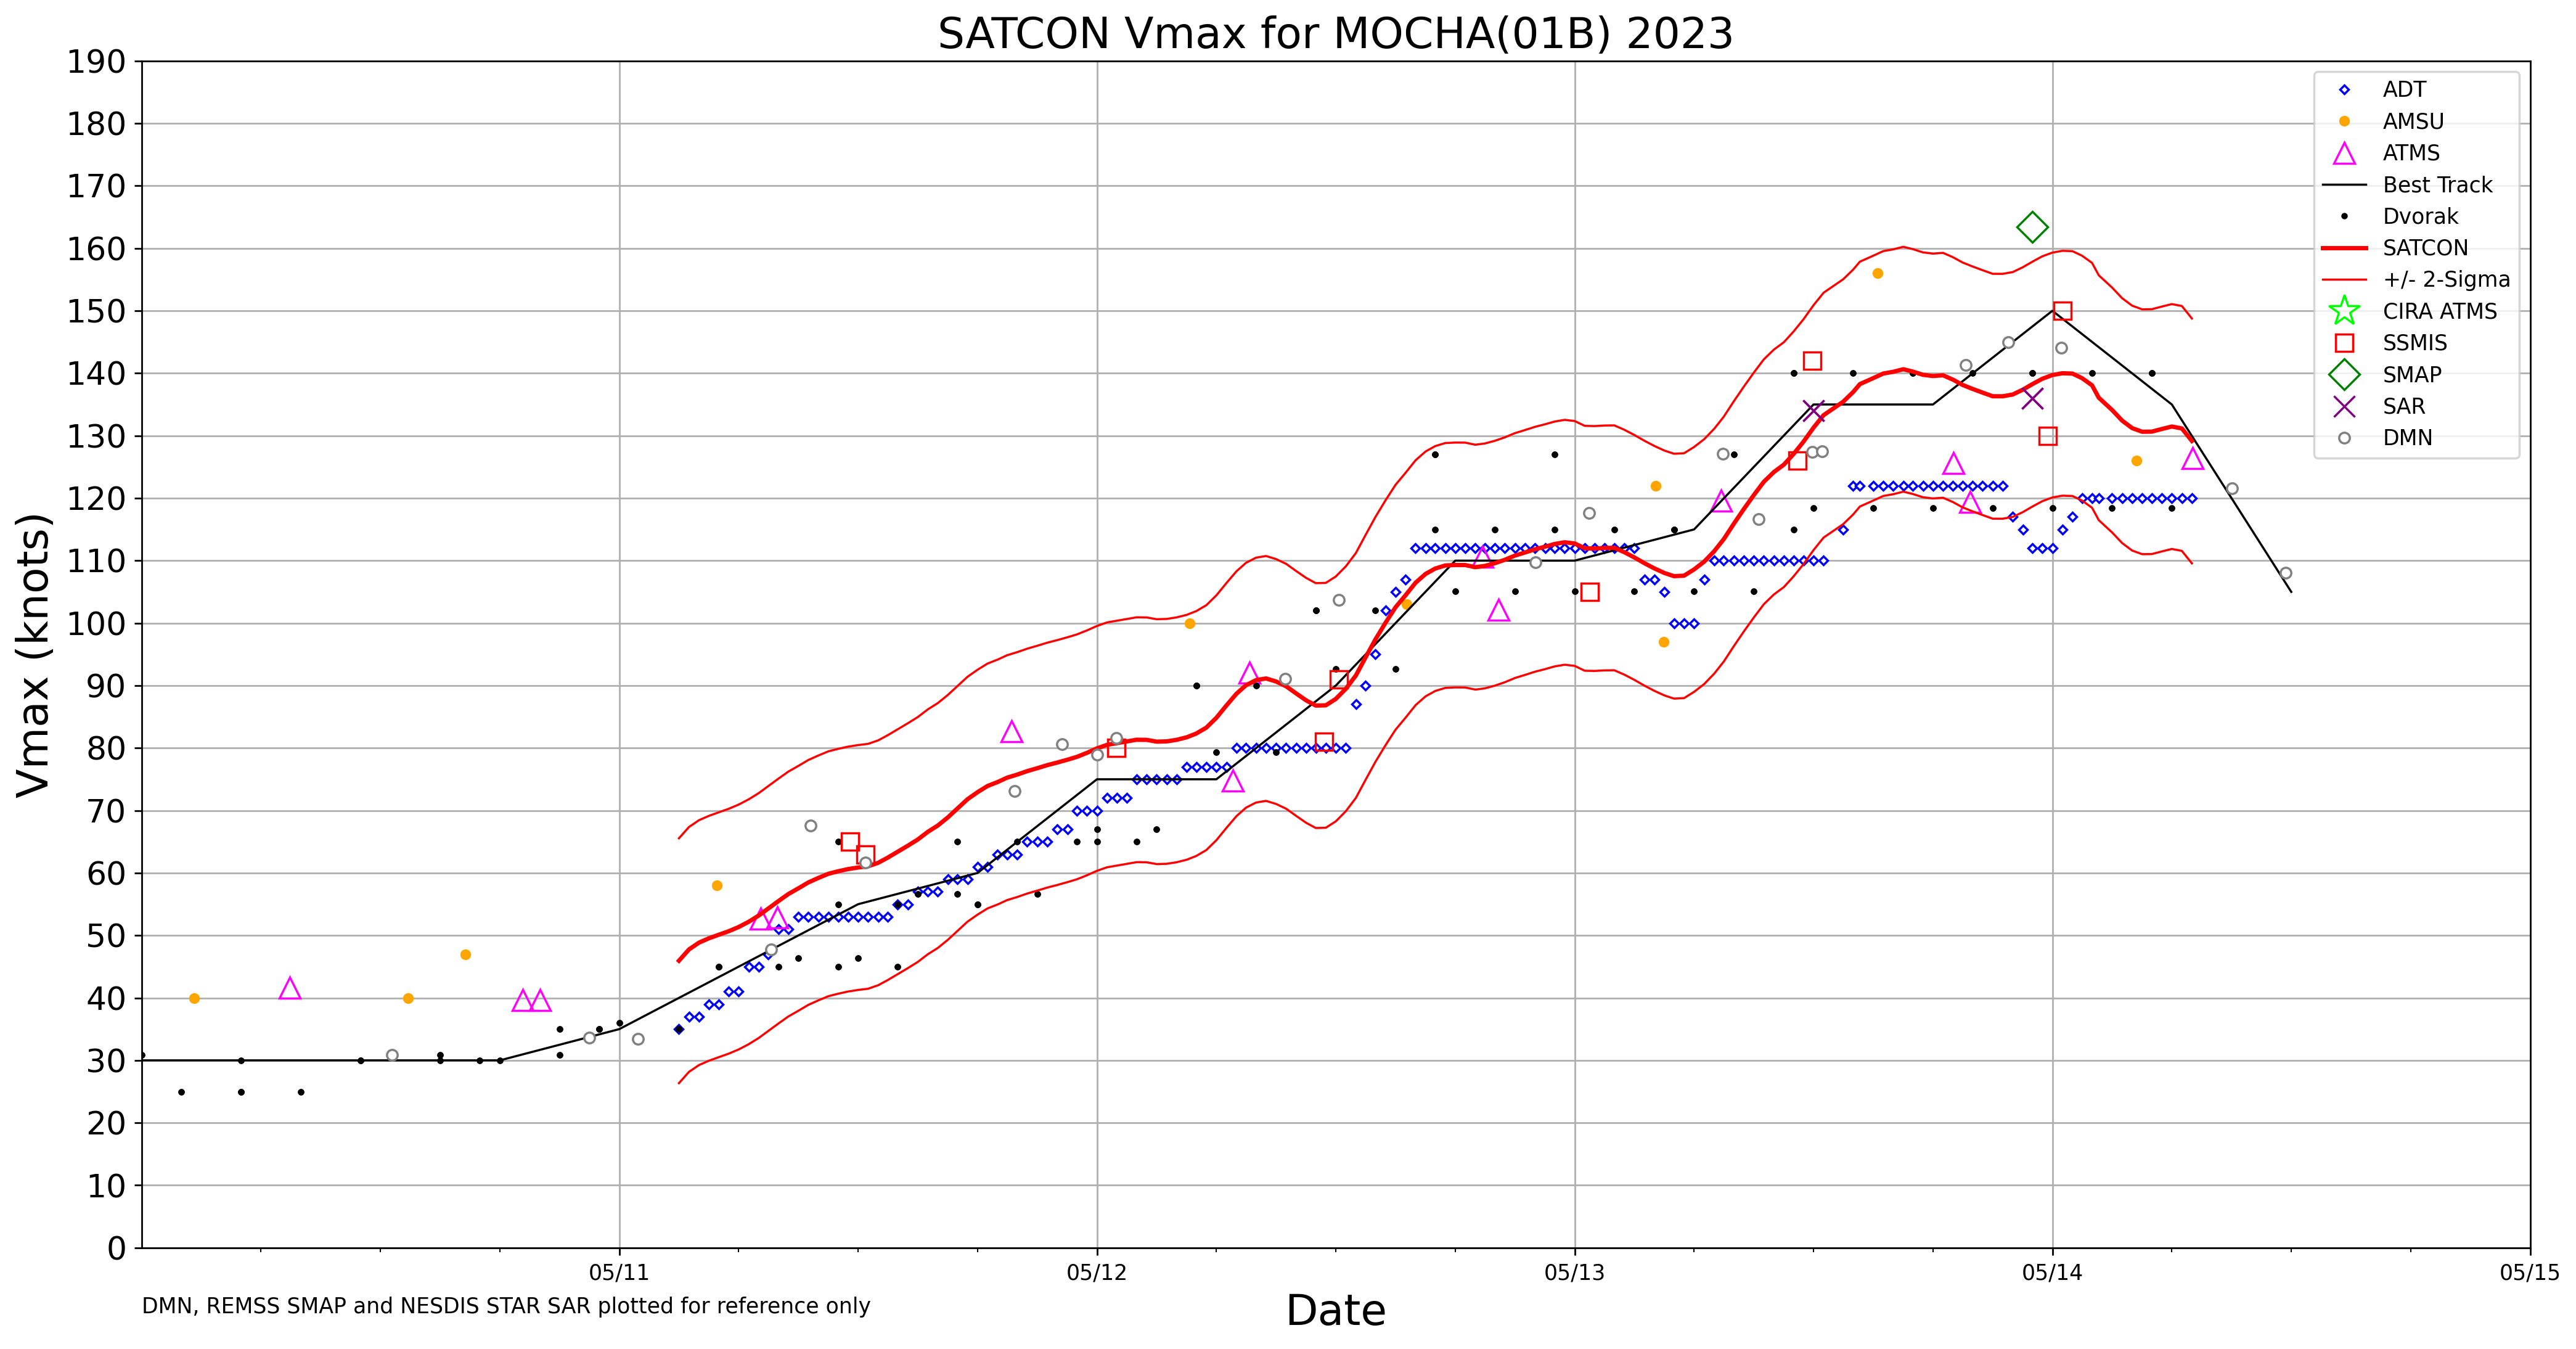
JMA Himawari-9 Infrared Window (10.4 µm) images of Cyclone Mocha in the Bay of Bengal on 13 May 2023 (above) displayed cold clouds surrounding an eye that gradually became more cloud-cleared — with isolated cloud-top infrared brightness temperature values of -90ºC and colder (yellow pixels embedded within dark purple regions). Mocha reached Category 4 intensity at 0000 UTC on 13 May, and Category 5 intensity (sustained winds of 140 knots)at 0000 UTC on 14 May (SATCON | JTWC advisory).
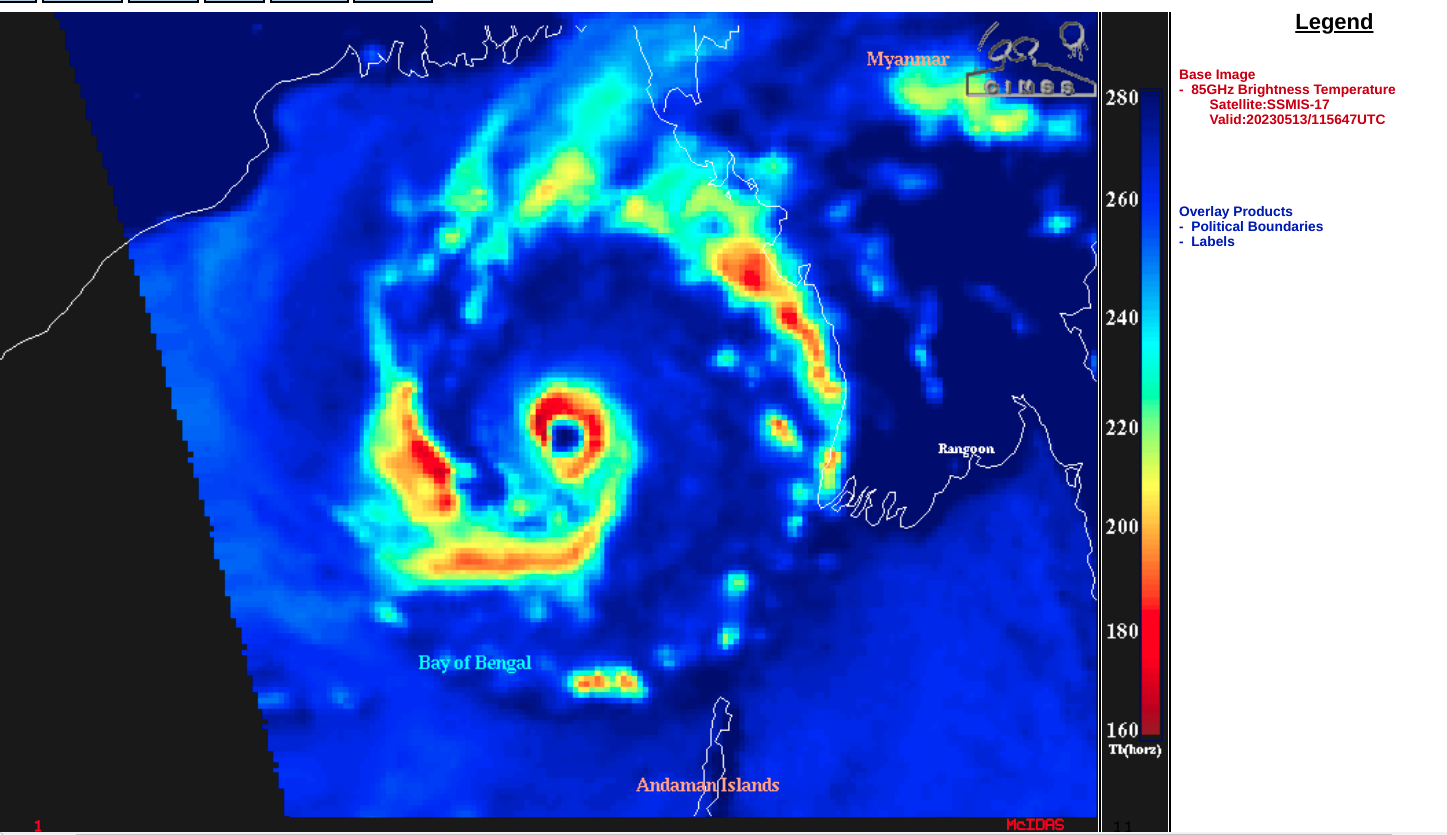
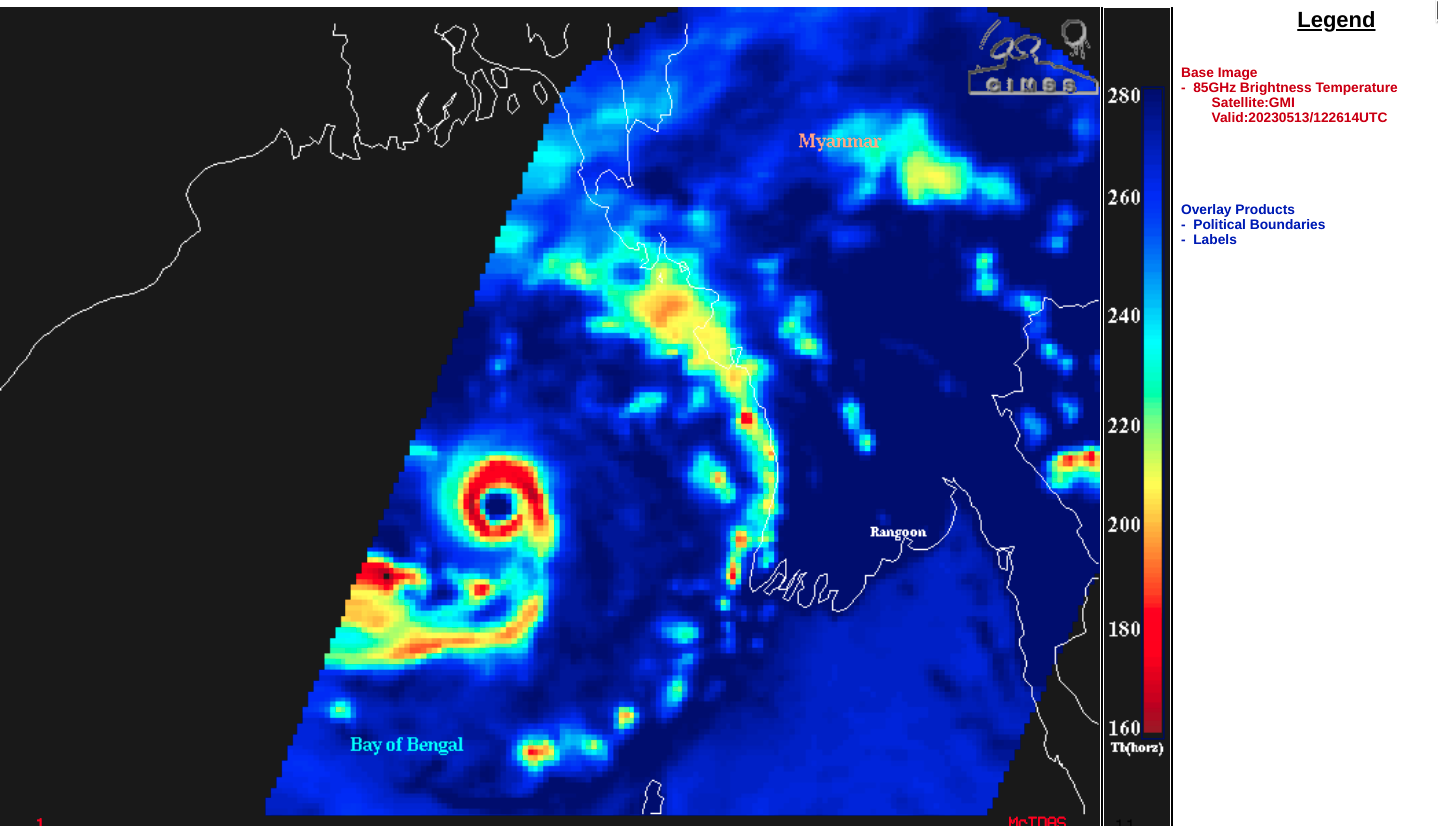
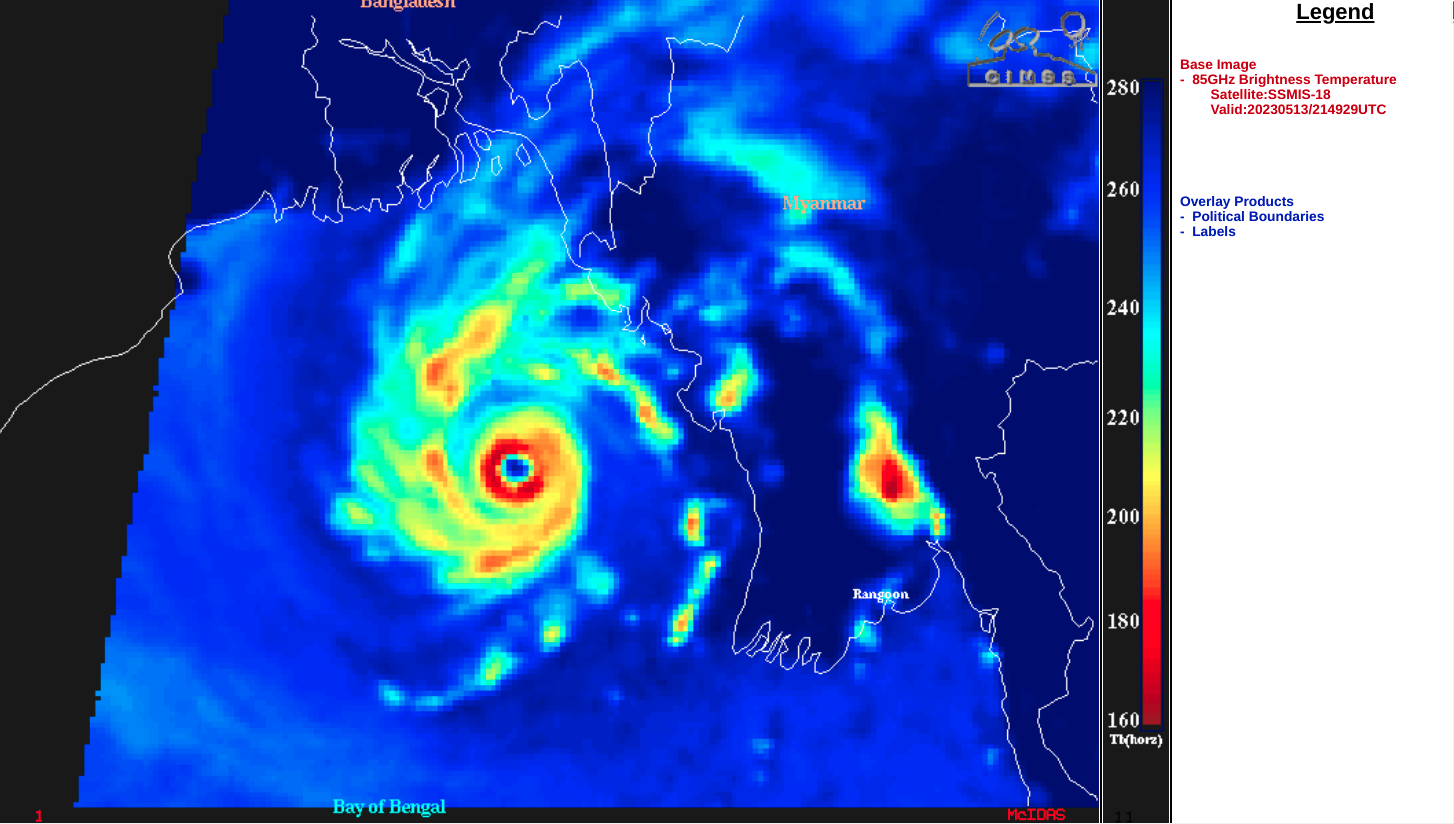
A sequence of DMSP and GMI Microwave (85 GHz) images from the CIMSS Tropical Cyclones site (below) showed snapshots of an eyewall that became more well defined during the day.
DMSP-17 SSMIS Microwave (85 GHz) image at 1156 UTC [click to enlarge]
GMI Microwave (85 GHz) image at 1226 UTC [click to enlarge]
DMSP-18 SSMIS Microwave (85 GHz) image at 2149 UTC [click to enlarge]
The MIMIC-TC product (below) shows the 48-hour period of Mocha’s approach toward and landfall in Myanmar.
MIMIC-TC product, 12-14 May [click to play animated GIF]
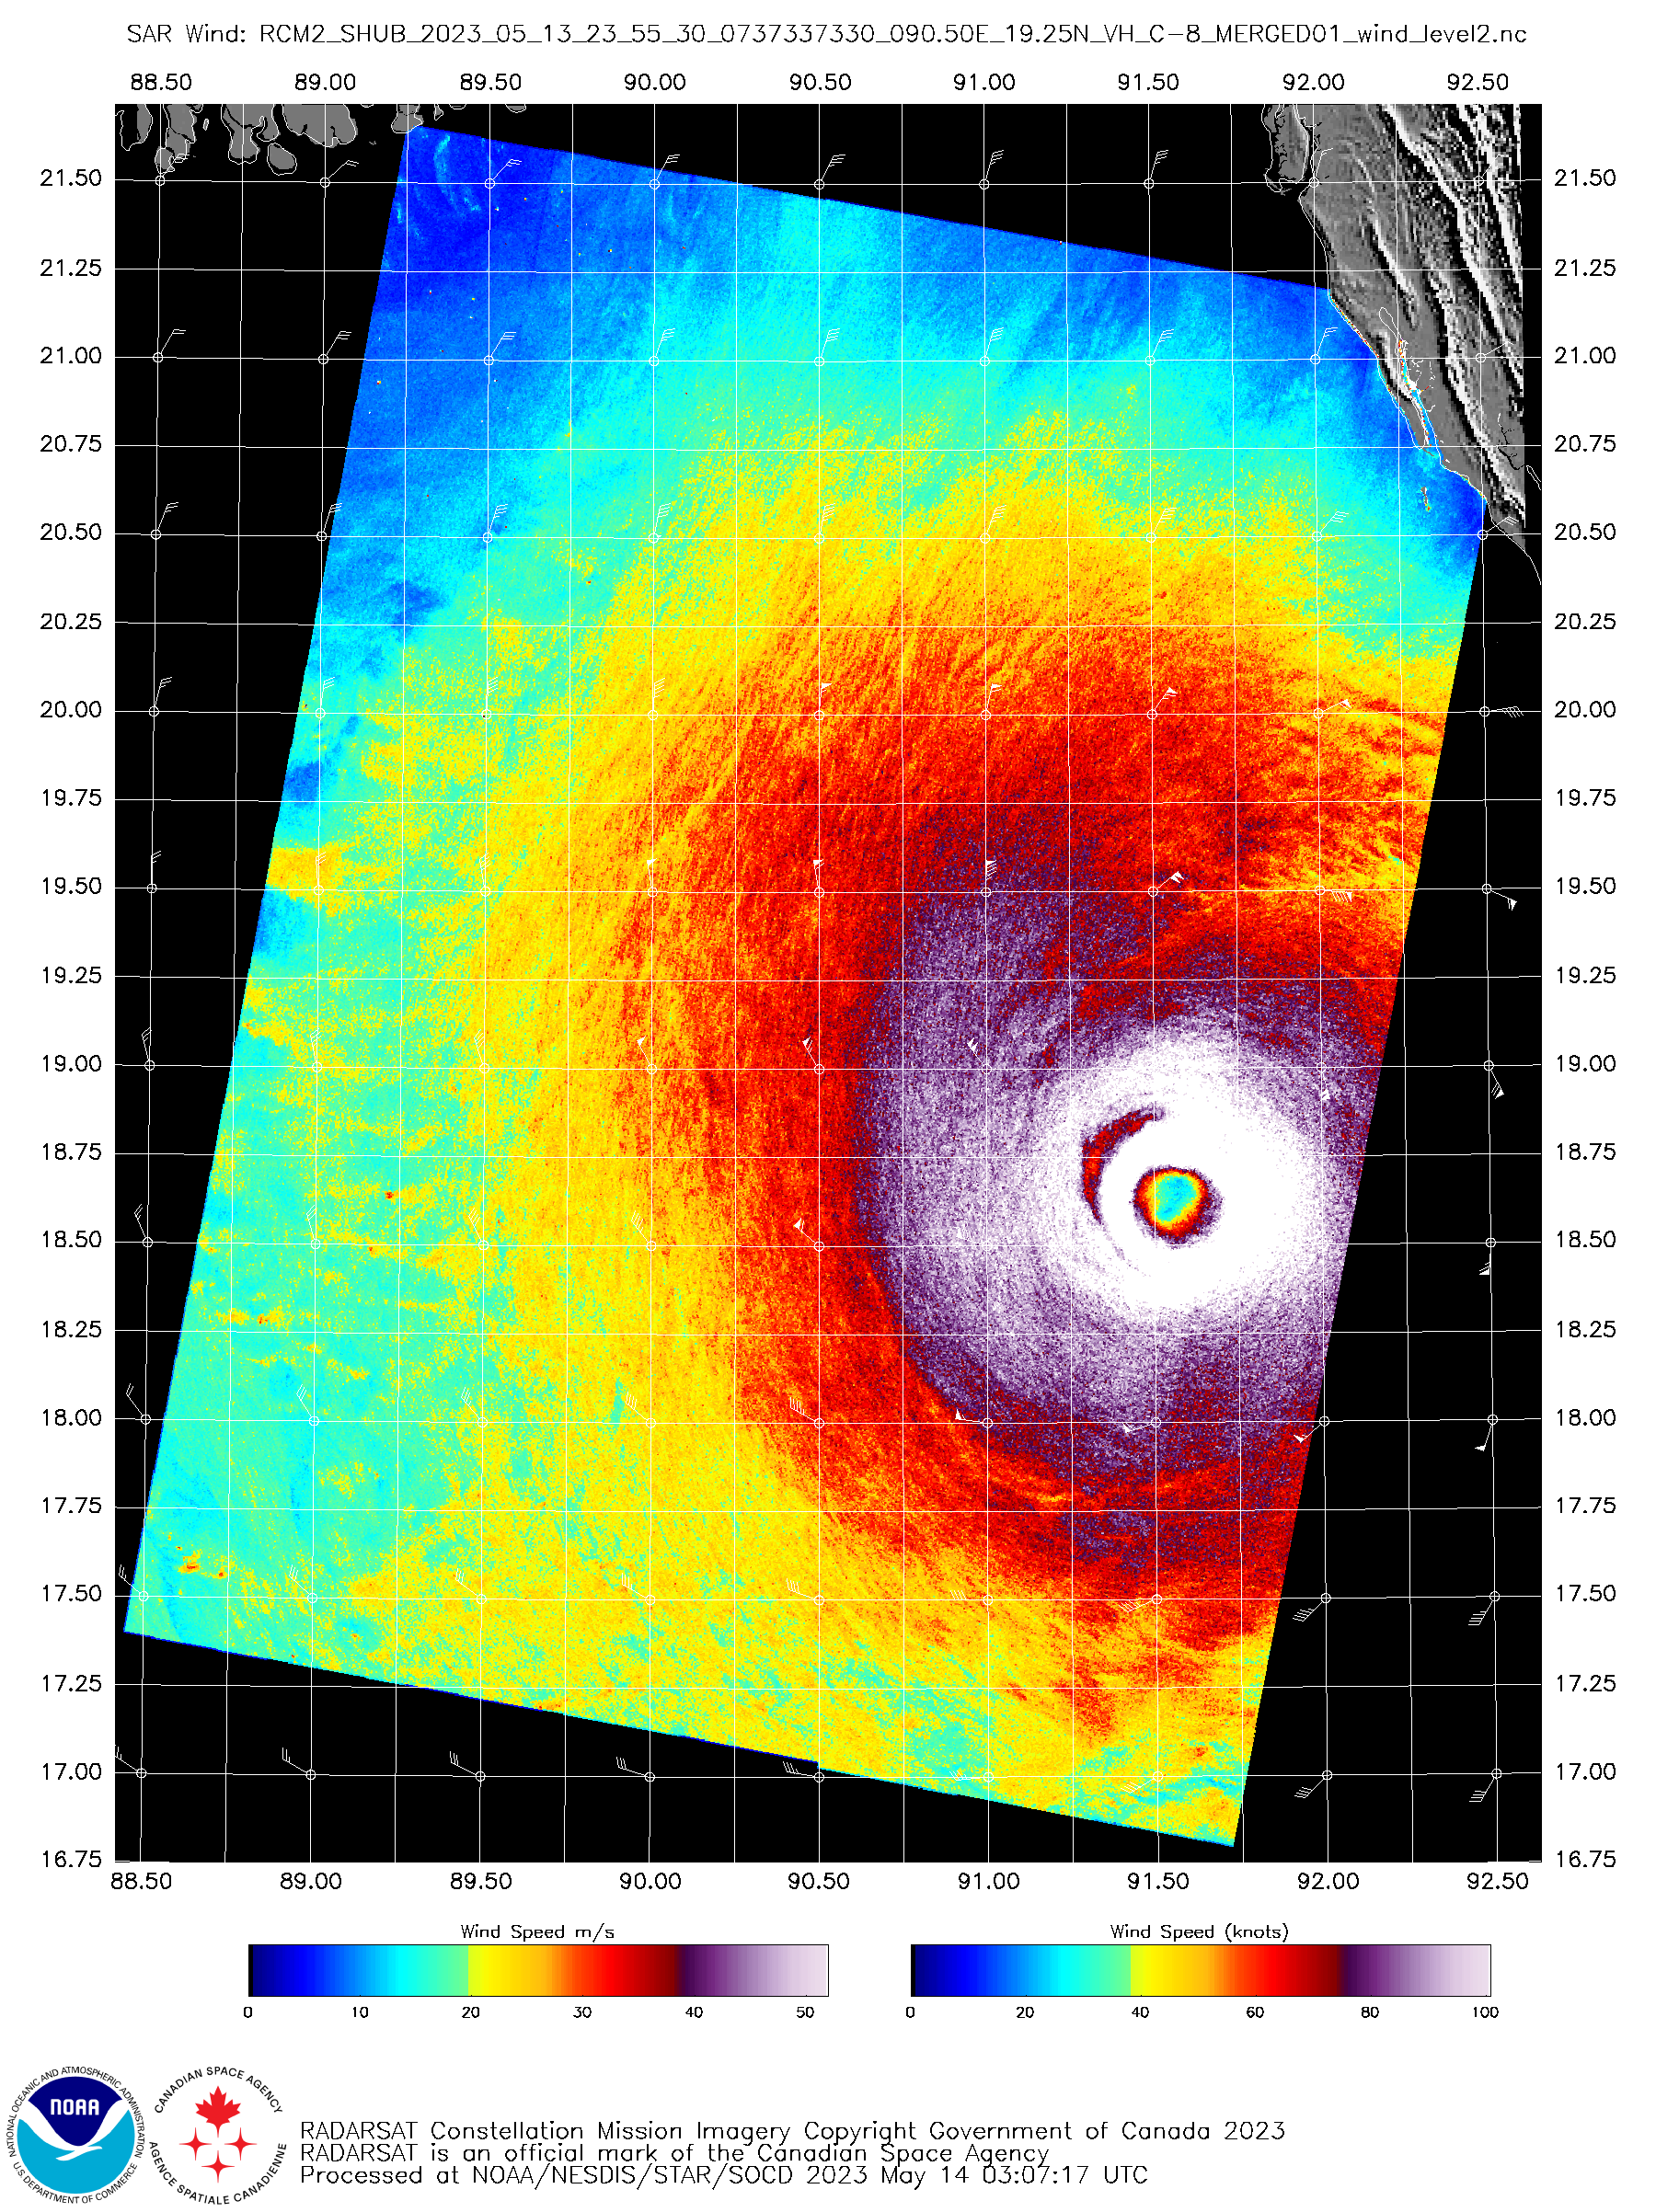
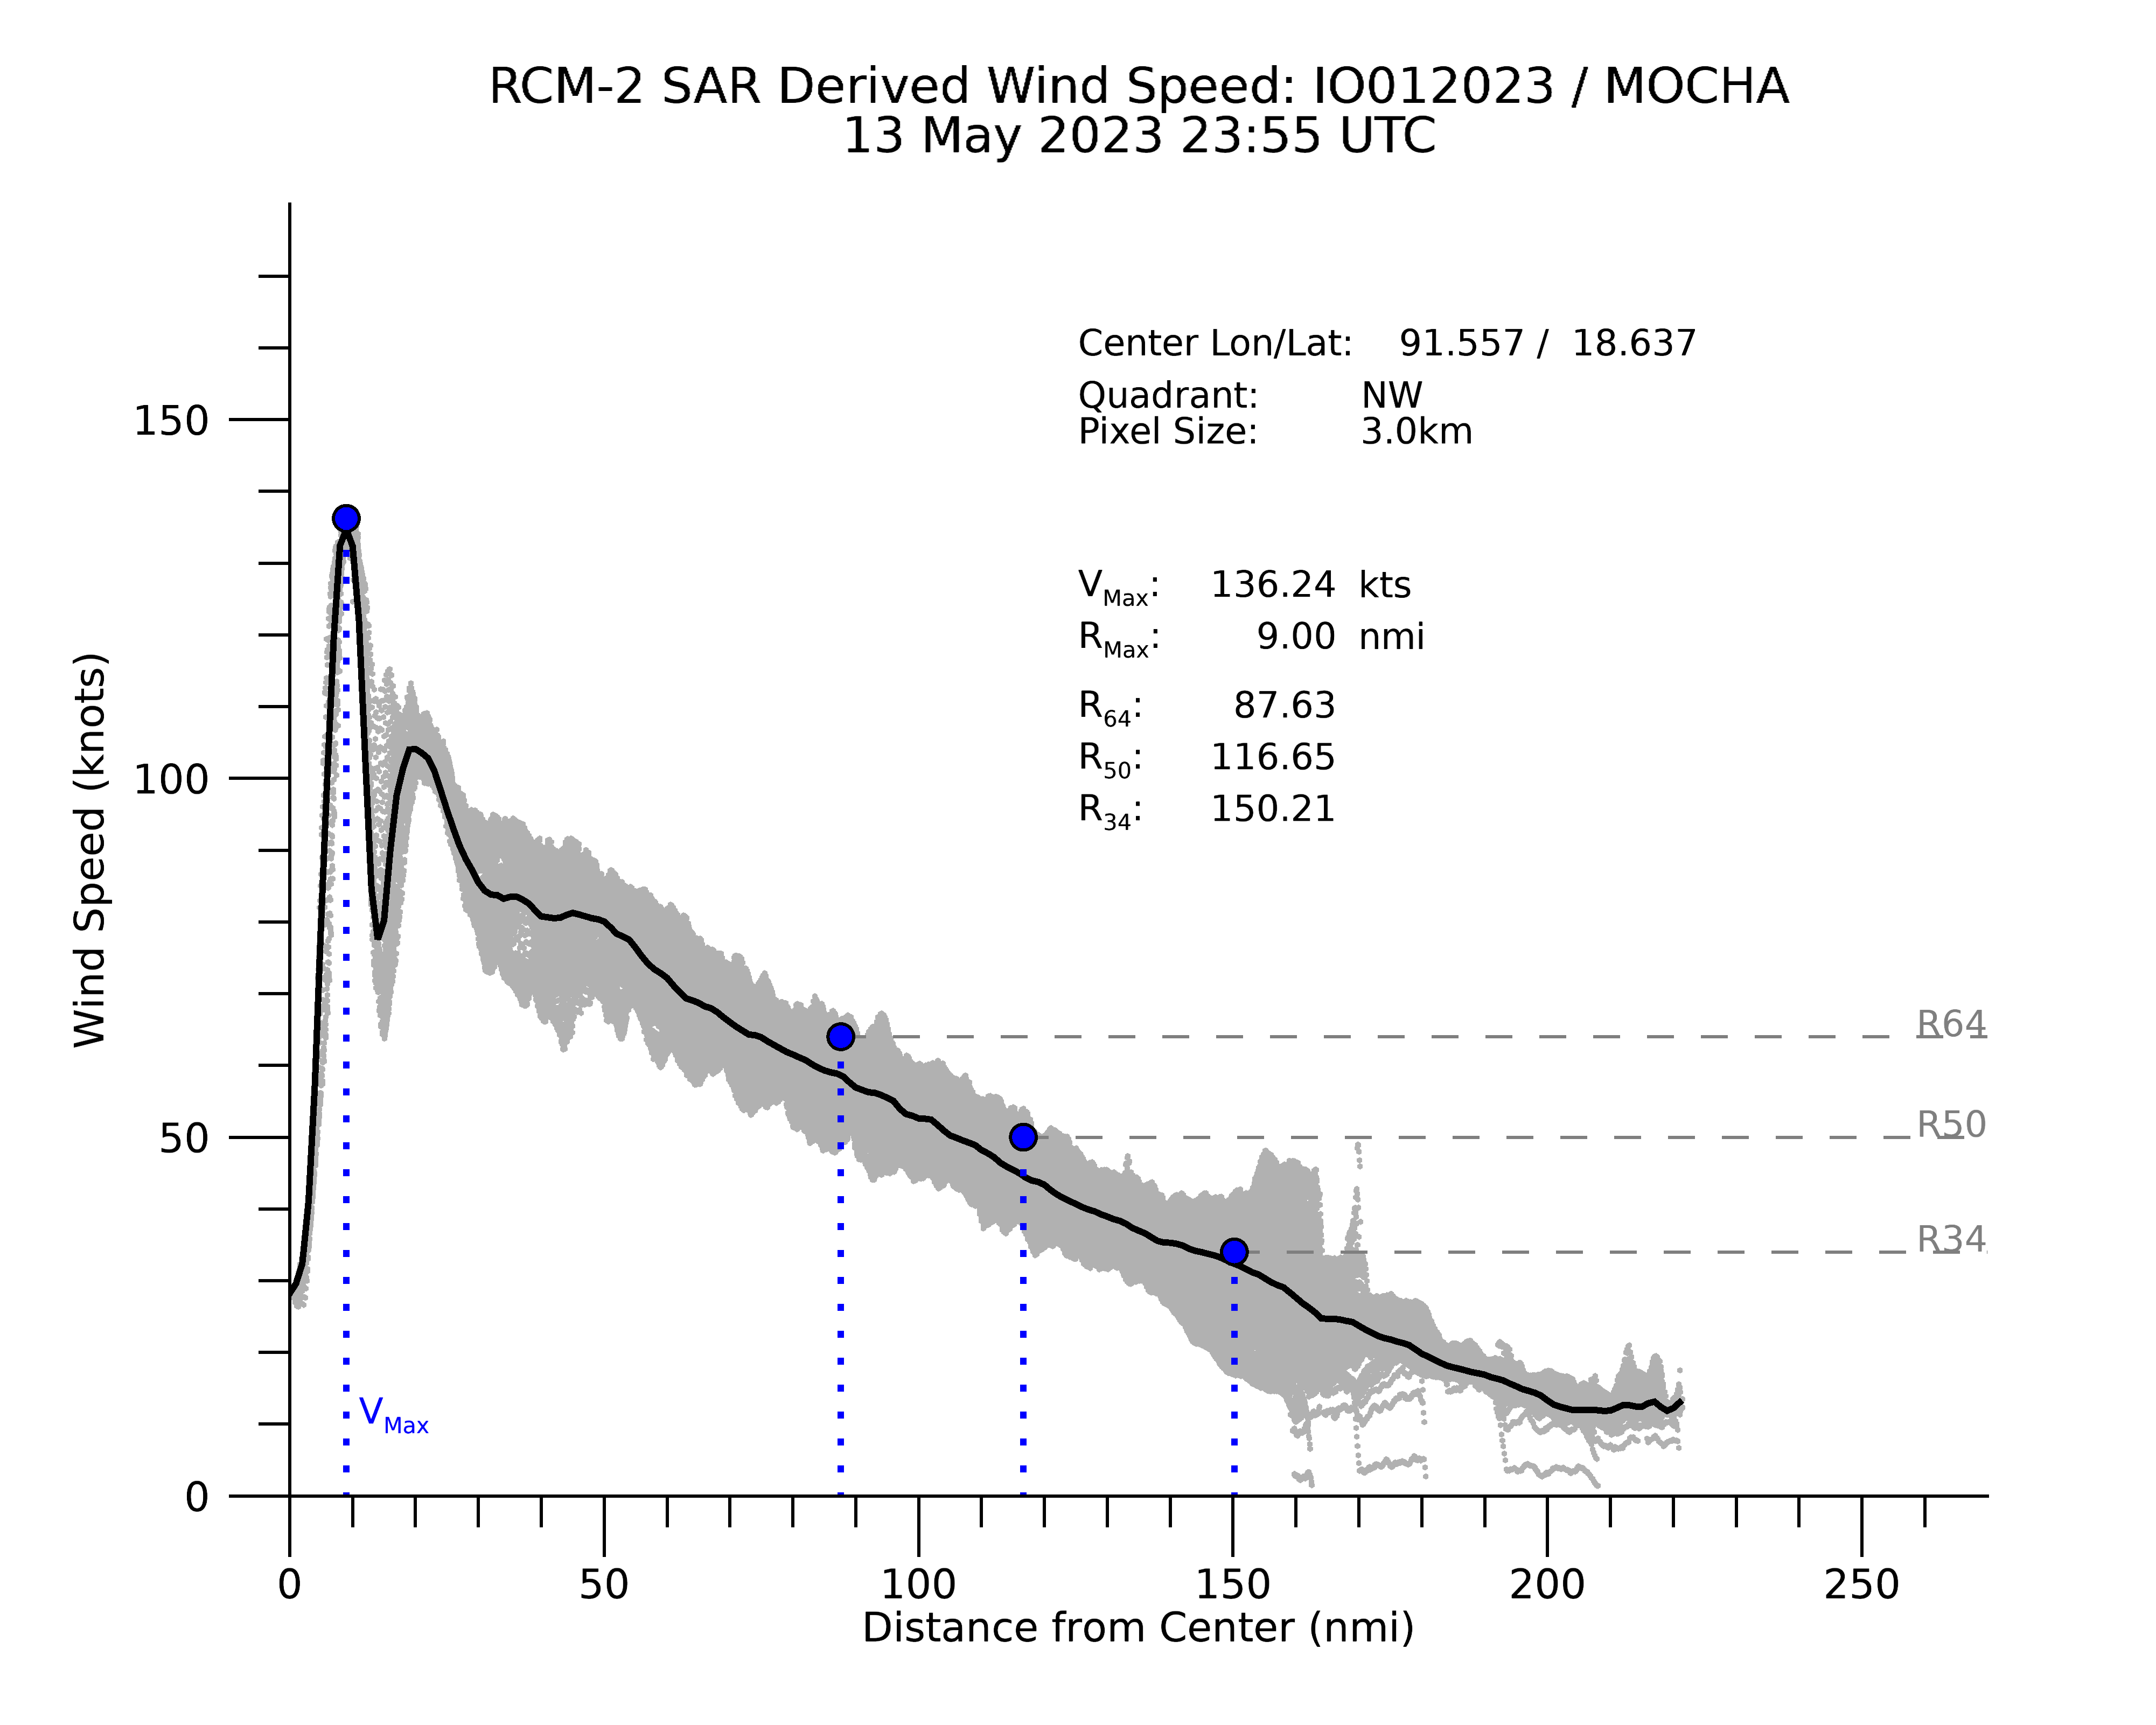
Near the time that Mocha was classified at a Category 5 tropical cyclone, a Synthetic Aperture Radar (SAR) image from the RADARSAT Constellation Mission 2 (RCM-2) satellite at 2355 UTC (source) is shown below — the peak SAR wind of 136.24 knots was found in the NW quadrant of Mocha.
RCM-2 SAR winds at 2355 UTC on 13 May [click to enlarge]
Several hours after reaching its peak intensity as a Category 5 storm, JMA Hmawari-9 Visible and Infrared images (below) showed Mocha making landfall along the coast of Myanmar just after 0800 UTC on 14 May, at Category 4 intensity.
JMA Hmawari-9 “Red” Visible (0.64 µm, left) and “Clean” Infrared Window (10.4 µm, right) images [click to play animated GIF | MP4]
