
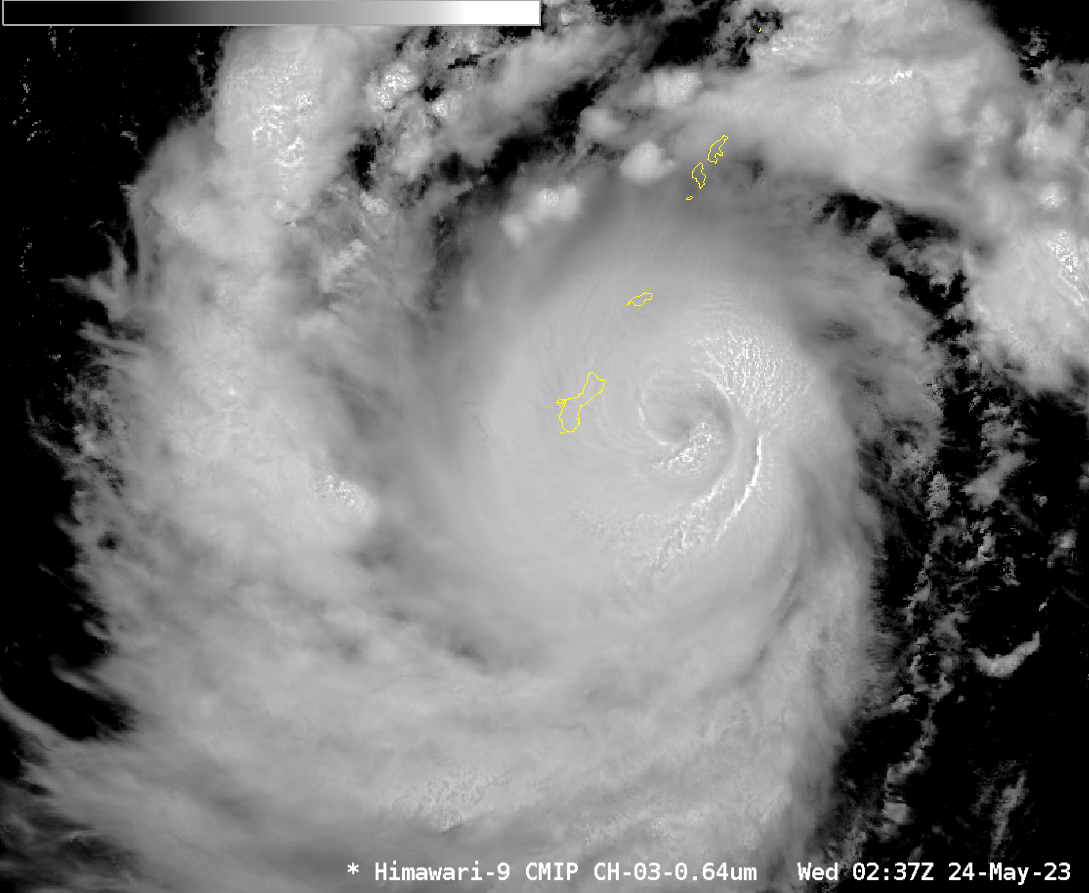
Target Sector (2.5-minute interval) JMA Himawari-9 Visible and Infrared images (above) covered the period +/- 2 hours when Super Typhoon Mawar reached Category 5 intensity at 0600 UTC on 25 May 2023. Mesovortices within the eye were evident in Visible imagery, with the eye exhibiting a “stadium effect” geometry (two signatures that are often associated with... Read More
JMA Himawari-9 “Red” Visible (0.64 µm, top) and “Clean” Infrared Window (10.4 µm, bottom) images [click to play animated GIF | MP4]
(2.5-minute interval)
JMA Himawari-9 Visible and Infrared images
(above) covered the period +/- 2 hours when Super Typhoon Mawar reached
Category 5 intensity at 0600 UTC on 25 May 2023. Mesovortices within the eye were evident in Visible imagery, with the eye exhibiting a “stadium effect” geometry (two signatures that are often associated with intense tropical cyclones).
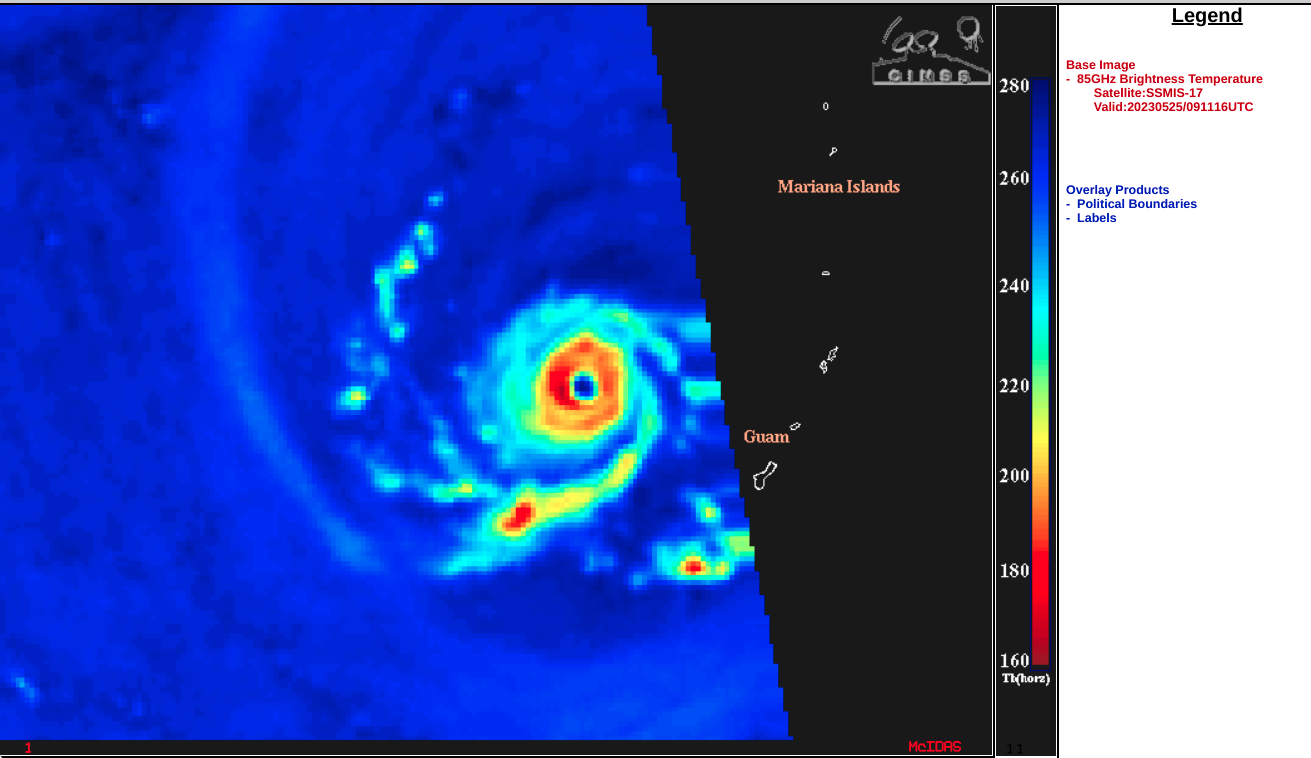
DMSP-17 SSMIS Microwave (85 GHz) image at 0911 UTC [click to enlarge]
A DMSP-17 SSMIS Microwave (85 GHz) image at 0911 UTC from the
CIMSS Tropical Cyclones site
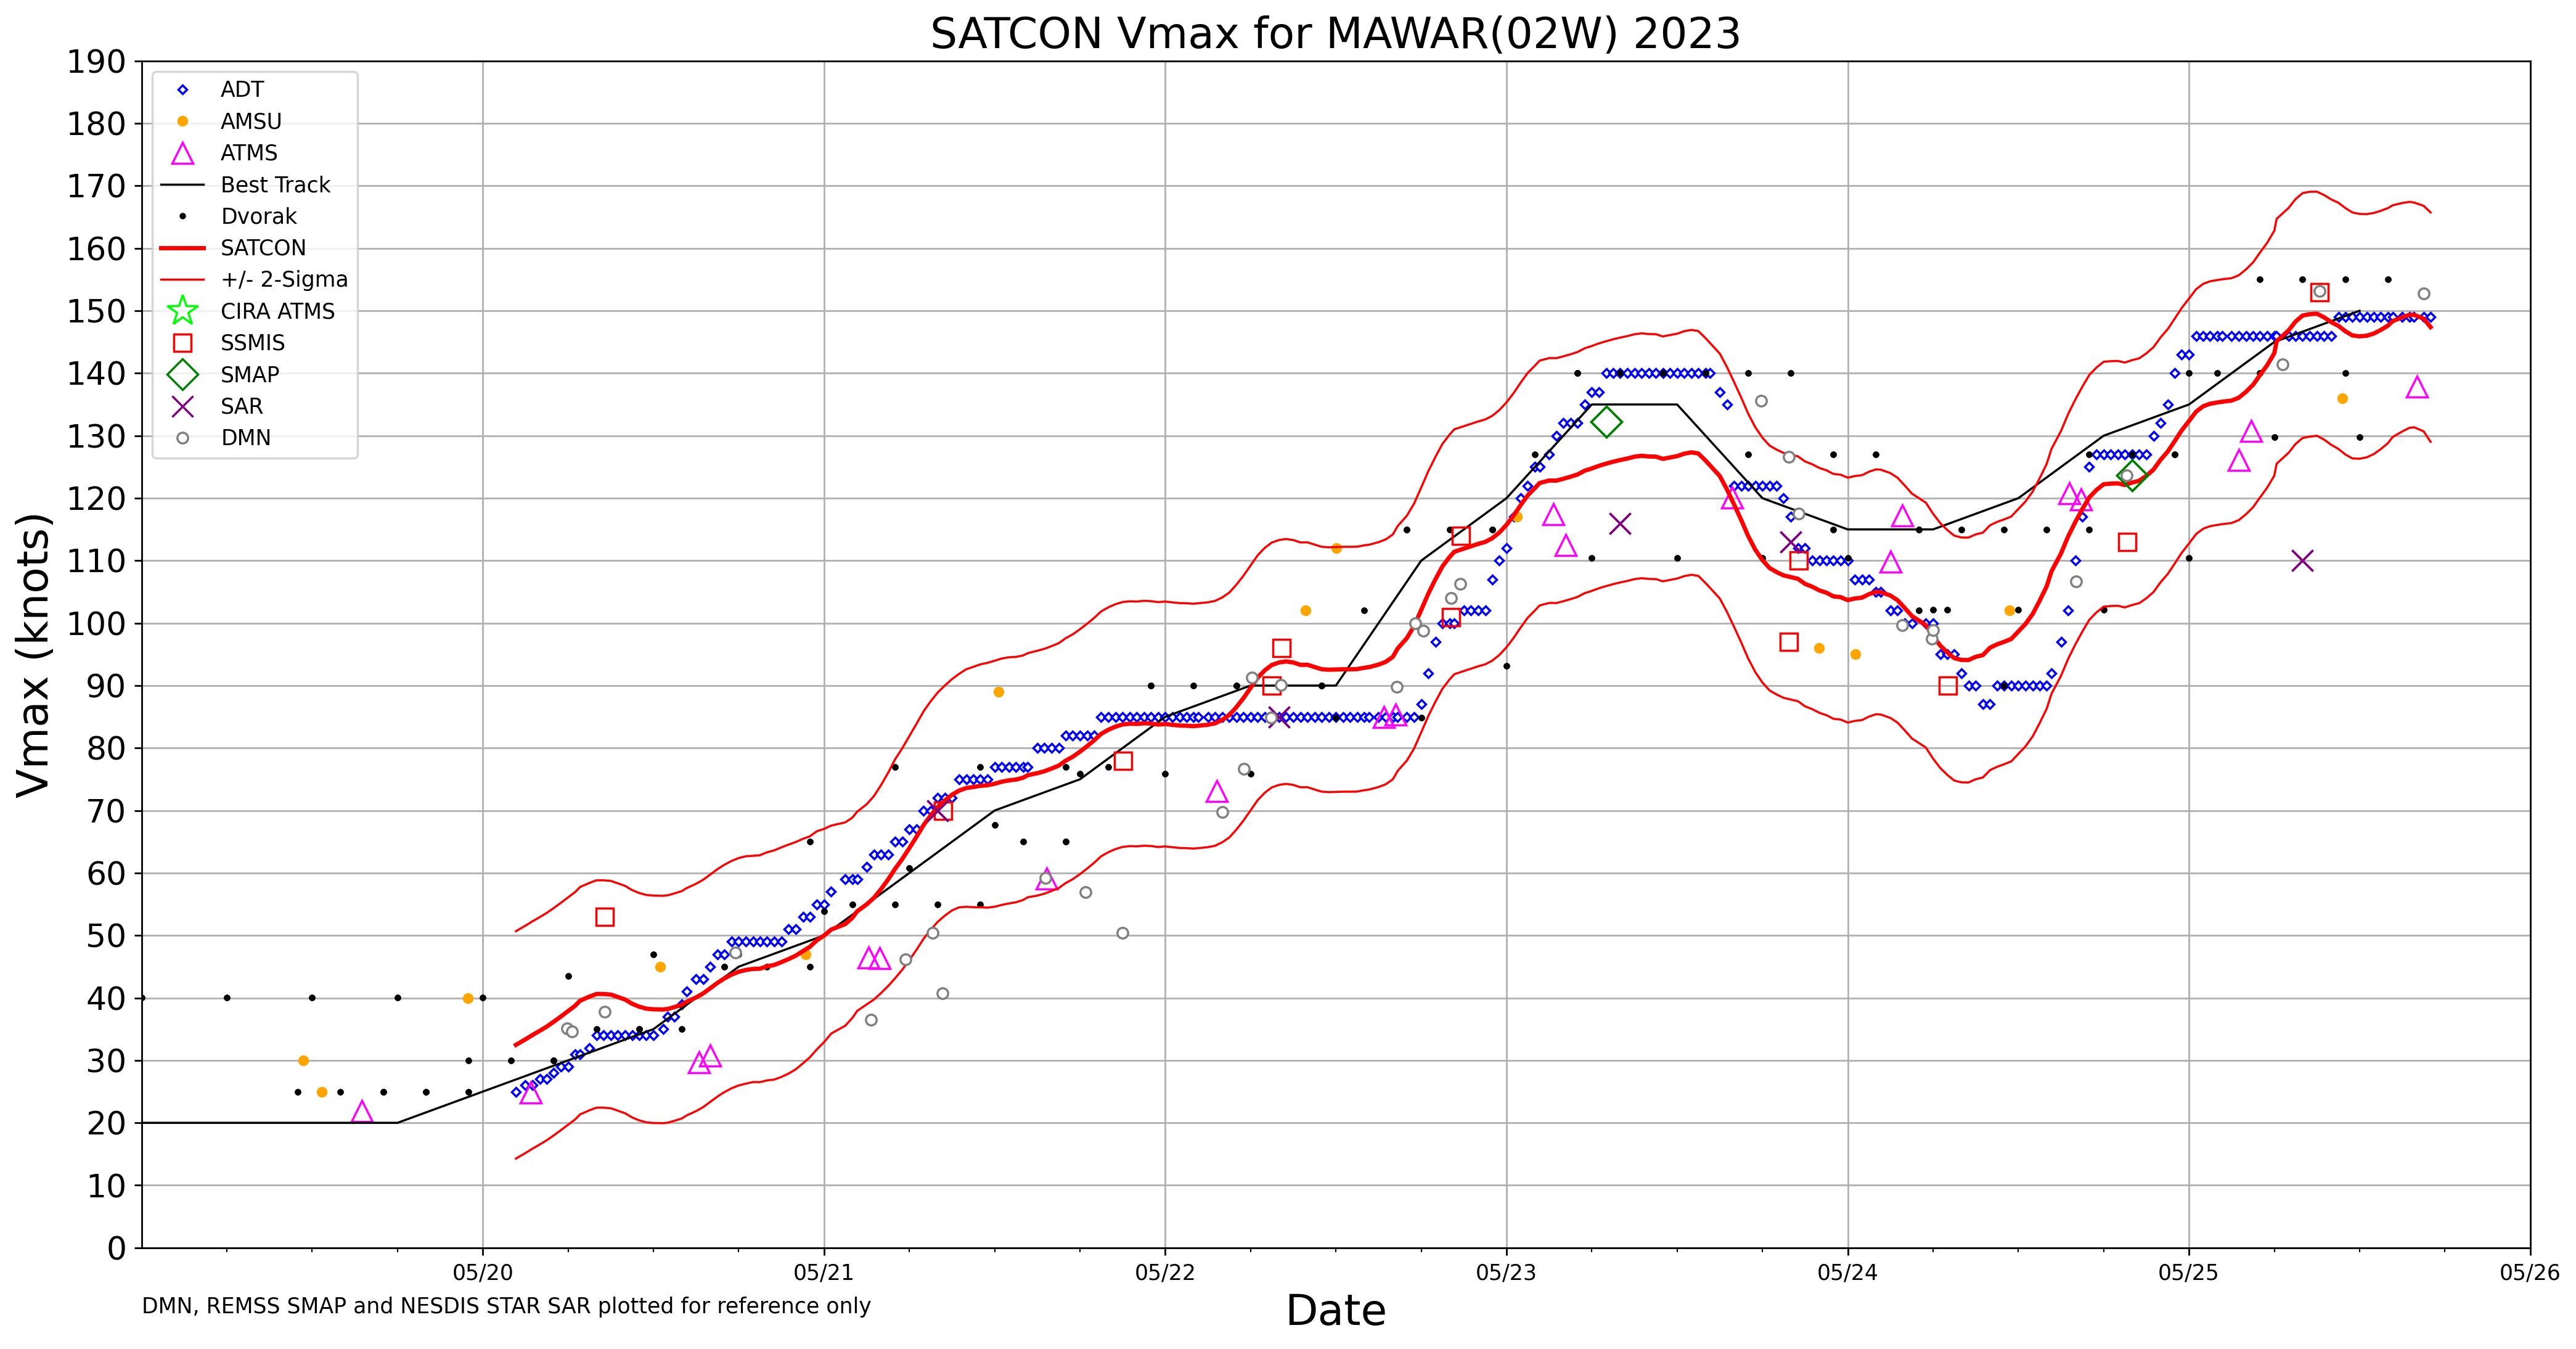
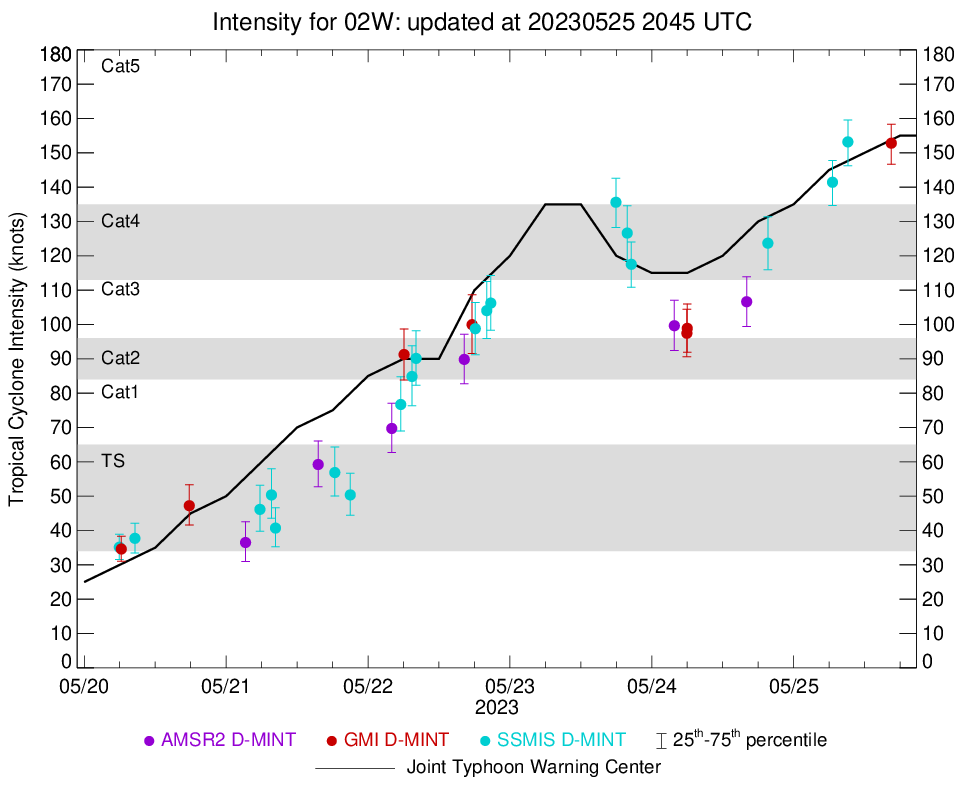
(above) showed Mawar to the west of Guam, with a well-defined, completely closed eyewall along with a spiral band wrapping into the storm center from the south. Later in the day, Mawar further intensified to 155 knots at 1800 UTC (
JTWC advisory |
ADT |
SATCON |
D-MINT |
D-PRINT) — and a DMSP-18 SSMIS Microwave image at 1905 UTC
(below) revealed a distinct pair of spiral bands.

DMSP-18 SSMIS Microwave (85 GHz) image at 1905 UTC [click to enlarge]
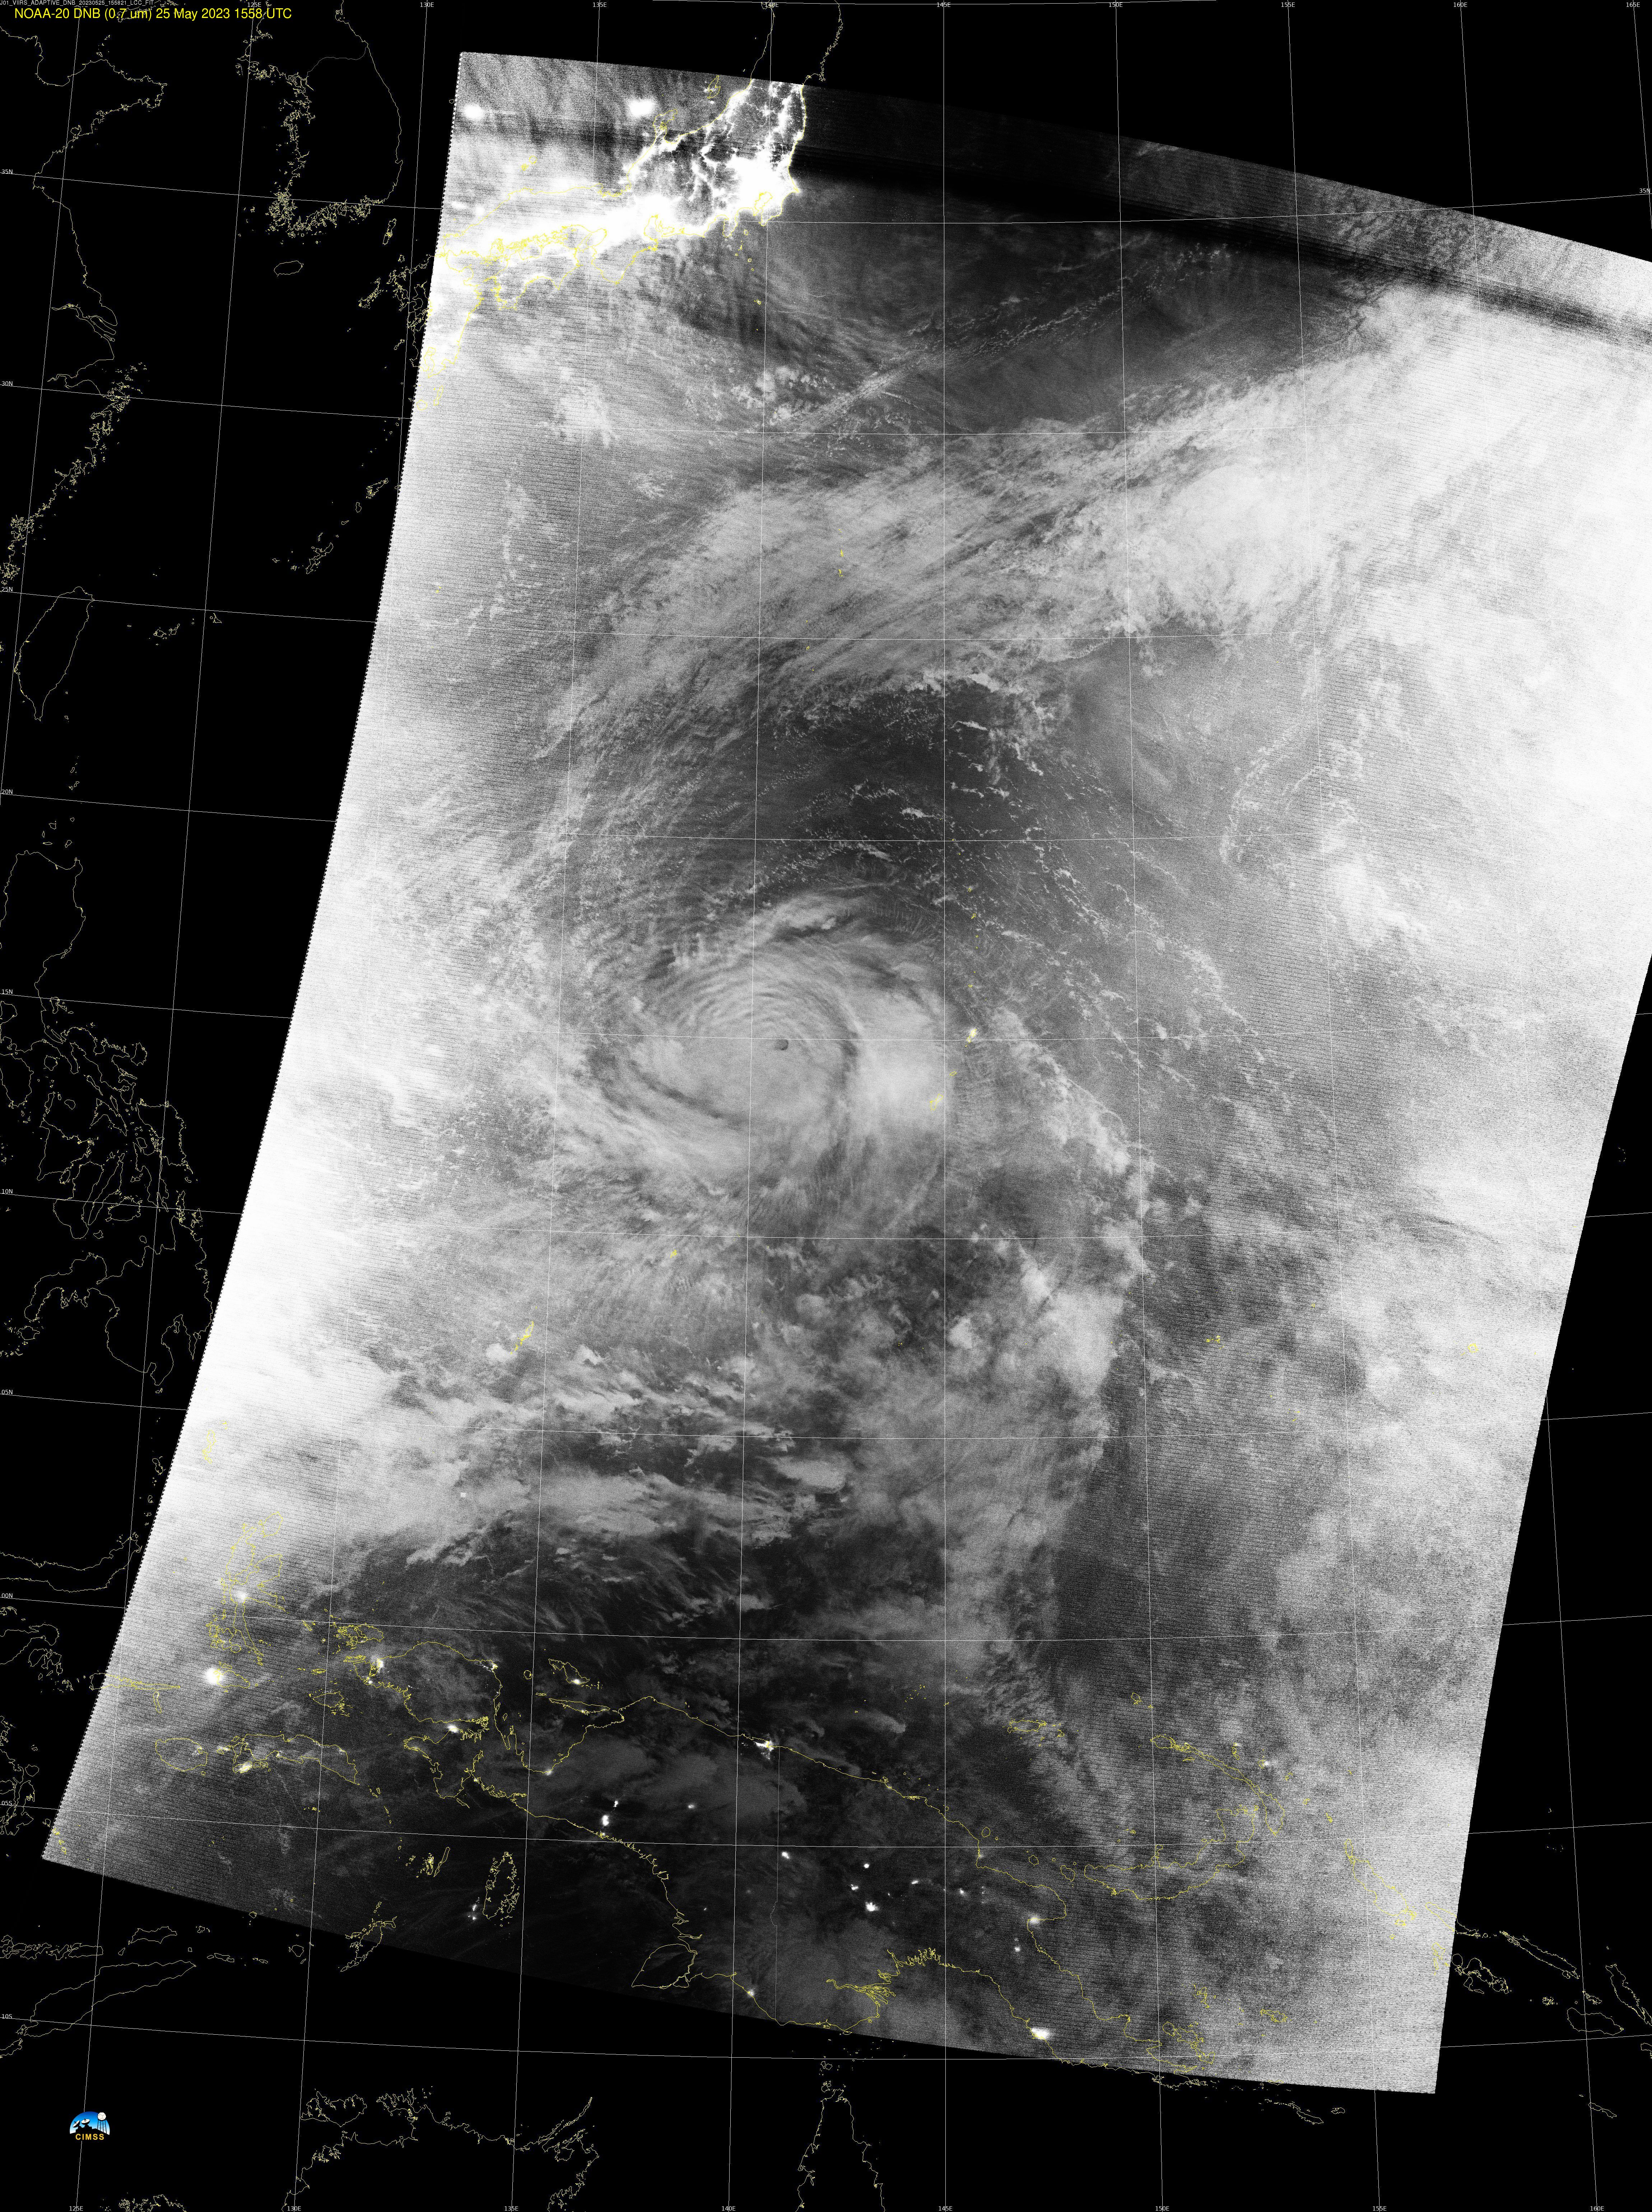
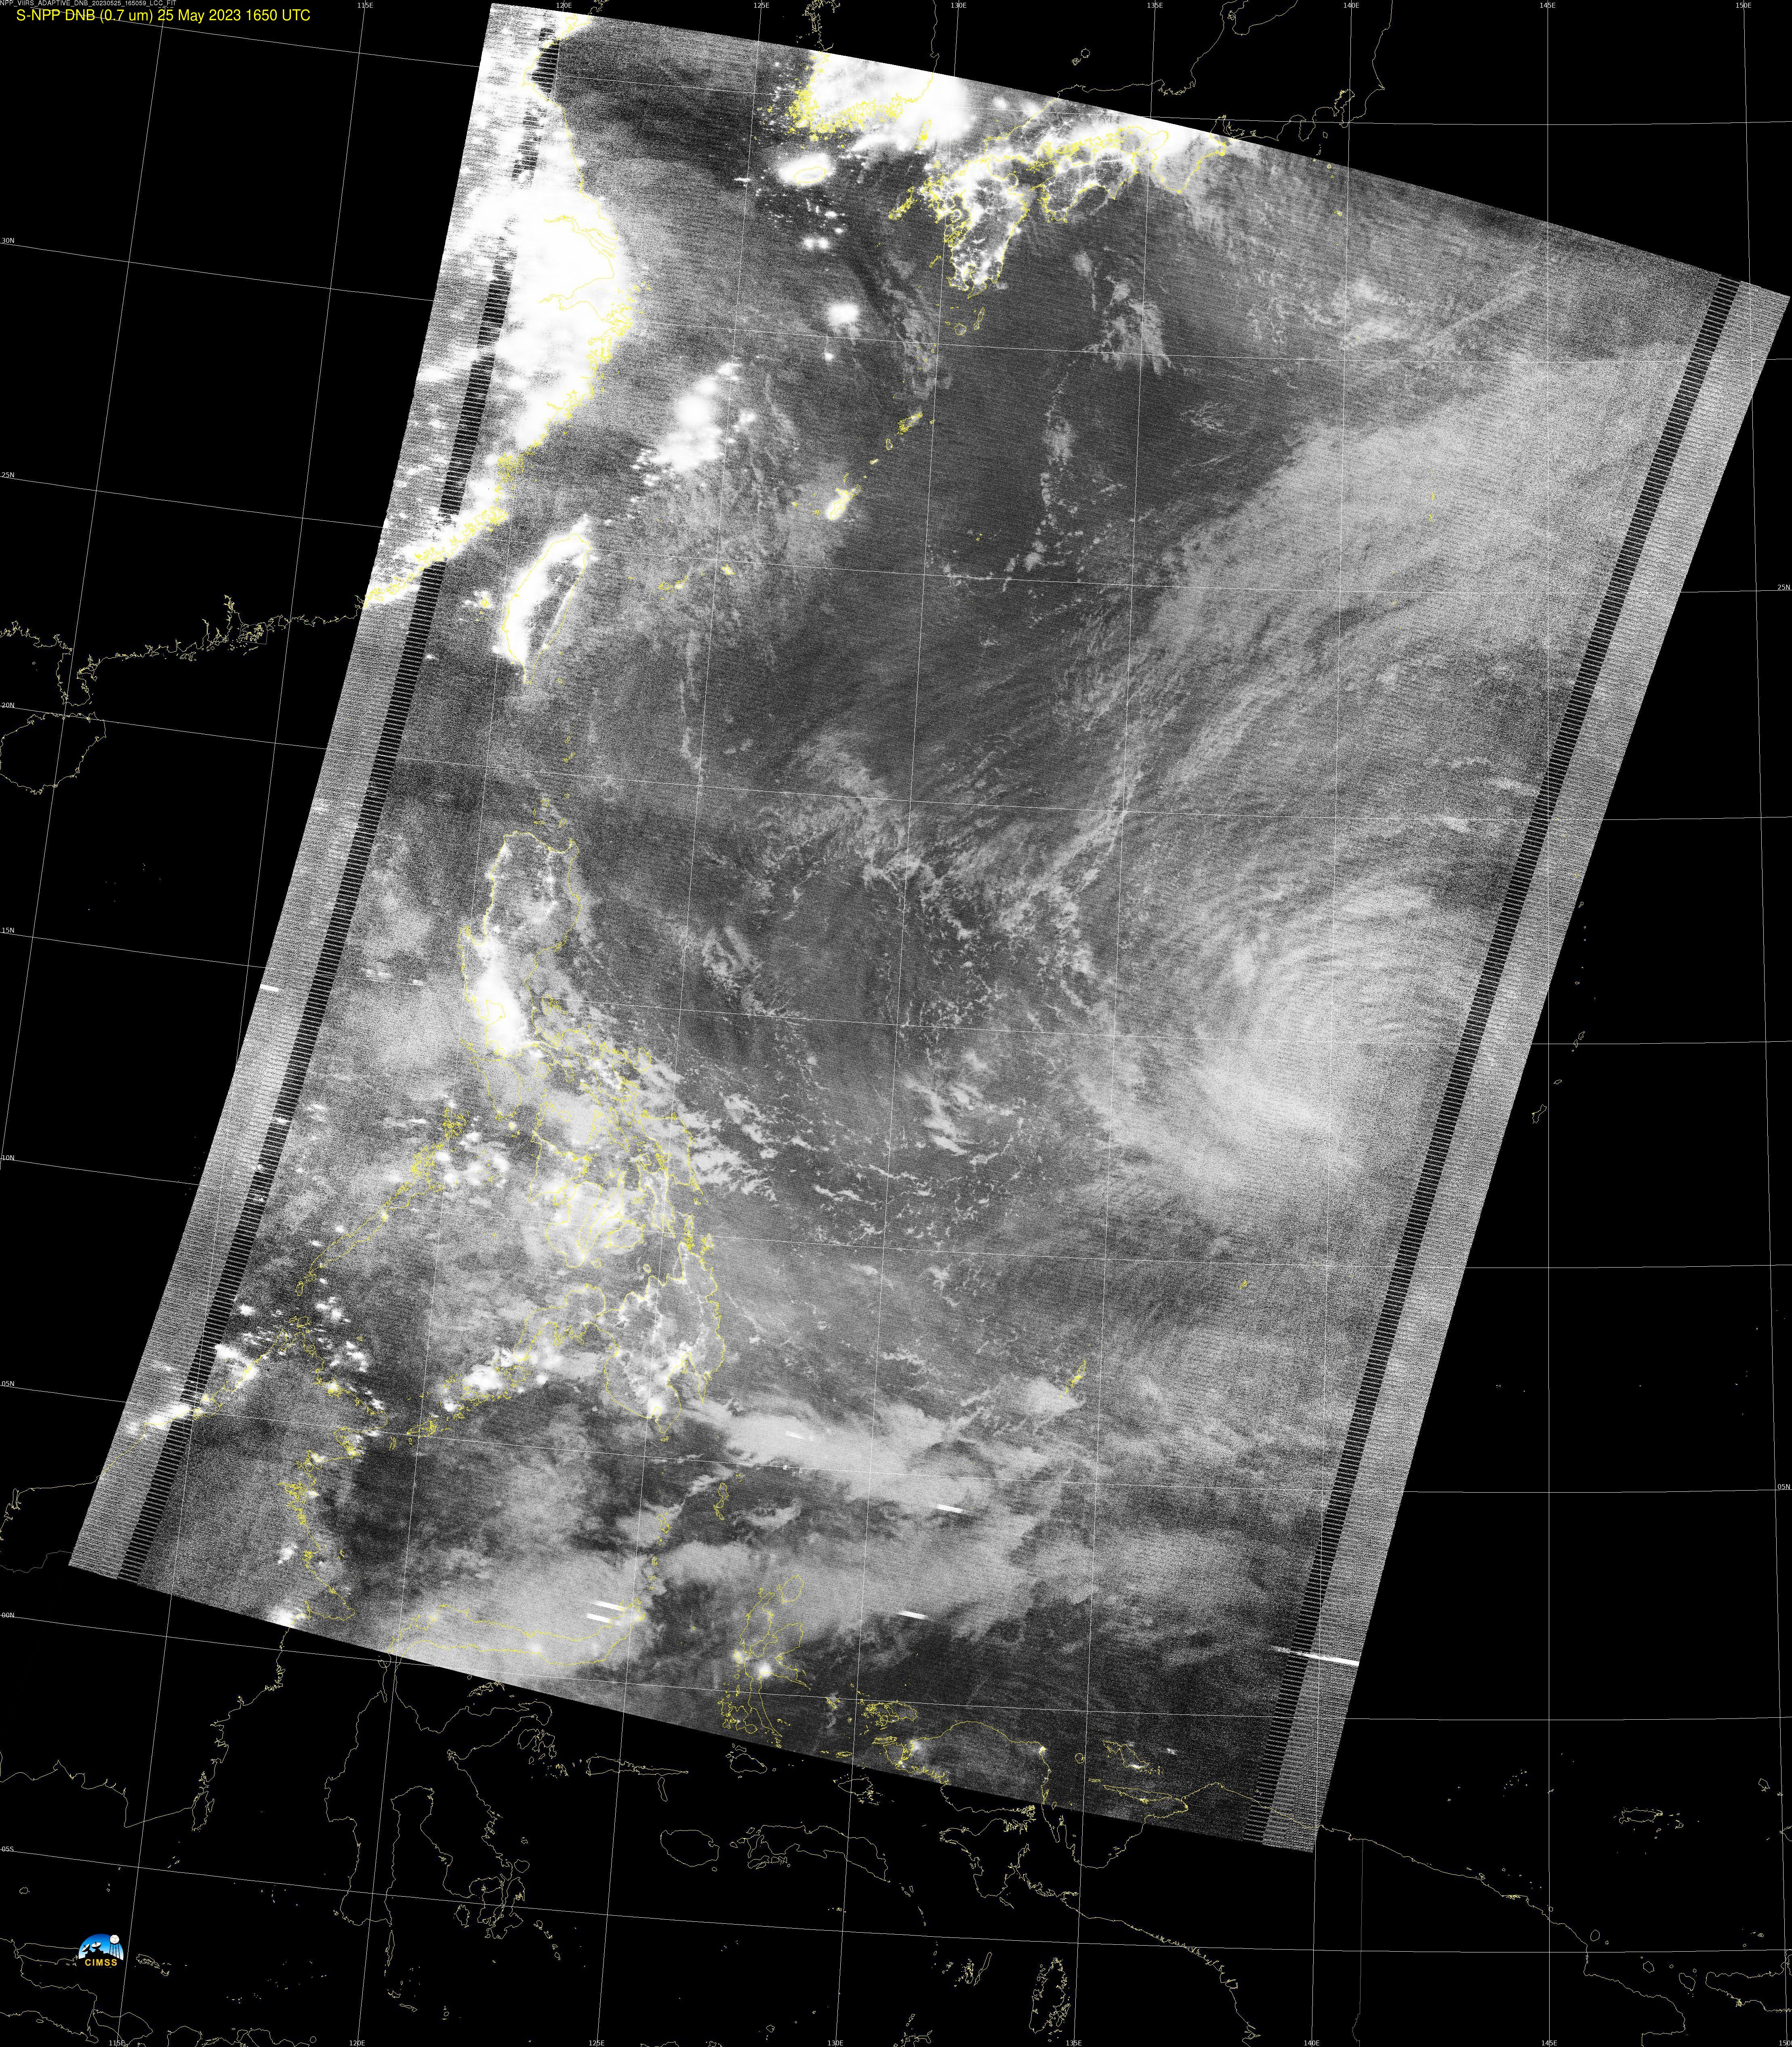
As also mentioned in
this blog post, a Suomi-NPP VIIRS Day/Night Band (0.7 µm) image
valid at 1655 UTC (below) revealed mesospheric airglow waves (
reference) radiating hundreds of miles northward through westward away from Mawar — these vertically-propagating gravity waves were generated by deep convection within Mawar’s eyewall.
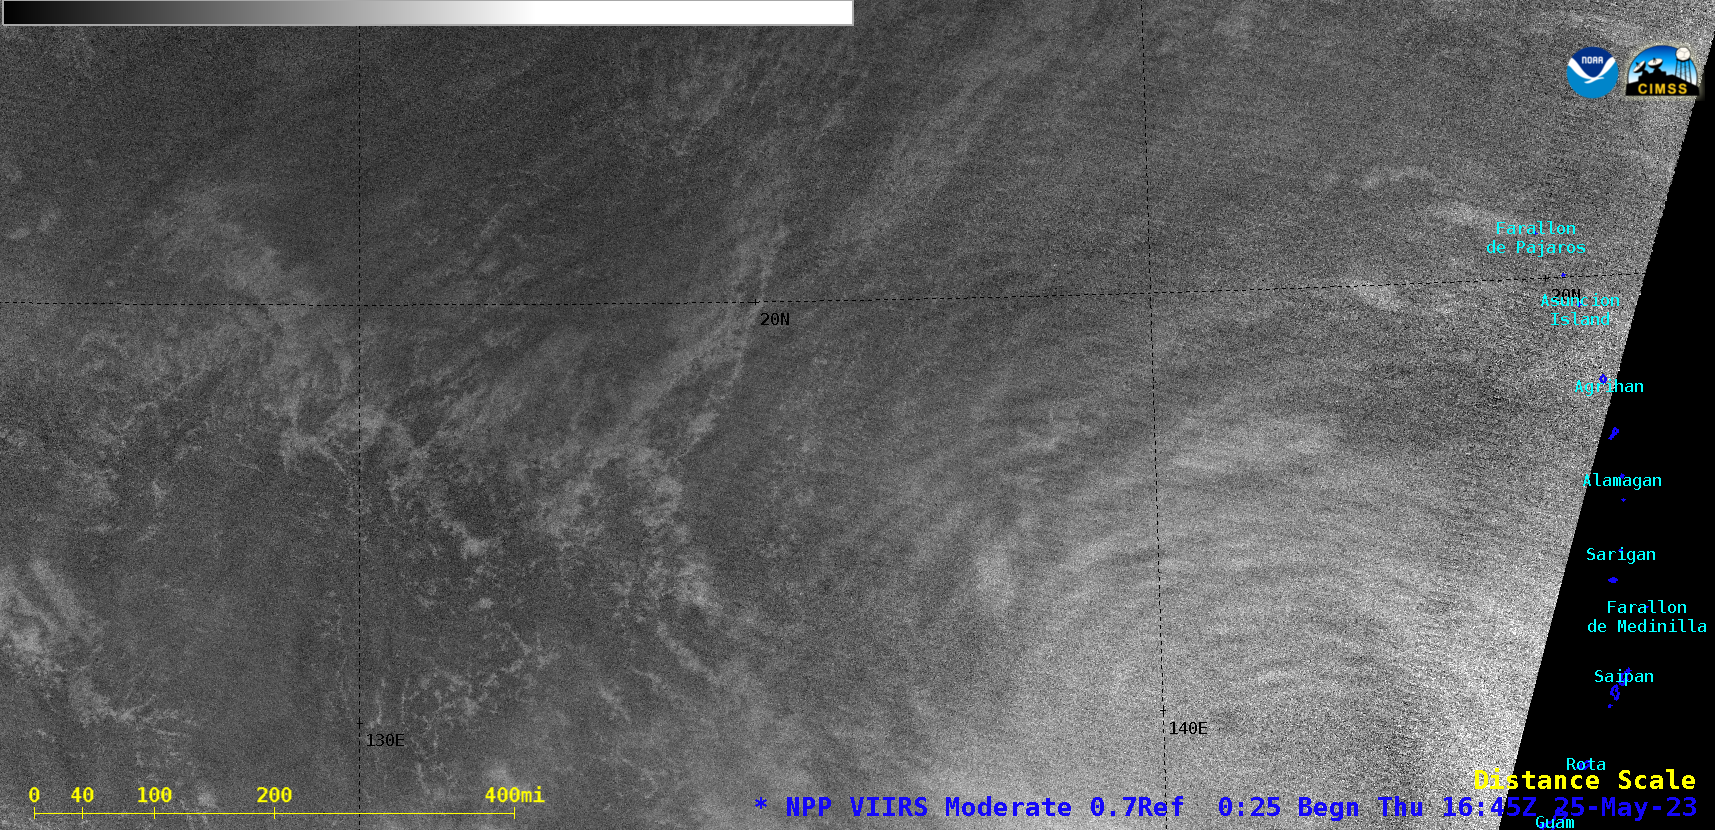
Suomi-NPP VIIRS Day/Night Band (0.7 µm) image, valid at 1655 UTC on 25 May [click to enlarge]
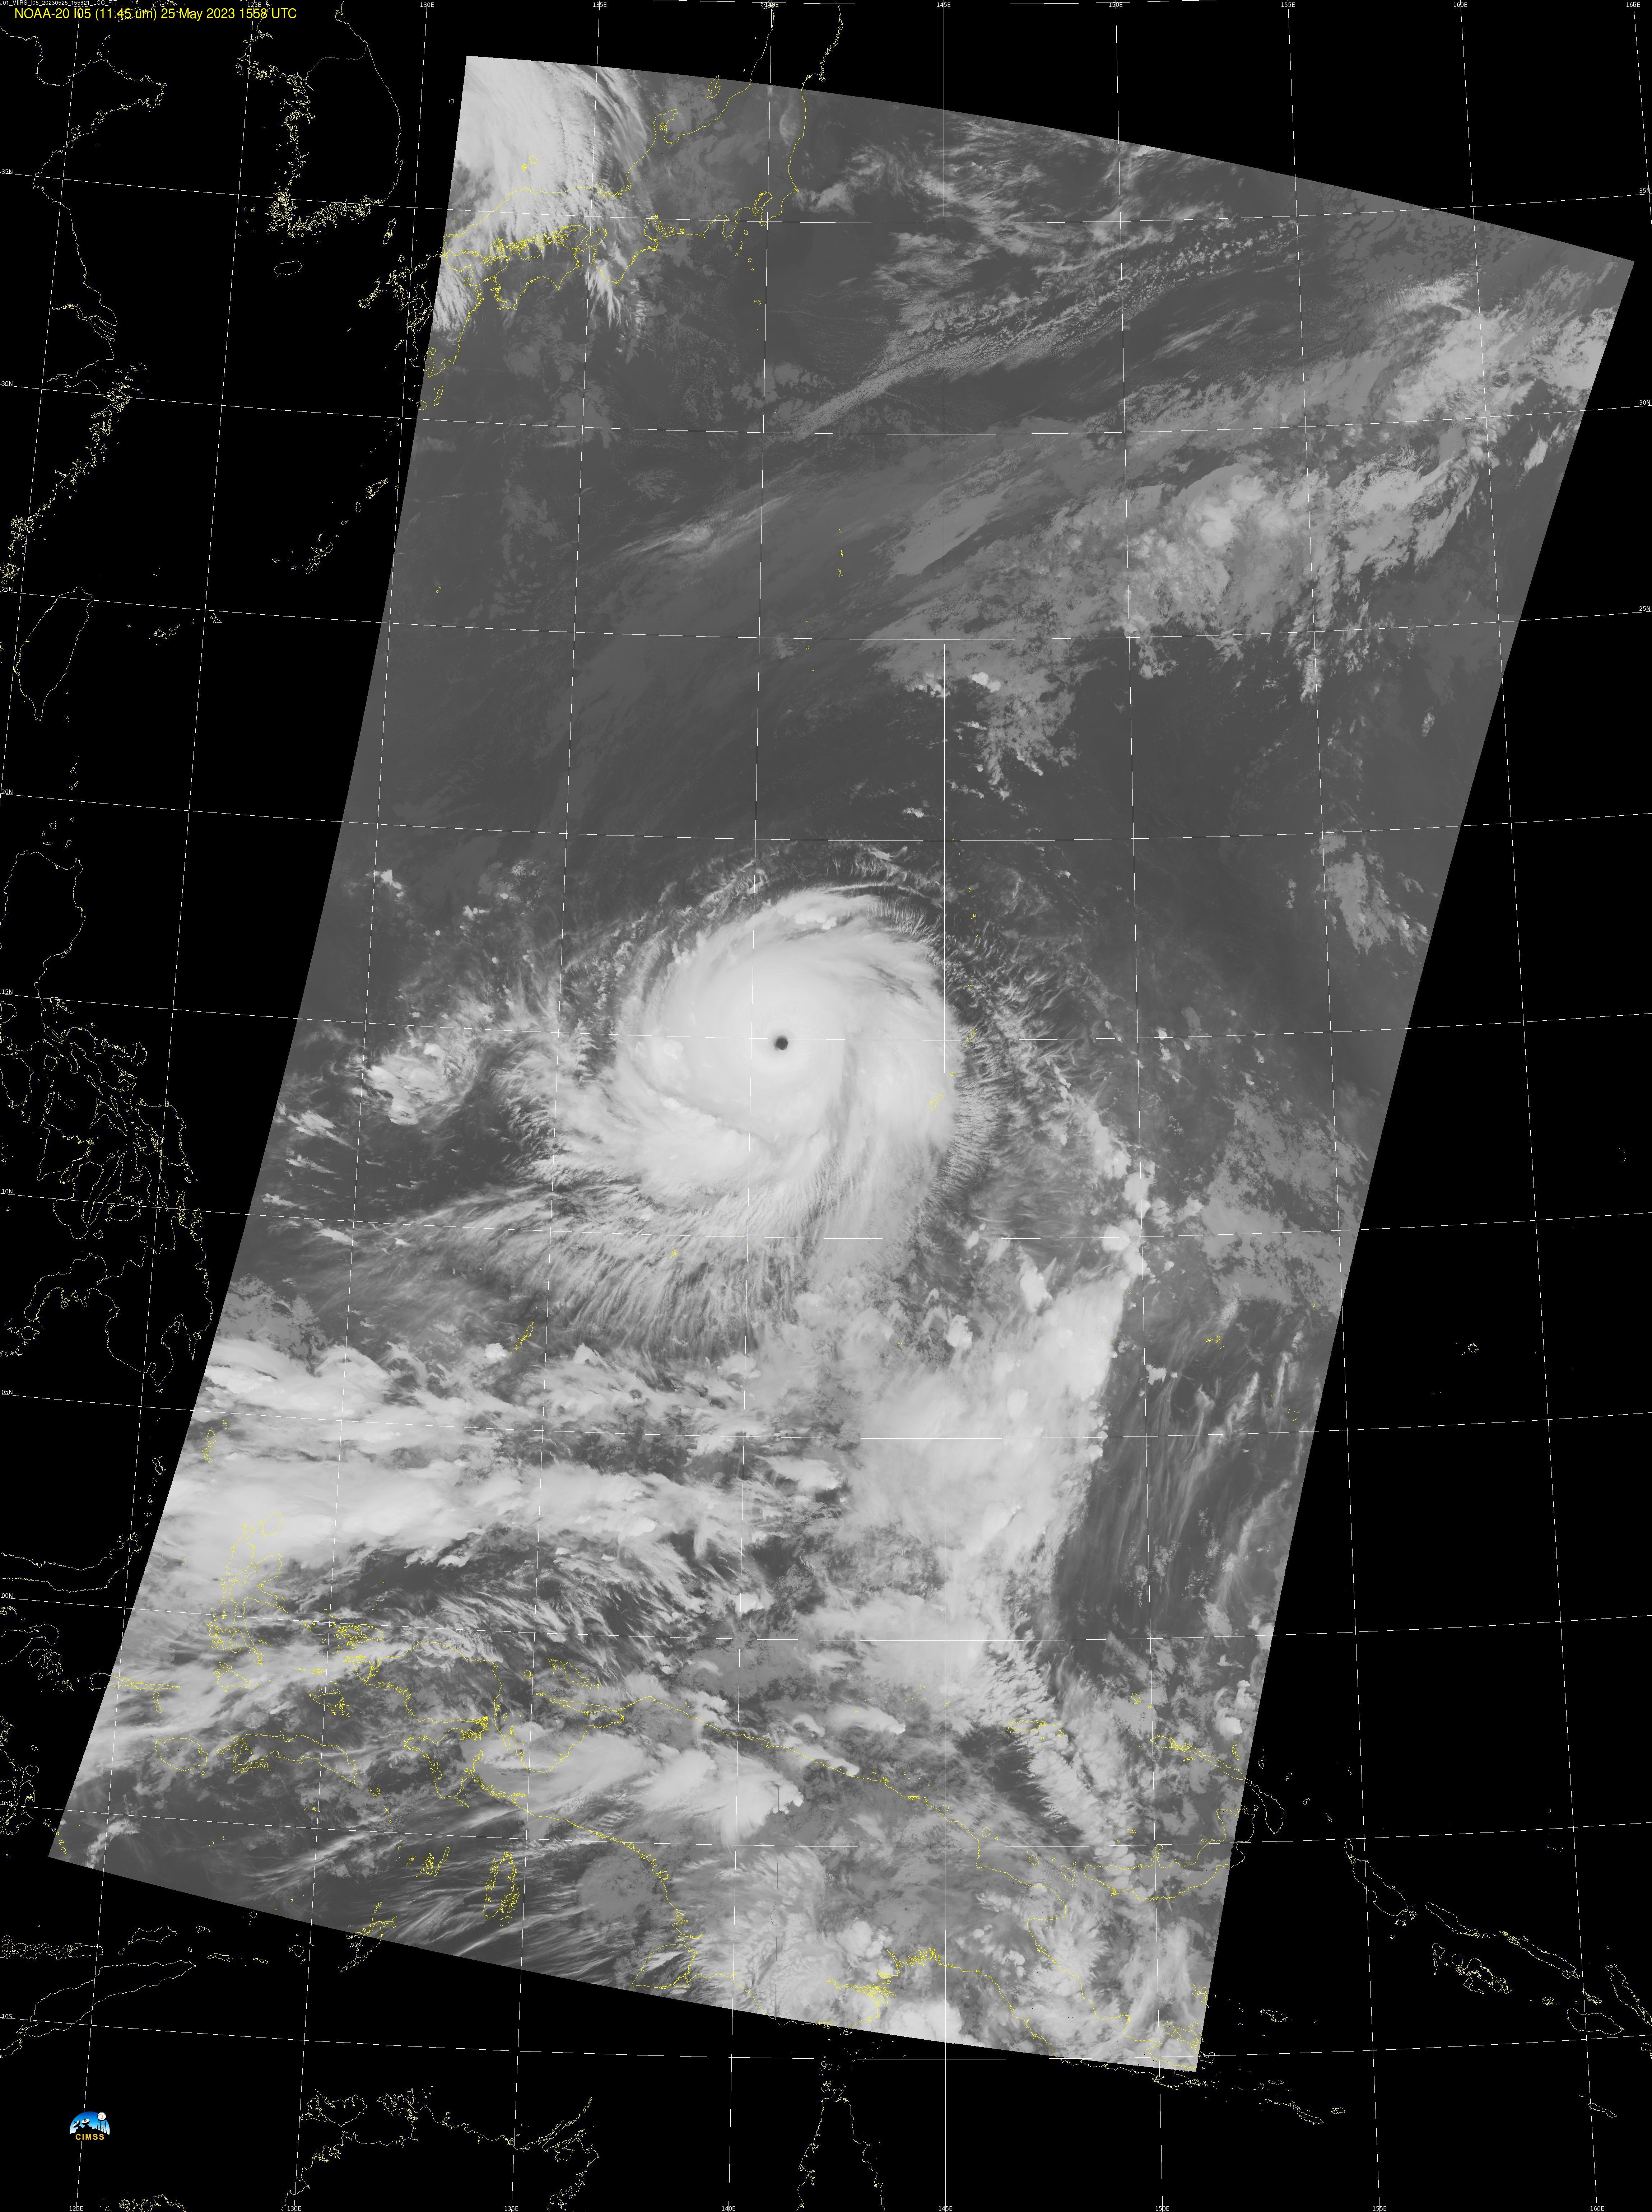
A long animation of Himawari-9 “Clean” Infrared Window (10.4 µm) images
(below) showed that the eye of Mawar exhibited a small amount of trochoidal motion during the day.
JMA Himawari-9 “Clean” Infrared Window (10.4 µm) images [click to play animated GIF | MP4]
View only this post
Read Less


