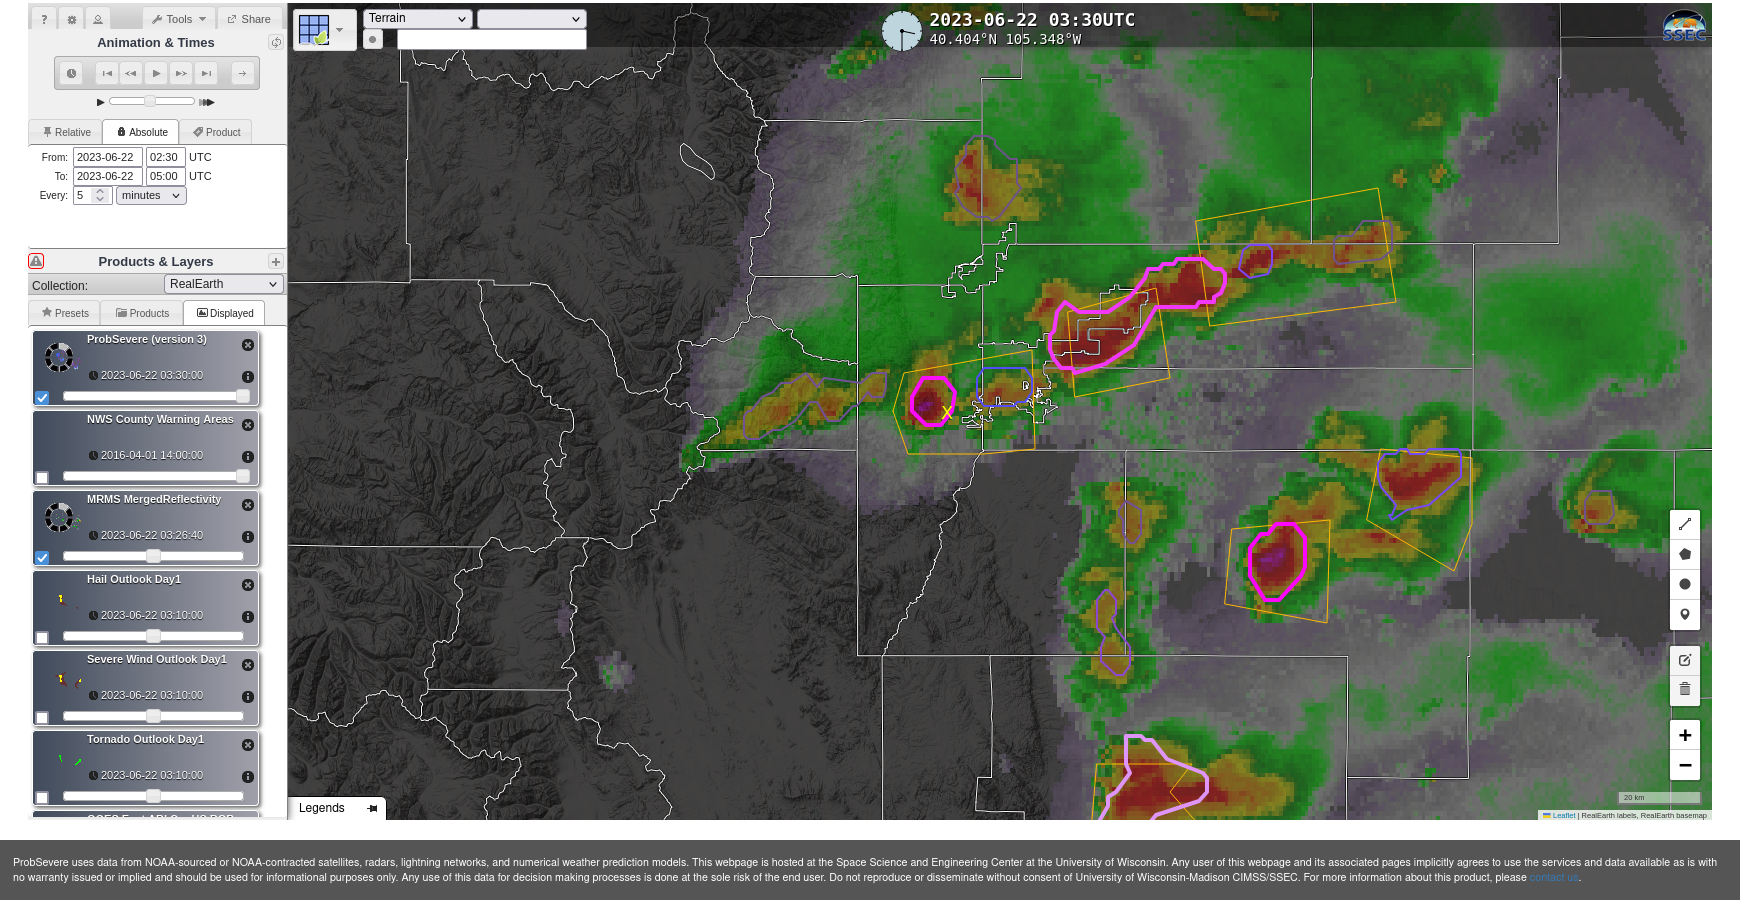
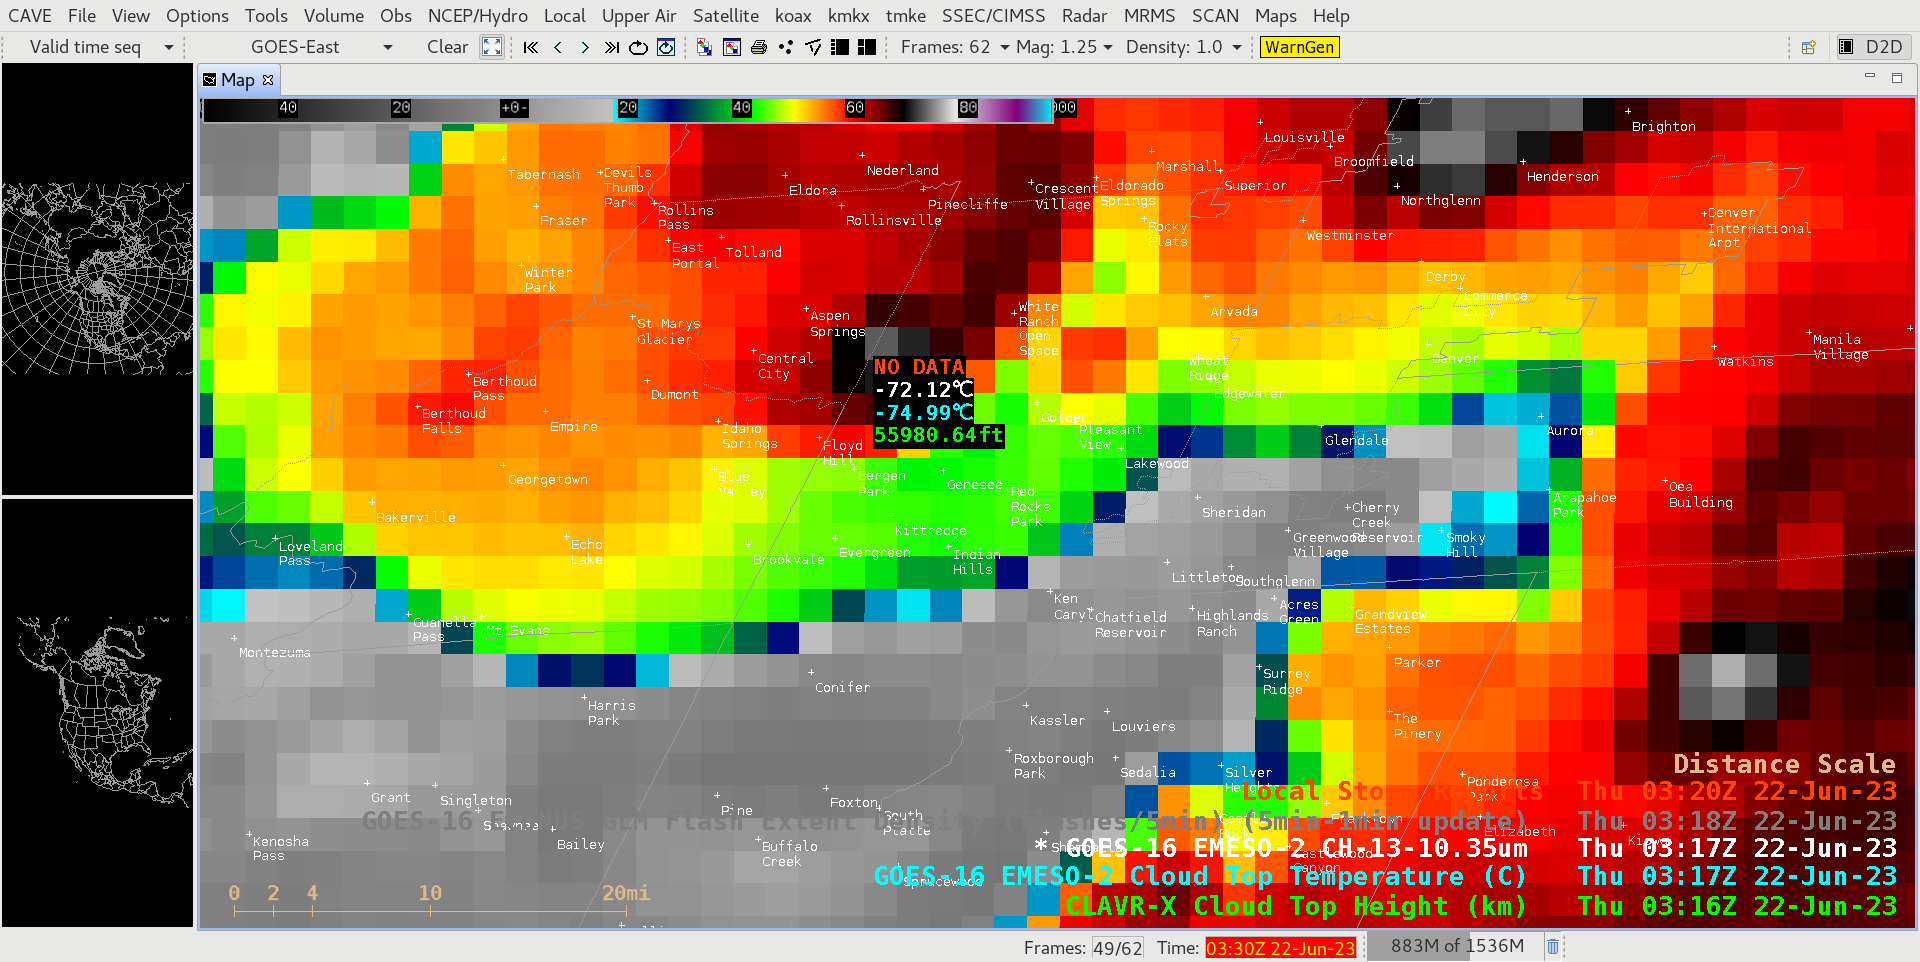
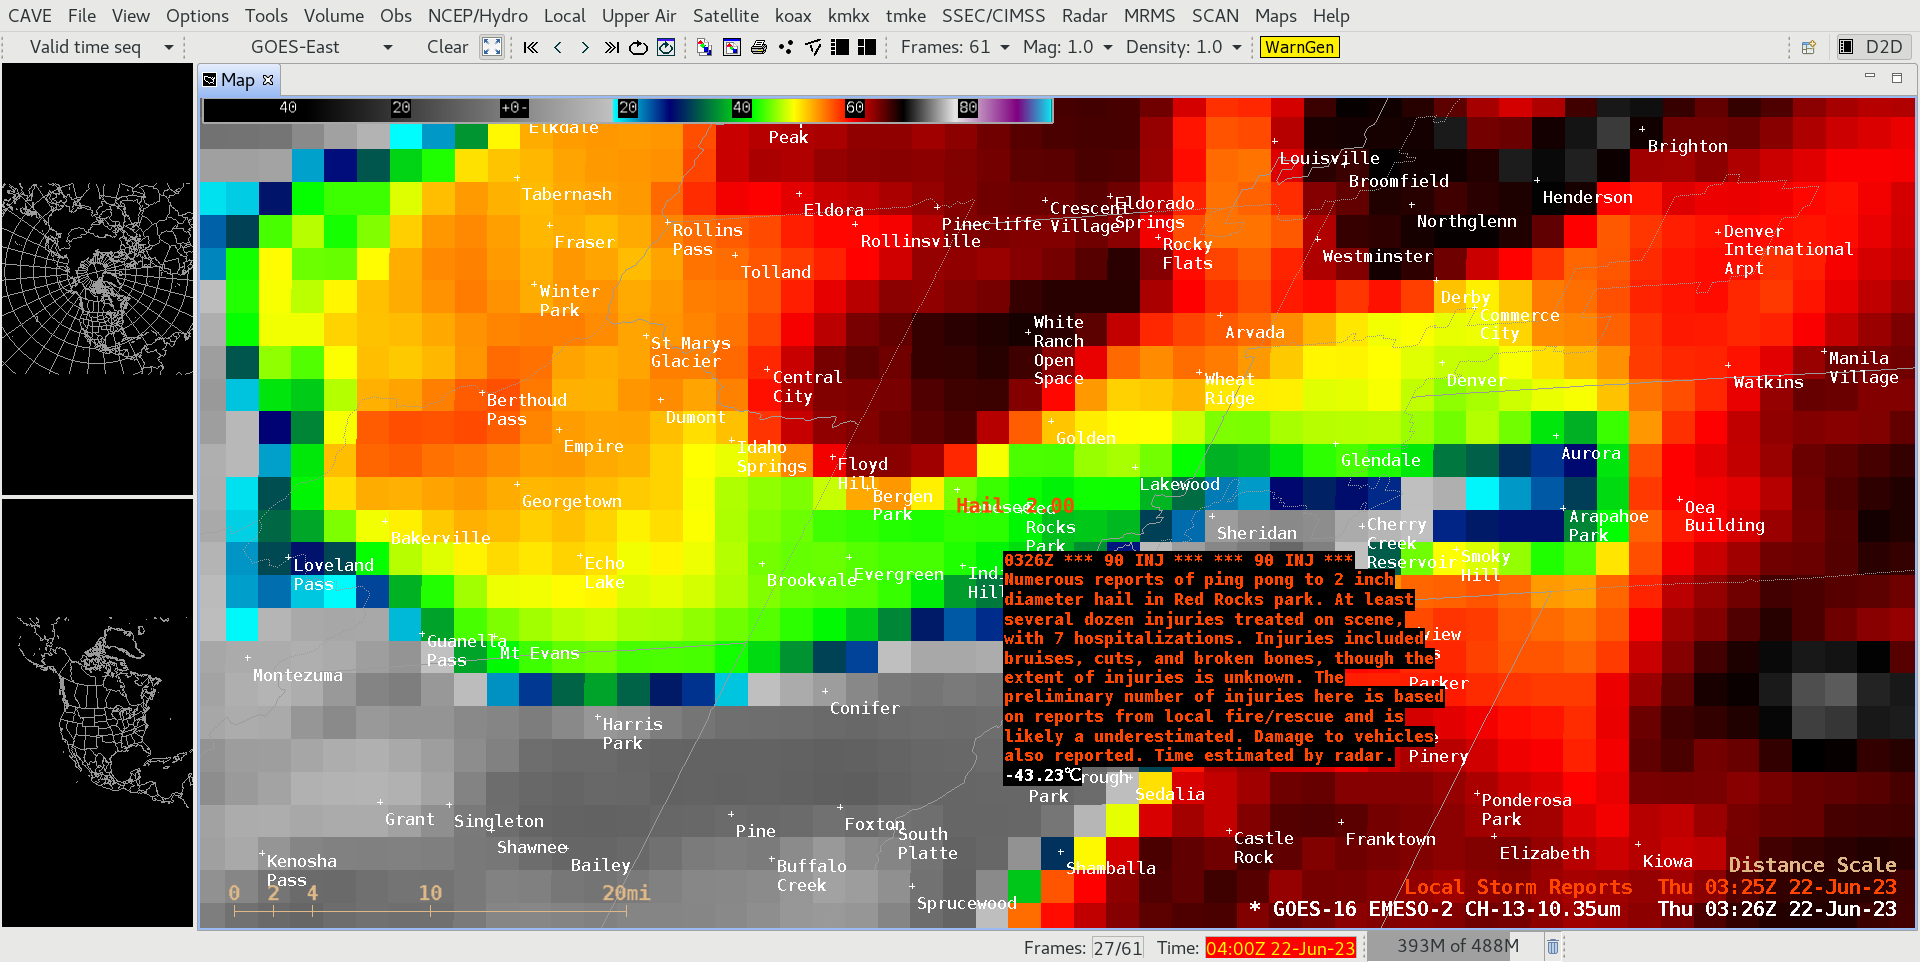
Large hail caused multiple injuries at the Red Rocks Amphitheater to the west of Denver on 21 June 2023 (News story 1, 2, 3; see also this tweet from the NWS in Boulder at 0326 UTC). This occurred in a region that the Storm Prediction Center flagged as in an atmosphere with an Enhanced Risk of severe weather. The principal severe threat was hail. The animation above shows the RealEarth display of ProbSevere (version 3) and it shows the approach of the radar object that produced the hail; a severe thunderstorm warning was in place. The image below shows the probSevere readout at 0330 UTC; the yellow ‘X’ approximates the location of Red Rocks.
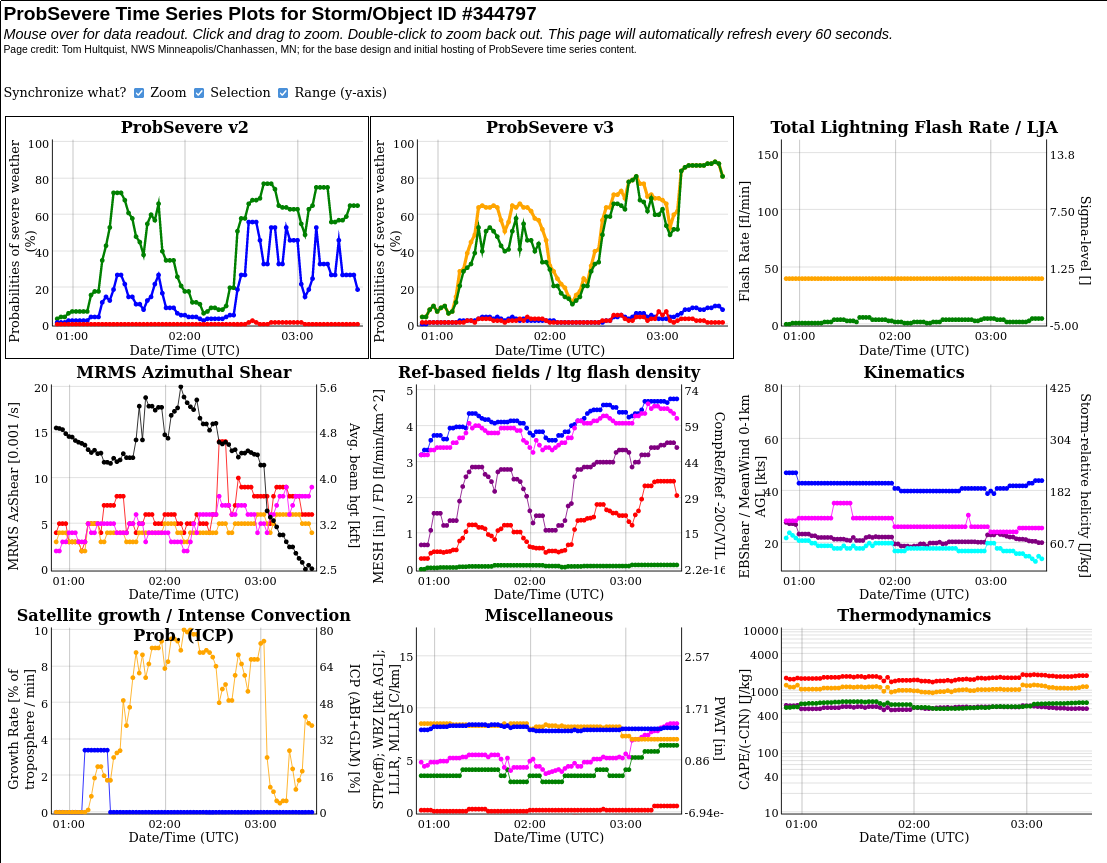
ProbSevere allows a readout of the components used in the probability computations. The Radar Object nearing Red Rocks in the image above is #344797 — and time series of the parameters are shown below (available in interactive form here for a few days). Hail has much larger probabilities than either wind or tornado in this case. Maximum Expected Hail Size at 0330 UTC was 2.46″.
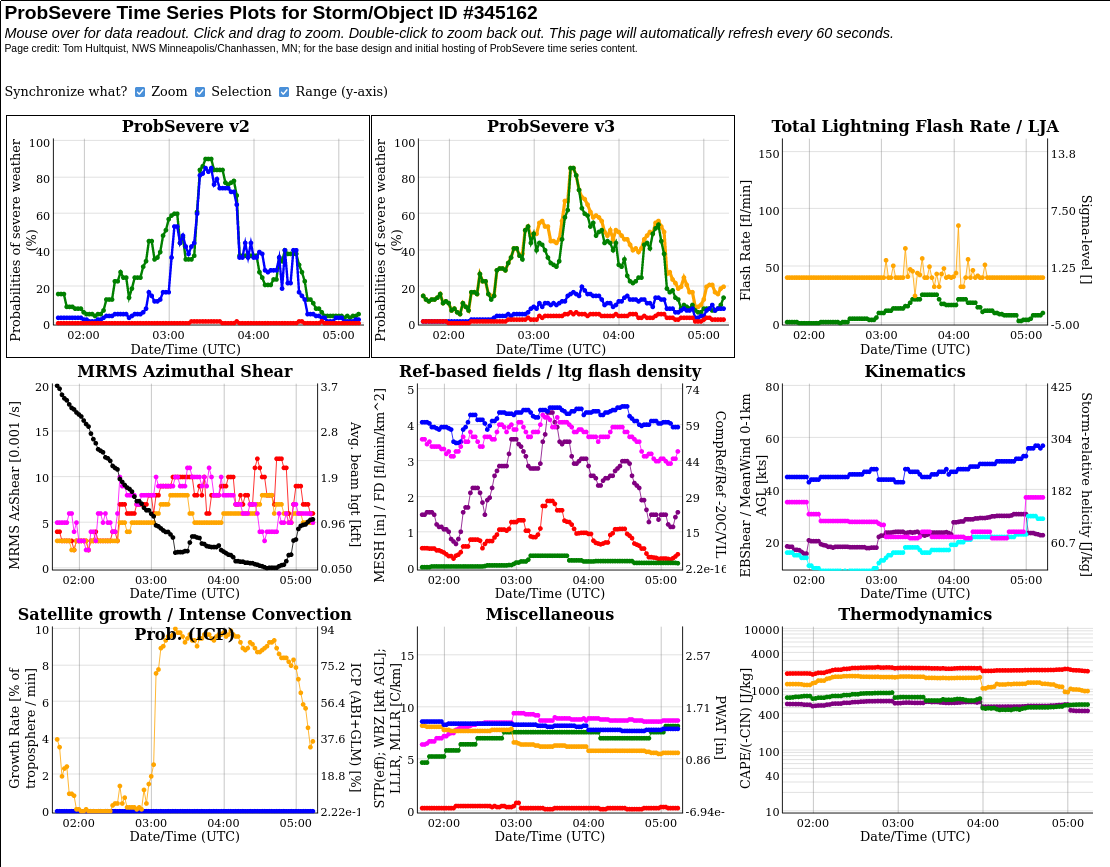
Shortly after 0330 UTC, the radar object associated with the large hail over Red Rocks merged with the radar object to its east, radar object #345162, and its time series is shown below. Note the peak in ProbHail probabilities around 0330 UTC.
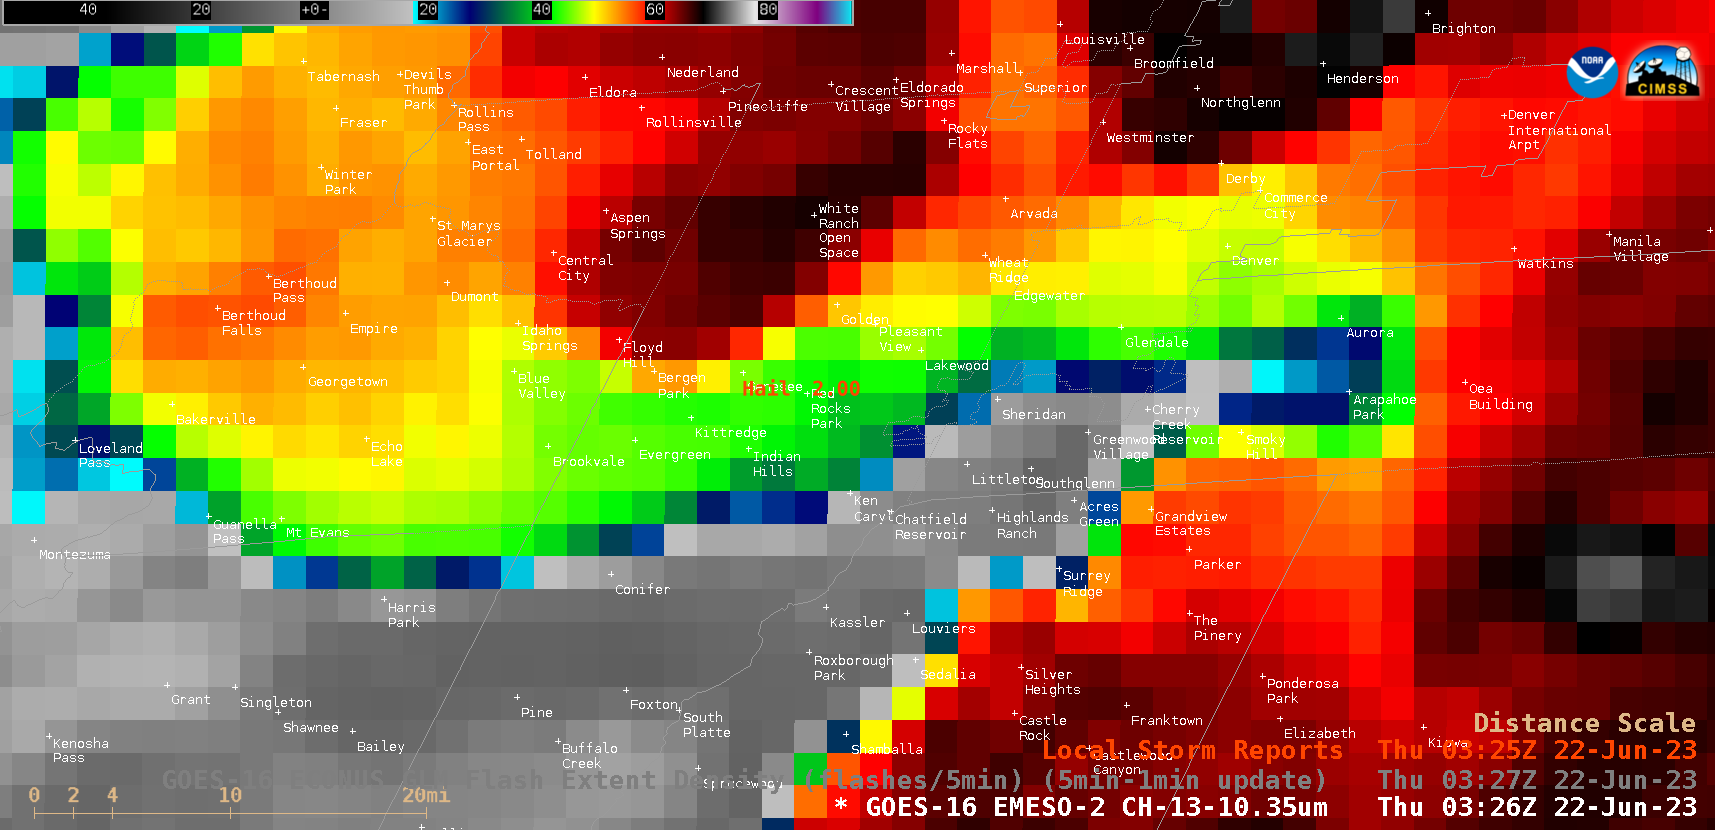
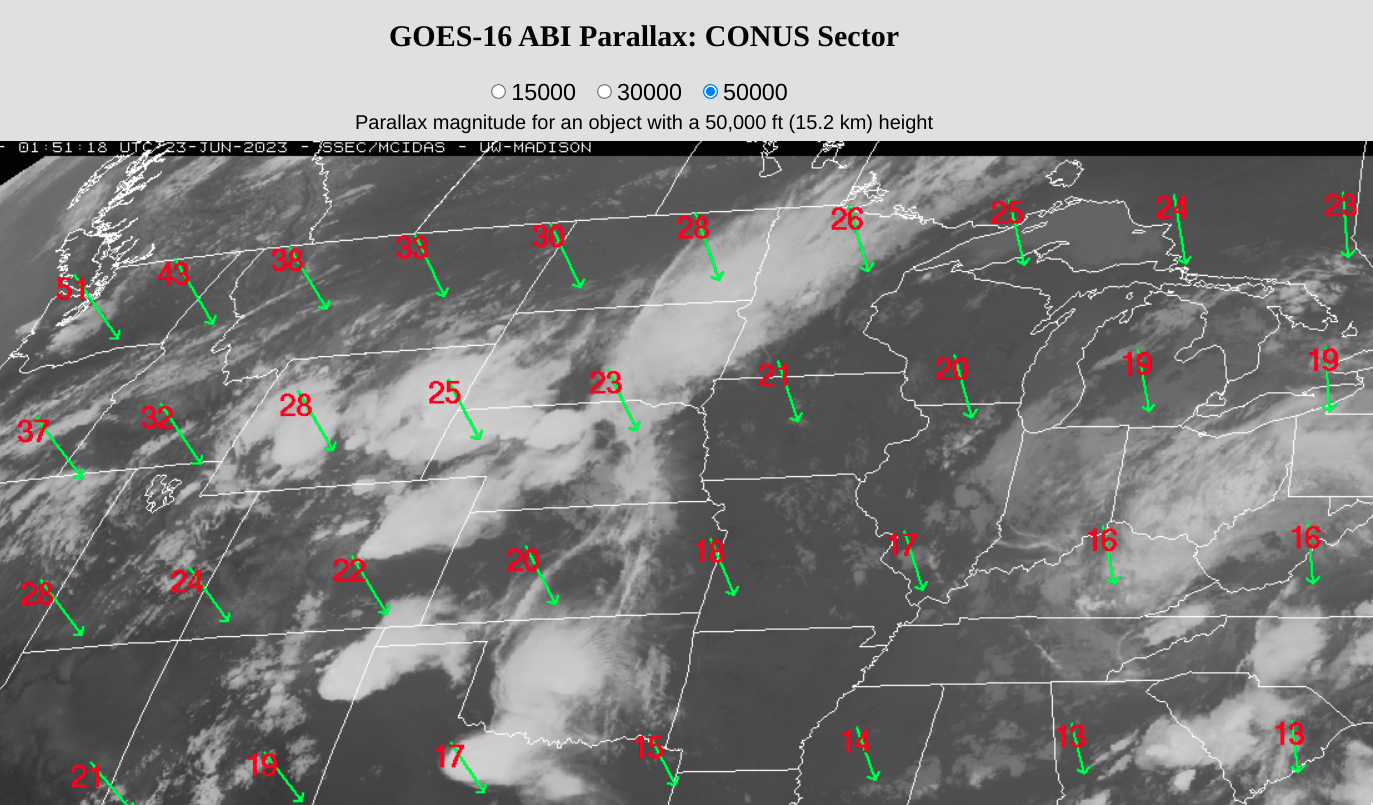
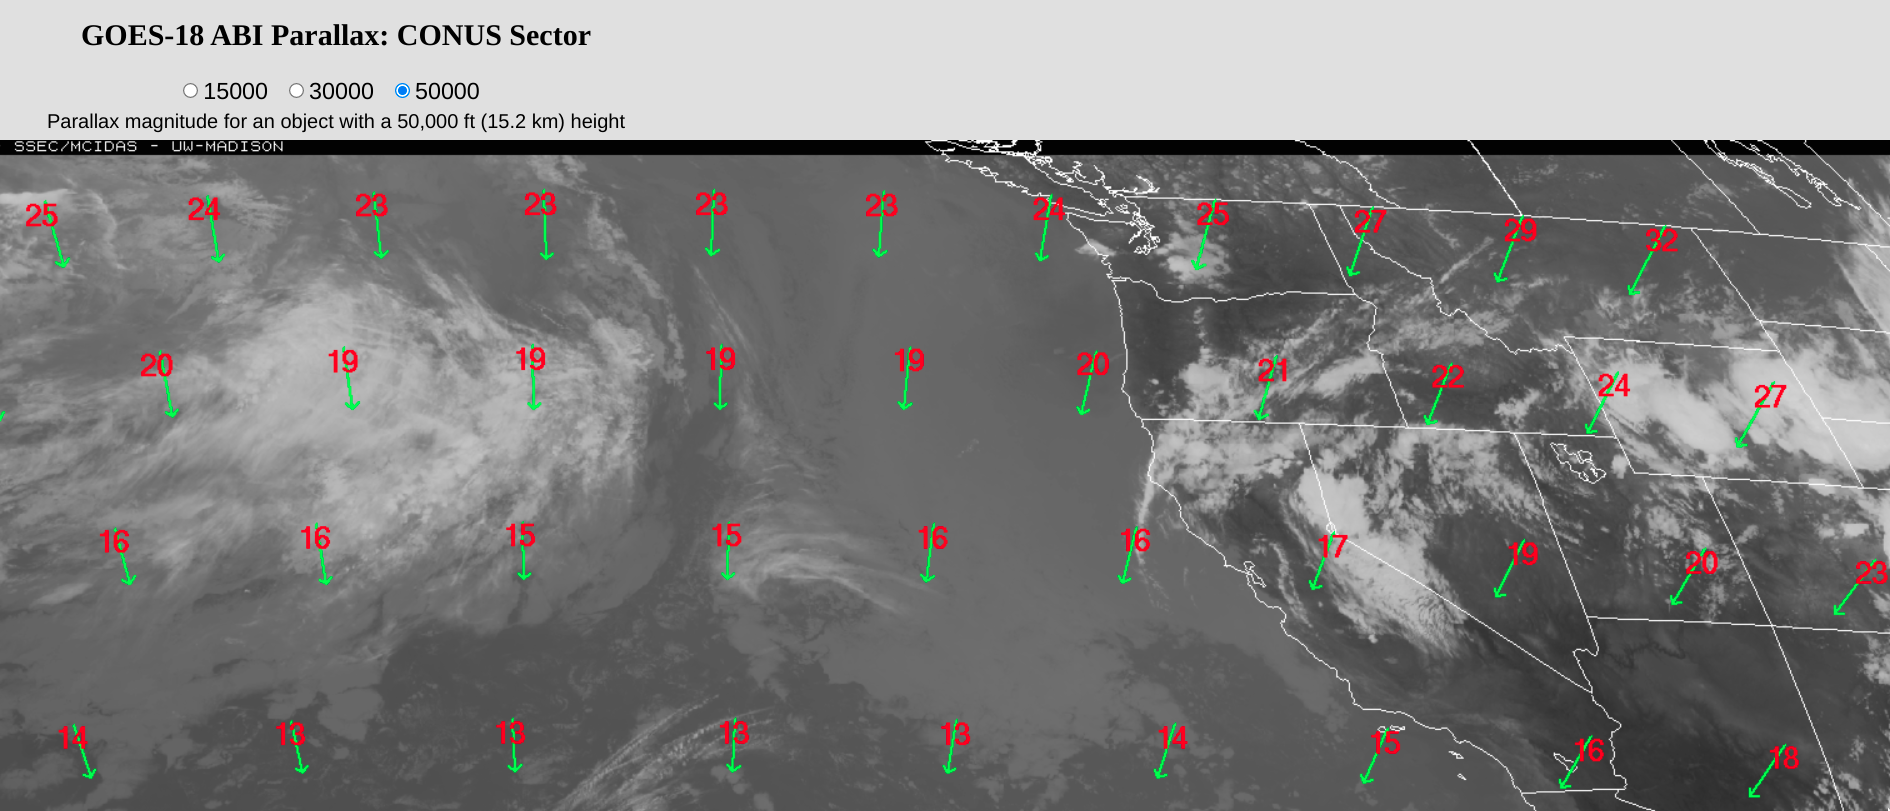
ProbSevere LightningCast Probabilities also showed an enhanced threat of lightning for the hours surrounding the hail event, as shown below. The LightningCast contours shown below are not parallax-corrected (the ABI data are not parallax-corrected either). Thus the features are displayed farther from the sub-satellite point (at 0oN, 75.2oW) than in reality (as discussed here).
This tweet describes the ground-based lightning observations near Red Rocks in the hours surrounding the hail event.
View only this post Read Less

