Satellite signatures of the SpaceX Starship test launch
GOES-16 images of ABI spectral bands 01-16, plus a Rocket Plume RGB [click to play animated GIF | MP4]
There was some overlap of the 2 GOES-16 Mesoscale Domain Sectors, which provided images at 30-second intervals (below) that better captured a signature of the rocket explosion at 1337 UTC (triggered by activation of the flight termination system at an altitude near 39 km, due to rocket booster anomalies) — which occurred along the extreme southern edge of Mesoscale Sector 1 coverage.
30-second GOES-16 images of ABI Near-Infrared and Infrared spectral bands 04-16, plus a Rocket Plume RGB [click to play animated GIF | MP4]
GOES-16 Rocket Plume RGB images, with and without an overlay of GLM Flash Extent Density [click to play animated GIF | MP4]
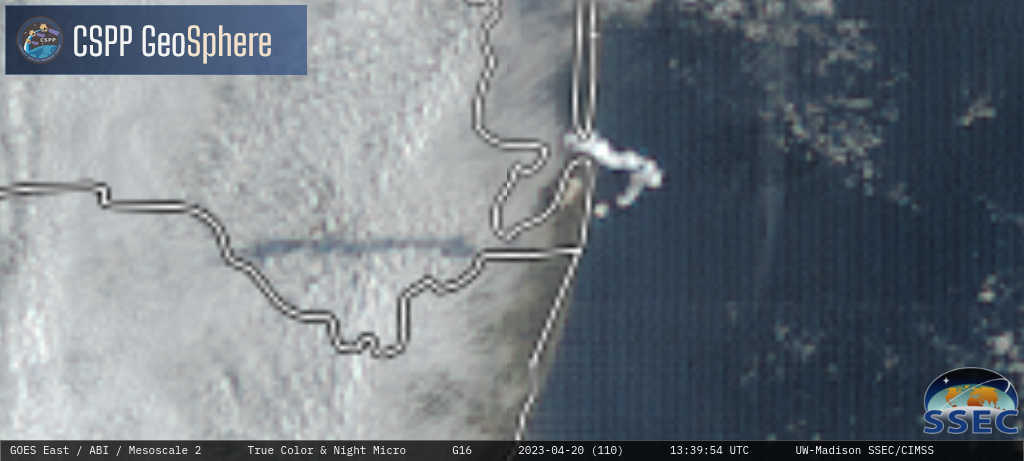
GOES-16 True Color RGB images [click to play MP4 animation]