This website works best with a newer web browser such as Chrome, Firefox, Safari or Microsoft Edge. Internet Explorer is not supported by this website.

Severe turbulence injures passengers near Hawai`i

On 18 December 2022, Hawaiian Airlines Flight 35 (HAL 35, from Phoenix to Honolulu) encountered severe turbulence about 30 minutes prior to landing, which injured 36 passengers and crew (media report). GOES-17 (GOES-West) Upper-level Water Vapor (6.2 µm) images (above) include contours of Moderate Or Greater (MOG) Turbulence Probability and Pilot Report... Read More

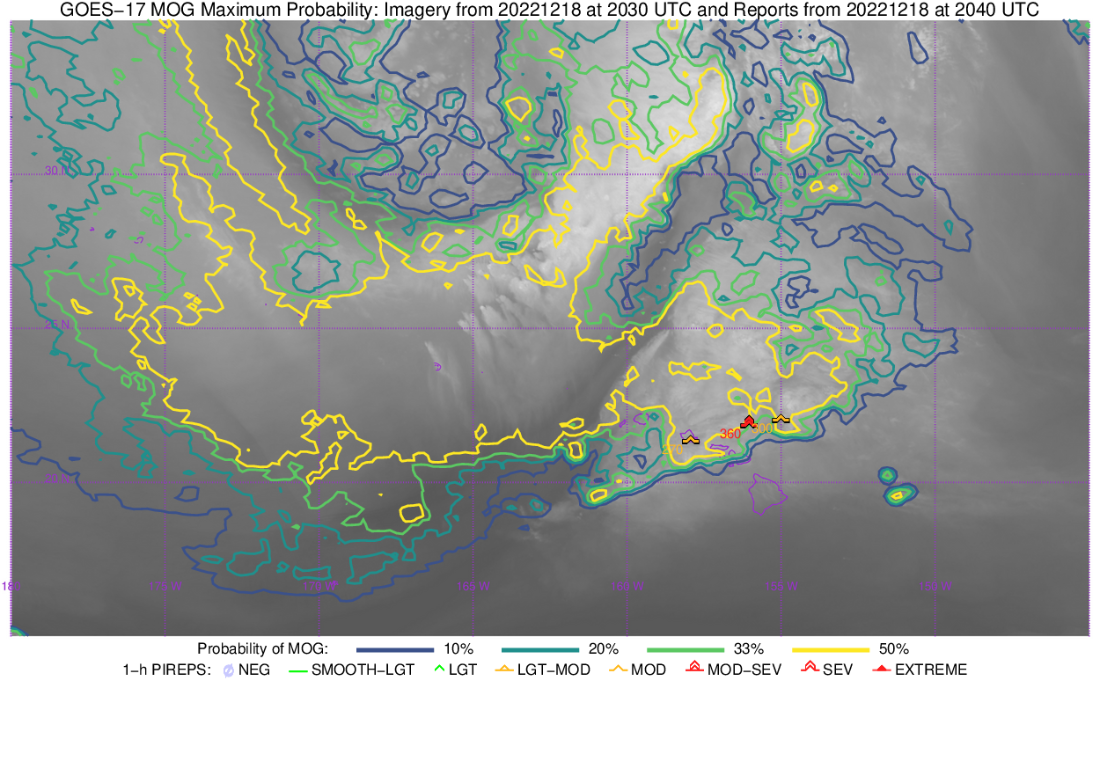
GOES-17 Upper-level Water Vapor (6.2 µm) images, with contours of Moderate Or Greater (MOG) Turbulence Probability and Pilot Report plots of turbulence [click to play animated GIF | MP4]

On 18 December 2022, Hawaiian Airlines Flight 35 (HAL 35, from Phoenix to Honolulu) encountered severe turbulence about 30 minutes prior to landing, which injured 36 passengers and crew (media report). GOES-17 (GOES-West) Upper-level Water Vapor (6.2 µm) images (above) include contours of Moderate Or Greater (MOG) Turbulence Probability and Pilot Report (PIREP) plots of turbulence (source); the severe turbulence reportedly occurred at 2016 UTC at an altitude of 36,000 feet (note: the actual HAL 35 Severe Turbulence PIREP plot for this event did not appear on the MOG Probability images).

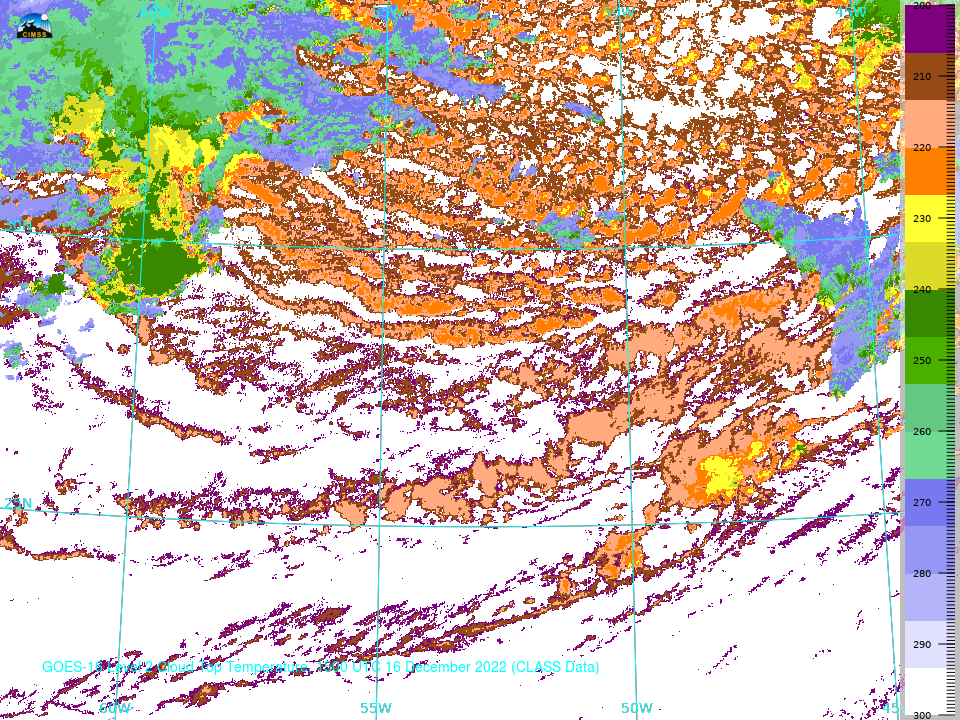
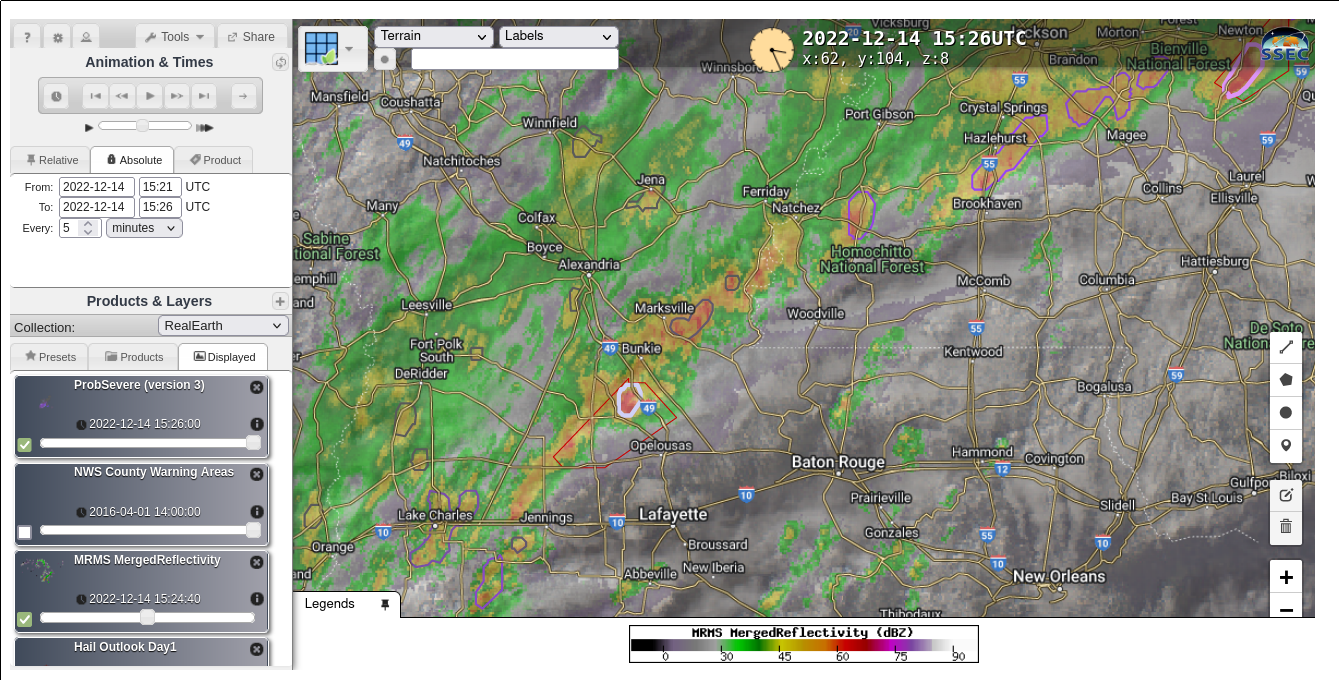
AWIPS images of “Red” Visible (0.64 µm), Upper-level Water Vapor and “Clean” Infrared Window (10.3 µm) with MOG Turbulence Probability contours are shown below. Unfortunately, the HAL 35 PIREP of severe turbulence also did not show up in the AWIPS imagery. Thunderstorms were increasing in intensity and areal coverage north and northeast of Hawai`i during this time period — the coldest 10.3 µm cloud-top infrared brightness temperatures of those thunderstorms were generally in the -50 to -55ºC range (brighter shades of green).

GOES-17 “Red” Visible (0.64 µm), Upper-level Water Vapor (6.2 µm) and “Clean” Infrared Window (10.3 µm) images, with contours of Moderate Or Greater (MOG) Turbulence Probability and Pilot Report plots of turbulence [click to play animated GIF | MP4]


The PIREP for this event (taken from the Preliminary Aviation FTR filed by WFO Honolulu) shows the turbulence occurred 65 nautical miles northeast of Kahului airport (OGG) on Maui:

PIREP: HNL UUA /OV OGG020065/TM 2016/FL360/TP A332/TB SEV

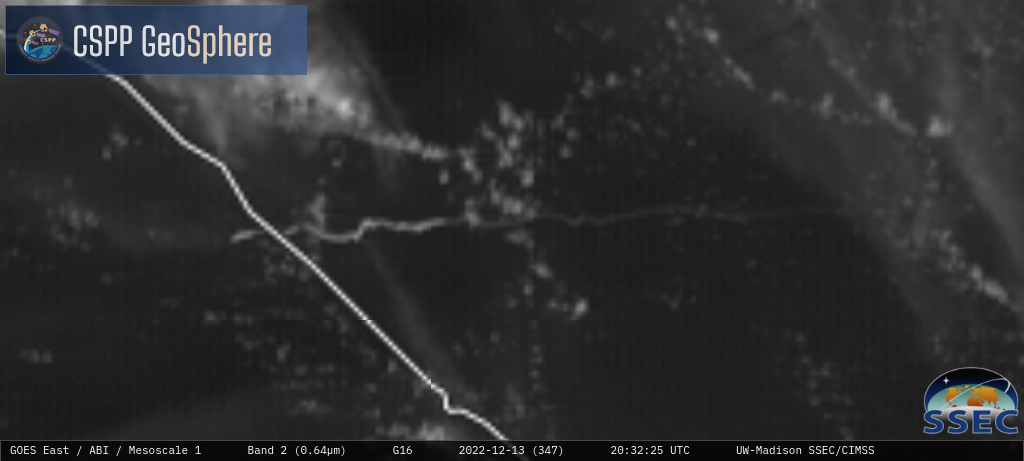
Visible imagery for the time of the incident is shown below.

GOES-17 Visible Imagery, 2016 UTC (the time of the PIREP) with and without Turbulence Probabilities fields from 2020 UTC (Click to enlarge)

===================================

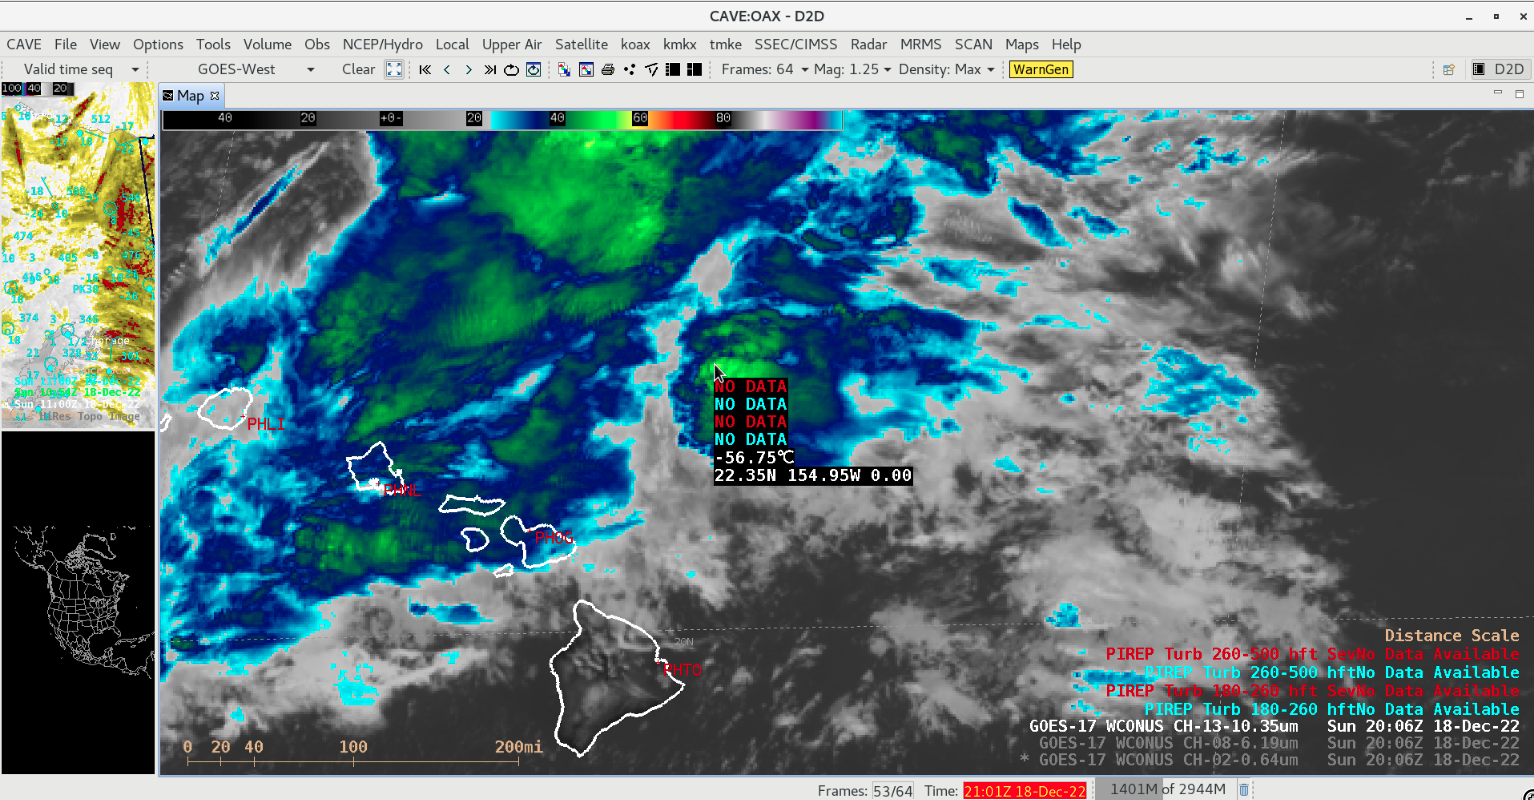
GOES-17 “Clean” Infrared Window (10.3 µm) image at 2006 UTC, with a cursor-sampled value of the cloud-top infrared brightness temperature near the turbulence encounter [click to enlarge]

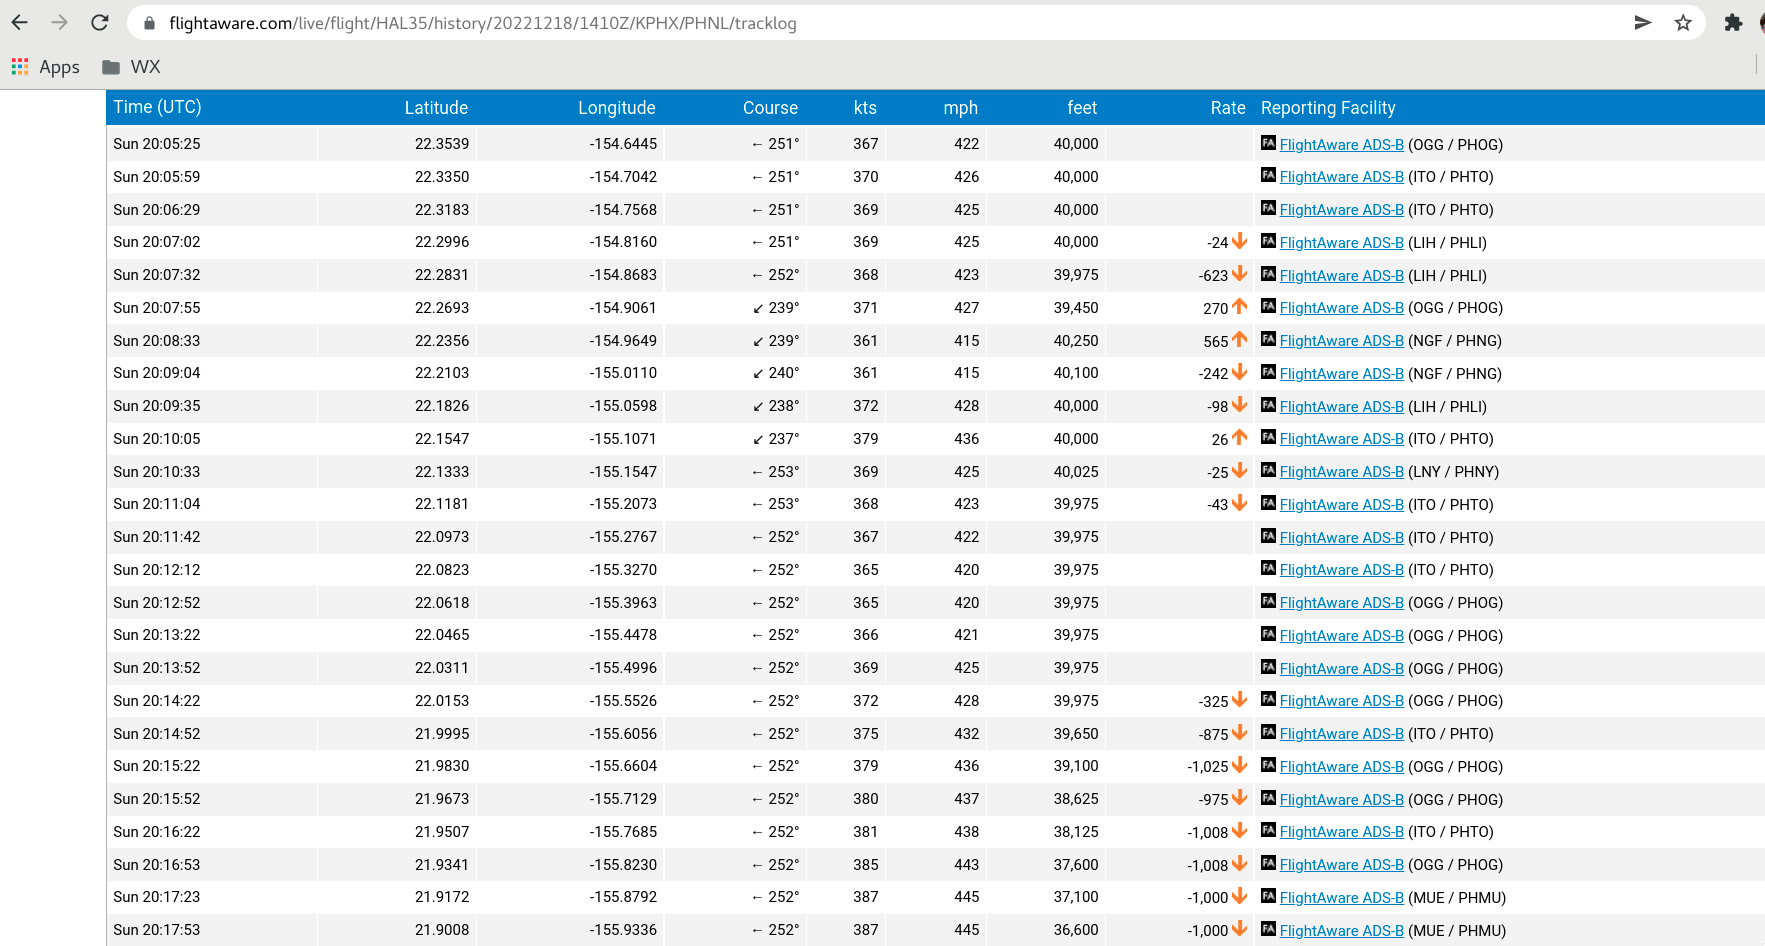
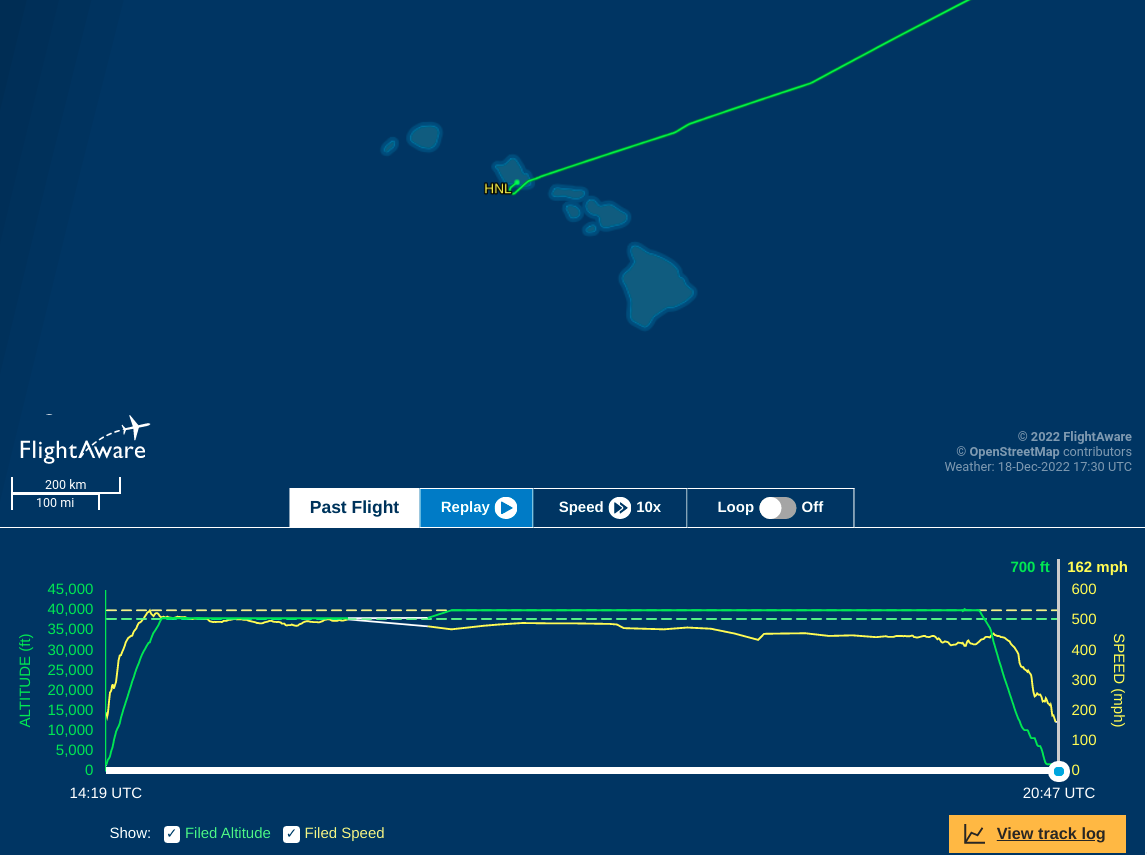
Upon further interrogation of the flight log and flight path data from Flightaware.com, it appears as though the actual turbulence encounter might likely have occurred close to 20:07:32 UTC, at an altitude of 39-40,000 feet (with a rapid descent, immediately followed by rapid ascent), at latitude/longitude 22.28ºN / 154.87ºW. The aforementioned PIREP (included in the Preliminary Aviation FTR) was probably transmitted at a slightly later time and different location/altitude (which is not an uncommon occurrence, as pilots first assess the aircraft situation before sending a PIREP). The GOES-17 Infrared image at 2006 UTC (above) includes a cursor-sampled cloud-top infrared brightness temperature value of -56.75ºC near the turbulence encounter location (Note: 20:06:17 UTC was the start time of the GOES-17 PACUS (Pacific-US) sector scan — however, the satellite was actuallly scanning the area of the turbulence event at 20:07:47 UTC).

A toggle between 2006 UTC GOES-17 Visible, Water Vapor and Infrared images is shown below. Note the small overshooting top depicted in the Visible image, which was casting a shadow to its north-northwest — this thunderstorm overshooting top was located within the 50% MOG Turbulence Probability (yellow) contour.

GOES-17 “Red” Visible (0.64 µm), Upper-level Water Vapor (6.2 µm) and “Clean” Infrared Window (10.3 µm) images at 2006 UTC, with contours of MOG Turbulence Probability [click to enlarge]

Plots of rawinsonde data from Lihue and Hilo, Hawai`i at 00 UTC on 19 December (below) showed that the -56.75ºC cloud-top infrared brightness temperature sampled on the 2006 UTC image roughly corresponded to an altitude of 42,000 feet — suggesting that the overshooting top of that particular thunderstorm likely reached /exceeded Hawaiian Airlines Flight 35’s cruising altitude of 40,000 feet.

Plots of rawinsonde data from Lihue and Hilo at 00 UTC on 19 December [click to enlarge]

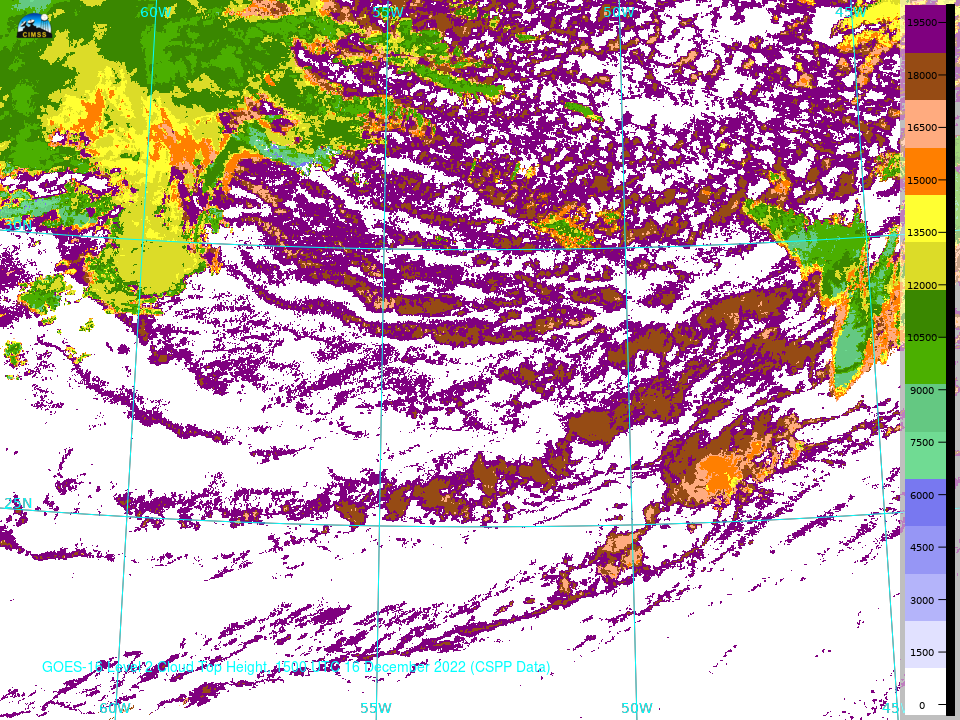
In a closer view of the cluster of thunderstorms likely responsible for the severe turbulence using GOES-17 Visible and Infrared images along with the Cloud Top Height (CTH) derived product (below), maximum CTH values were around 39,530 feet (darker shades of blue). 

GOES-17 “Red” Visible (0.64 µm), “Clean” Infrared Window (10.3 µm) and Cloud Top Height [click to play animated GIF | MP4]

View only this post Read Less

GOES-R Level 2 Products with geo2grid version 1.1

The latest release of the CSPPGeo software package geo2grid (version 1.1, downloadable here) includes support to display two Level 2 products from GOES-R: Cloud Top Temperature and Cloud Top Height. Cloud Top Temperature, above, created using data ordered and downloaded from the NOAA CLASS site, is at 2-km resolution (in line with the latest... Read More

GOES-16 Level 2 Cloud Top Temperature product, 1500 UTC on 16 December 2022 (Click to enlarge)

The latest release of the CSPPGeo software package geo2grid (version 1.1, downloadable here) includes support to display two Level 2 products from GOES-R: Cloud Top Temperature and Cloud Top Height. Cloud Top Temperature, above, created using data ordered and downloaded from the NOAA CLASS site, is at 2-km resolution (in line with the latest Algorithm Theoretical Basis Document — ATBD — for the product), and is created for every time step in the Full Disk and Mesoscale Domains. The commands to create this image are shown below. The ‘SubTrop’ grid used was created as shown in this blog post.

../geo2grid.sh -r abi_l2_nc -w geotiff -p TEMP --grids SubTrop --grid-configs $GEO2GRID_HOME/SubTrop.yaml -f $GEO2GRID_HOME/bin/Level2/CLASSData/OR_ABI-L2-ACHTF-M6_G16_s20223501500*.nc

../add_coastlines.sh -o GOES-16_ABI_TEMP_20221216_150020_SubTropCLASS.png  --add-grid --grid-D 5.0 5.0 --grid-d 5.0 5.0 --add-coastlines --grid-text-size 14 --add-colorbar --colorbar-align right --colorbar-text-size 10 --colorbar-tick-marks 100 GOES-16_ABI_TEMP_20221216_150020_SubTrop.tif

Cloud-top Height is shown below, from 3 data sources: The SBN, NOAA CLASS, and CSPPGeo Algorithm Integration Team (AIT) software. You will note that both SBN and CLASS (produced from the GOES-R Ground System) show (identical) data with 10-km resolution (AWIPS imagery likewise shows 10-km resolution for this field). Only the CSPPGeo AIT output shows the data at 2-km resolution (in agreement with the latest ATBD for this product). This degraded resolution for Cloud Top Height (and other cloud products) is a known issue/risk at NESDIS affecting Clear Sky Radiances that are then assimilated into numerical prediction models. Work continues to update the Ground System to mitigate this risk. The commands to create the imagery from downloaded CLASS data are shown below.

../geo2grid.sh -r abi_l2_nc -w geotiff -p HT --grids SubTrop --grid-configs $GEO2GRID_HOME/SubTrop.yaml -f $GEO2GRID_HOME/bin/Level2/CLASSData/OR_ABI-L2-ACHAF-M6_G16_s20223501500207_e20223501509515_c20223501512366.nc

../add_coastlines.sh -o GOES-16_ABI_HT_20221216_150020_SubTropCLASS.png  --add-grid --grid-D 5.0 5.0 --grid-d 5.0 5.0 --add-coastlines --grid-text-size 14 --add-colorbar --colorbar-align right --colorbar-text-size 10 --colorbar-tick-marks 1500 GOES-16_ABI_HT_20221216_150020_SubTrop.tif
Cloud Top Height (meters) at 1500 UTC on 16 December 2022, from data at CLASS, from over the SBN, and from CSPP’s AIT software) (Click to enlarge)

The CIMSS Blog also discussed Level 2 products and geo2grid — with an earlier beta version — here.

View only this post Read Less

IntenseStormNet with severe weather in the deep south

IntenseStormNet is a part of the ProbSevere portfolio; it relates ABI Channels 2 (0.64 µm) and 13 (10.3 µm) and GLM observations of Flash Extent Density (see this past blog post for more information) to the likelihood that a given satellite-detected storm is severe. (The probabilities are created from output of a Convolutional Neural... Read More

RealEarth display of IntenseStormNet polygons on top of ABI Band 13, 1536 – 1601 UTC on 14 December 2022 (Click to enlarge) (Contour colors: Blue: 10%; Cyan: 25%; Green: 50%; Magenta: 90%)

IntenseStormNet is a part of the ProbSevere portfolio; it relates ABI Channels 2 (0.64 µm) and 13 (10.3 µm) and GLM observations of Flash Extent Density (see this past blog post for more information) to the likelihood that a given satellite-detected storm is severe. (The probabilities are created from output of a Convolutional Neural Network) The product is available in a RealEarth instance at this link. The animation above shows several cells identified as most likely to support severe weather (here is the 1630 UTC Convective Outlook from SPC; much of southeastern Louisiana, southern Mississippi, southern Alabama and the western Florida Panhandle is under an enhanced risk of Severe weather; extreme eastern Louisiana and parts of the central Gulf Coast — including New Orleans and Mobile — is under a Moderate risk). The most likely candidate is entering southwest Mississippi at 1601 UTC.

A tornado was actually reported just before the animation started, from that suspect cell, in Ville Platte LA, north-northwest of Lafayette, at 1523 UTC. What did IntenseStormNet look for that storm at that time? That’s shown below. The tornadic storm does indeed have a very high probability! Here’s the ProbSevere (version 3) image for the same time. Read-outs for the ProbSevere output are available for that particular Object Number (#706504), available at this (temporary) link and shown at the bottom. Note the strong increase in ICP before the tornadic event.

IntenseStormNet contours on top of GOES-16 ABI Band 13 imagery, 1526 UTC on 14 December 2022 (Click to enlarge) (Contour colors: Blue: 10%; Cyan: 25%; Green: 50%; Magenta: 90%)
ProbSevere (v2 and v3) readouts for Object Number 706504. Click to enlarge.

A Journal Article on this product is available here.

View only this post Read Less

Launch of EUMETSAT MTG-I1

A sequence of 1-minute Mesoscale Domain Sector GOES-16 (GOES-East) images from all 16 ABI spectral bands along with Rocket Plume RGB images (above) displayed signatures of the launch of EUMETSAT MTG-I1 from the Guiana Space Centre near Kourou, French Guyana (synoptic station identifier 814030) on 13 December 2022. The Ariane-5 rocket booster’s hot thermal... Read More

GOES-16 ABI spectral band 01-16 and Rocket Plume RGB images [click to play animated GIF | MP4]

A sequence of 1-minute Mesoscale Domain Sector GOES-16 (GOES-East) images from all 16 ABI spectral bands along with Rocket Plume RGB images (above) displayed signatures of the launch of EUMETSAT MTG-I1 from the Guiana Space Centre near Kourou, French Guyana (synoptic station identifier 814030) on 13 December 2022. The Ariane-5 rocket booster’s hot thermal signature was seen in all Near-Infrared and Infrared spectral bands (03-16), while the lower-tropospheric rocket condensation cloud plume signature was seen in all 16 spectral bands (moving southeastward, immediately off the coast). Right after launch at 2030 UTC, the peak 3.9 µm infrared brightness temperature sensed by GOES-16 quickly increased from 51.2ºC in the 2030 image (GOES-16 scanned that feature at 20:30:57 UTC) to 60.8ºC in the 2031 UTC image (GOES-16 scanned that feature at 20:31:55 UTC).

Another animation of Rocket Plume RGB images — created using Geo2Grid — is shown below.

GOES-16 Rocket Plume RGB images (credit: Tim Schmit, NOAA/NESDIS/ASPB) [click to play MP4 animation]

16-panel images showing all GOES-16 ABI spectral bands (below) provided another method of tracking the rocket’s condensation plume cloud southeastward motion in all 16 bands.

16-panel images of all GOES-16 ABI spectral bands [click to play animated GIF | MP4]

GOES-16 “Red” Visible (0.64 µm) images from the CSPP GeoSphere site (below) provided a closer view of the rocket’s condensation plume — its deformation in time offshore was due to changes in wind direction and/or wind speed with height. 

GOES-16 “Red” Visible (0.64 µm) images [click to play MP4 animation]

View only this post Read Less