
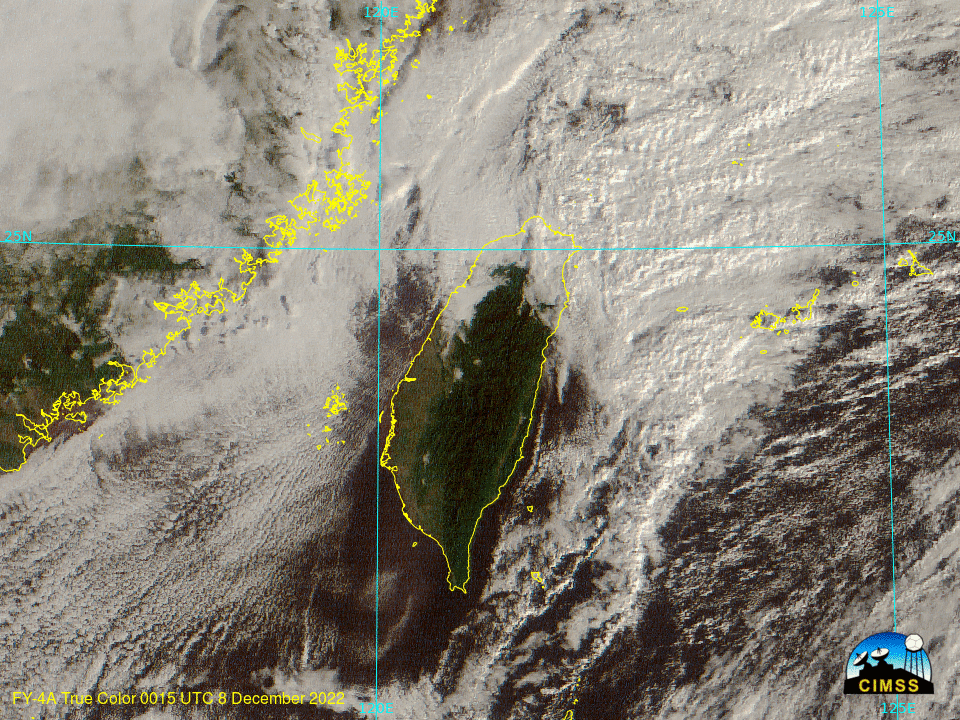
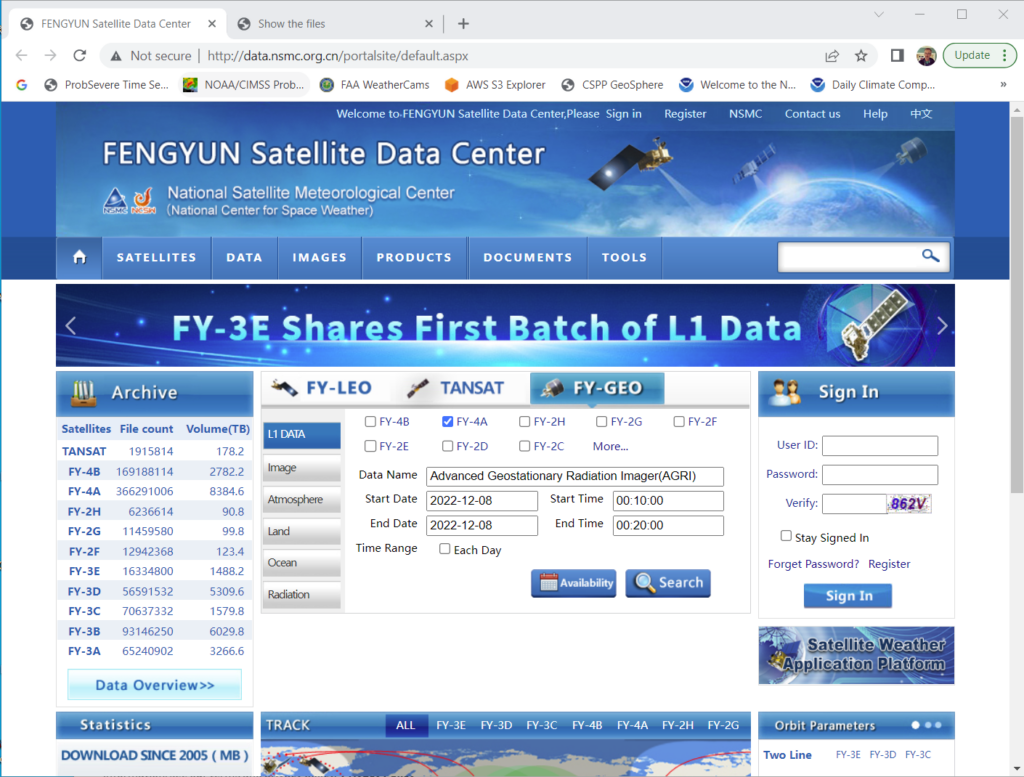
[Added, 14 December: geo2grid v 1.1 is now available at this link!] The true color animation toggle above, over Taiwan, shows True-Color imagery over Taiwan shortly after 0000 UTC on 8 December using FY4A and Himawari-9 data; readers for data from those satellites are included in version 1.1 of geo2grid. Data from Himawari-9 (HSD level 1b files) are supplied courtesy of JMA, the Japan Meteorological Agency. FY4A data from CMA are available at this link (free registration is required to download the data). At that site (shown below), you can choose AGRI data from FY4A, and the download link is available on a separate page that becomes available after choosing the day and time. (In the screen capture, the 500-m resolution checked is only Channel 2, whereas the file used for this blog post is the topmost one — with a size of 355 Mbytes; this file took some time to download).
First, you can user –list-products to determine what can be created from the hdf file:
$GEO2GRID_HOME/bin/geo2grid.sh -r agri_fy4a_l1 -w geotiff --list-products -f /data-hdd/AGRI/FY4A-_AGRI--_N_DISK_1047E_L1-_FDI-_MULT_NOM_20221208001500_20221208002959_1000M_V0001.HDFThe output showed the following possibilities: C01, C02, C03, true_color. This WMO website ( https://space.oscar.wmo.int/instruments/view/agri ) shows that C01-C03 on the AGRI instrument correspond to wavelengths of 0.47 µm, 0.65 µm and 0.83 µm. Two commands are run as shown below; the first one creates a small mapped region (a similar restriction to how much data to process could be achieved using the –ll-box keyword in geo2grid), the second creates the image over that domain:
$GEO2GRID_HOME/bin//p2g_grid_helper.sh Taiwan 121.0 24.0 1000 -1000 960 720 > $GEO2GRID_HOME/Taiwan.yaml

$GEO2GRID_HOME/bin/geo2grid.sh -r agri_fy4a_l1 -w geotiff -p true_color --grids Taiwan --grid-configs $GEO2GRID_HOME/Taiwan.yaml -f /data-hdd/AGRI/FY4A-_AGRI--_N_DISK_1047E_L1-_FDI-_MULT_NOM_20221208001500_20221208002959_1000M_V0001.HDF
The geo2grid.sh invocation here does not have access to all the information that is needed, and the output notes that solar zenith angle correction in the true color will not occur.
INFO     : Sorting and reading input files...
INFO     : Loading product metadata from files...
WARNING  : Required file type 'agri_l1_4000m_geo' not found or loaded for 'satellite_azimuth_angle'
WARNING  : Required file type 'agri_l1_4000m_geo' not found or loaded for 'solar_zenith_angle'
WARNING  : Required file type 'agri_l1_4000m_geo' not found or loaded for 'solar_azimuth_angle'
WARNING  : Required file type 'agri_l1_4000m_geo' not found or loaded for 'satellite_zenith_angle'
INFO     : Checking products for sufficient output grid coverage (grid: 'Taiwan')...
INFO     : Resampling to 'Taiwan' using 'nearest' resampling...
INFO     : Computing products and saving data to writers...
INFO     : SUCCESS
The invocation of geo2grid to read the Himawari data (that does include information for the solar zenith angle correction) and the output from that call is shown below.
$GEO2GRID_HOME/bin/geo2grid.sh -r ahi_hsd -w geotiff -p true_color --grids Taiwan --grid-configs $GEO2GRID_HOME/Taiwan.yaml -f /path/to/data/himawari09/2022/2022_12_08_342/0020/*FLDK*.DAT
INFO     : Sorting and reading input files...
INFO     : Loading product metadata from files...
INFO     : Checking products for sufficient output grid coverage (grid: 'Taiwan')...
INFO     : Resampling to 'Taiwan' using 'nearest' resampling...
INFO     : Computing products and saving data to writers...
INFO     : SUCCESS
You will note a slight shift in the imagery in the toggle above, suggesting different navigations for the two satellites.
View only this post Read Less


