1-minute Mesoscale Domain Sector GOES-18 (GOES-West) “Red” Visible (0.64 µm) images (above) showed the development of thunderstorms across much of the eastern portion of Interior Alaska on 24 July 2023. The large satellite viewing angle — which is 73.5 degrees for Fairbanks (station identifier PAFA) — provided an oblique perspective that nicely displayed the vertical buildup... Read More

GOES-18 “Red” Visible (0.64 µm) images [click to play animated GIF | MP4]
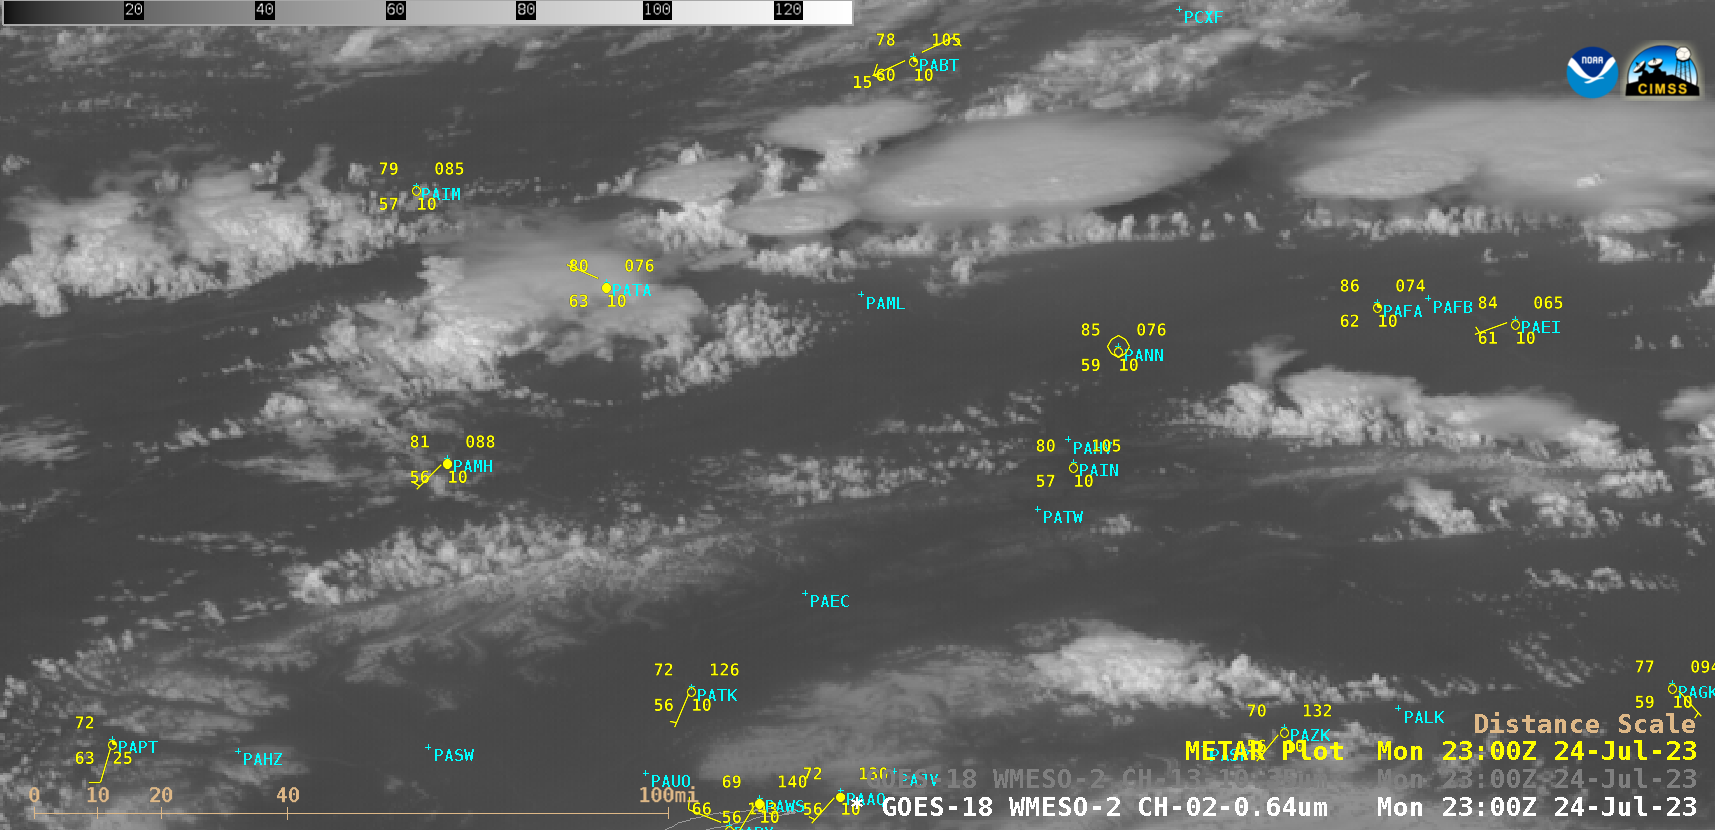
1-minute Mesoscale Domain Sector GOES-18 (GOES-West) “Red” Visible (0.64 µm) images (above) showed the development of thunderstorms across much of the eastern portion of Interior Alaska on 24 July 2023. The large satellite viewing angle — which is 73.5 degrees for Fairbanks (station identifier PAFA) — provided an oblique perspective that nicely displayed the vertical buildup of towering cumulus as well as the formation of thunderstorm anvils.
In the corresponding 1-minute GOES-18 “Clean” Infrared Window (10.3 µm) images (below), the coldest thunderstorm tops exhibited infrared brightness temperatures around -60ºC (darker shades of red).
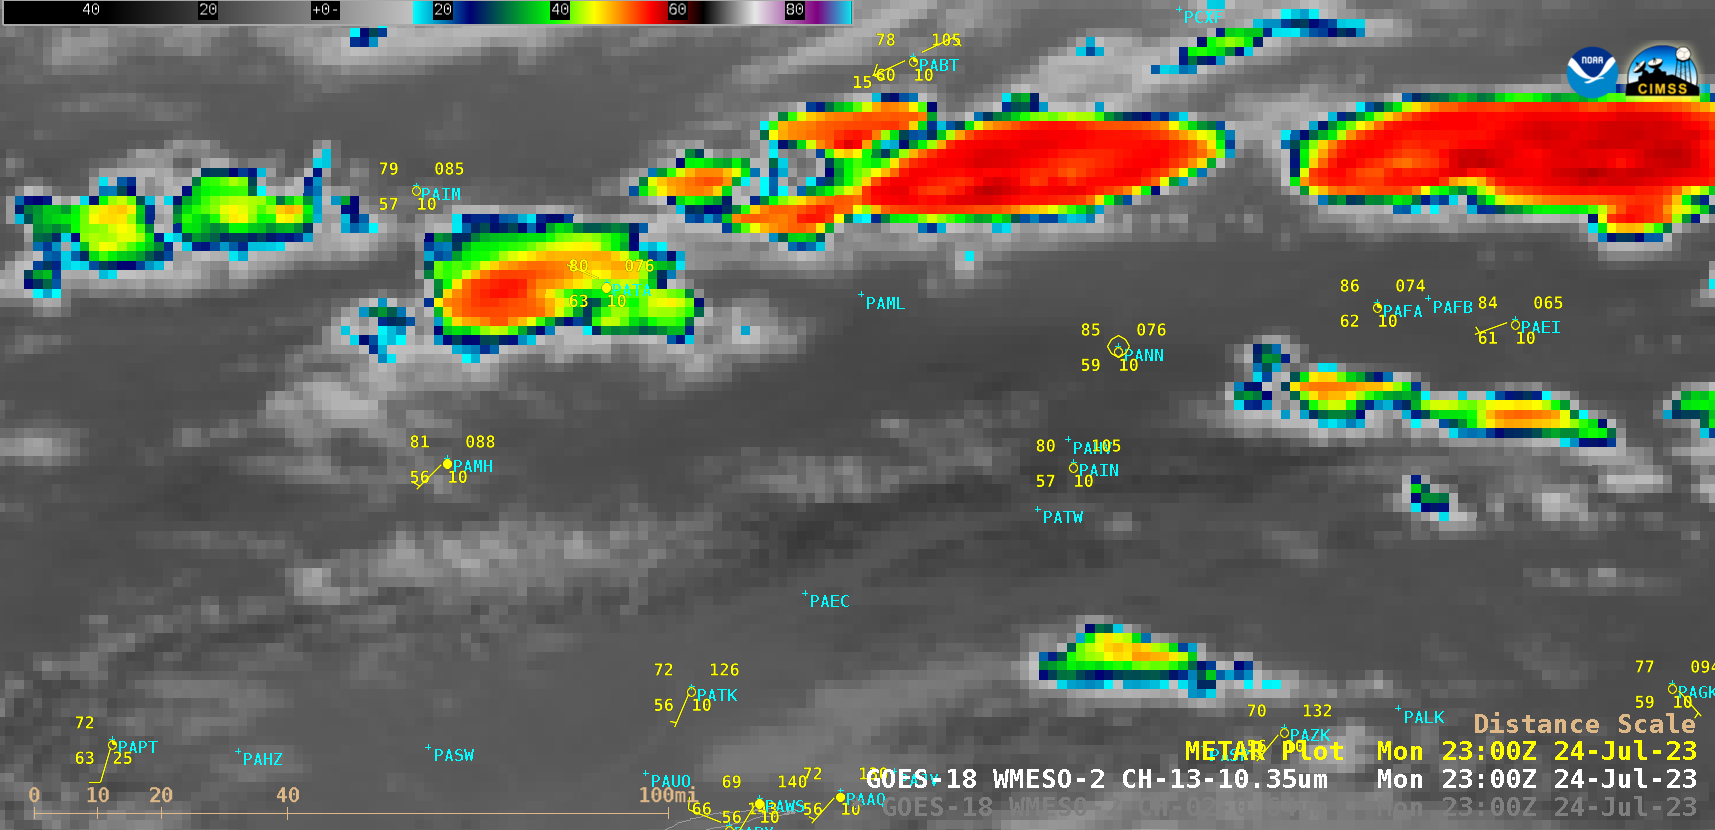
GOES-18 “Clean” Infrared Window (10.3 µm) images [click to play animated GIF | MP4]
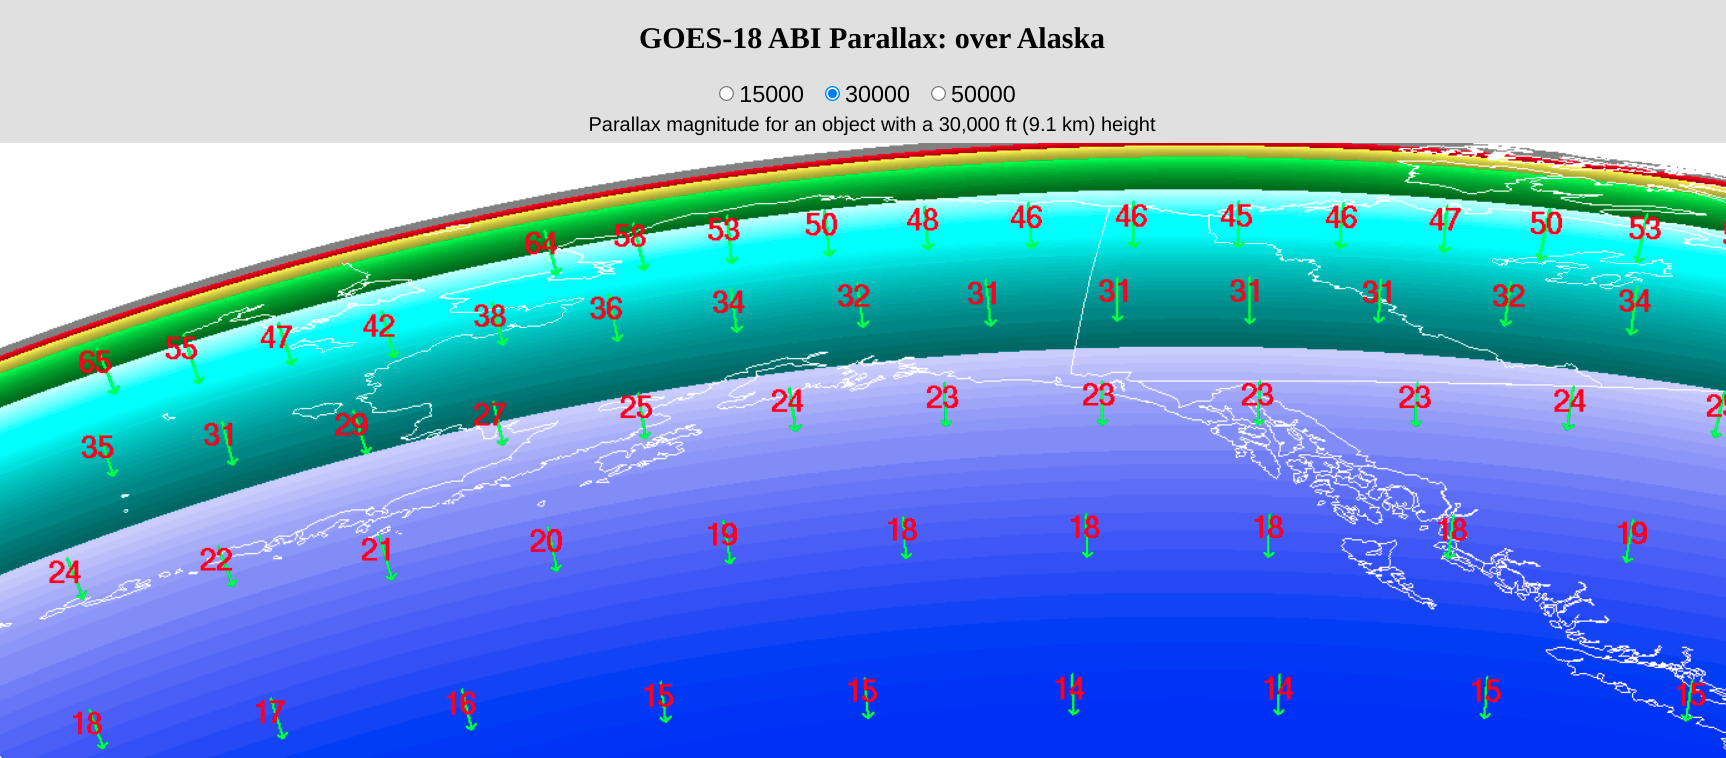
Parallax displacement direction (green arrows) and displacement magnitude (in km, red) for a 30000-ft cloud top feature on GOES-18 imagery [click to enlarge]
When viewing satellite imagery at high latitudes, it is important to keep parallax in mind — so for the thunderstorms that produced wind damage east-southeast and southeast of Fairbanks at 0315 UTC and 0330 UTC, their cloud tops (at an average altitude around 30000 ft) were actually displayed about 32 km (20 miles) to the north-northwest of their true location over the surface (above).
The parallax displacement was apparent in a closer view of 1-minue GOES-18 Visible and Infrared images, centered near Fairbanks, with plots of Severe Thunderstorm Warning polygons (below).

GOES-18 “Red” Visible (0.64 µm) and “Clean” Infrared Window (10.3 µm) images, with Severe Thunderstorm Warning polygons plotted in yellow [click to play animated GIF | MP4]
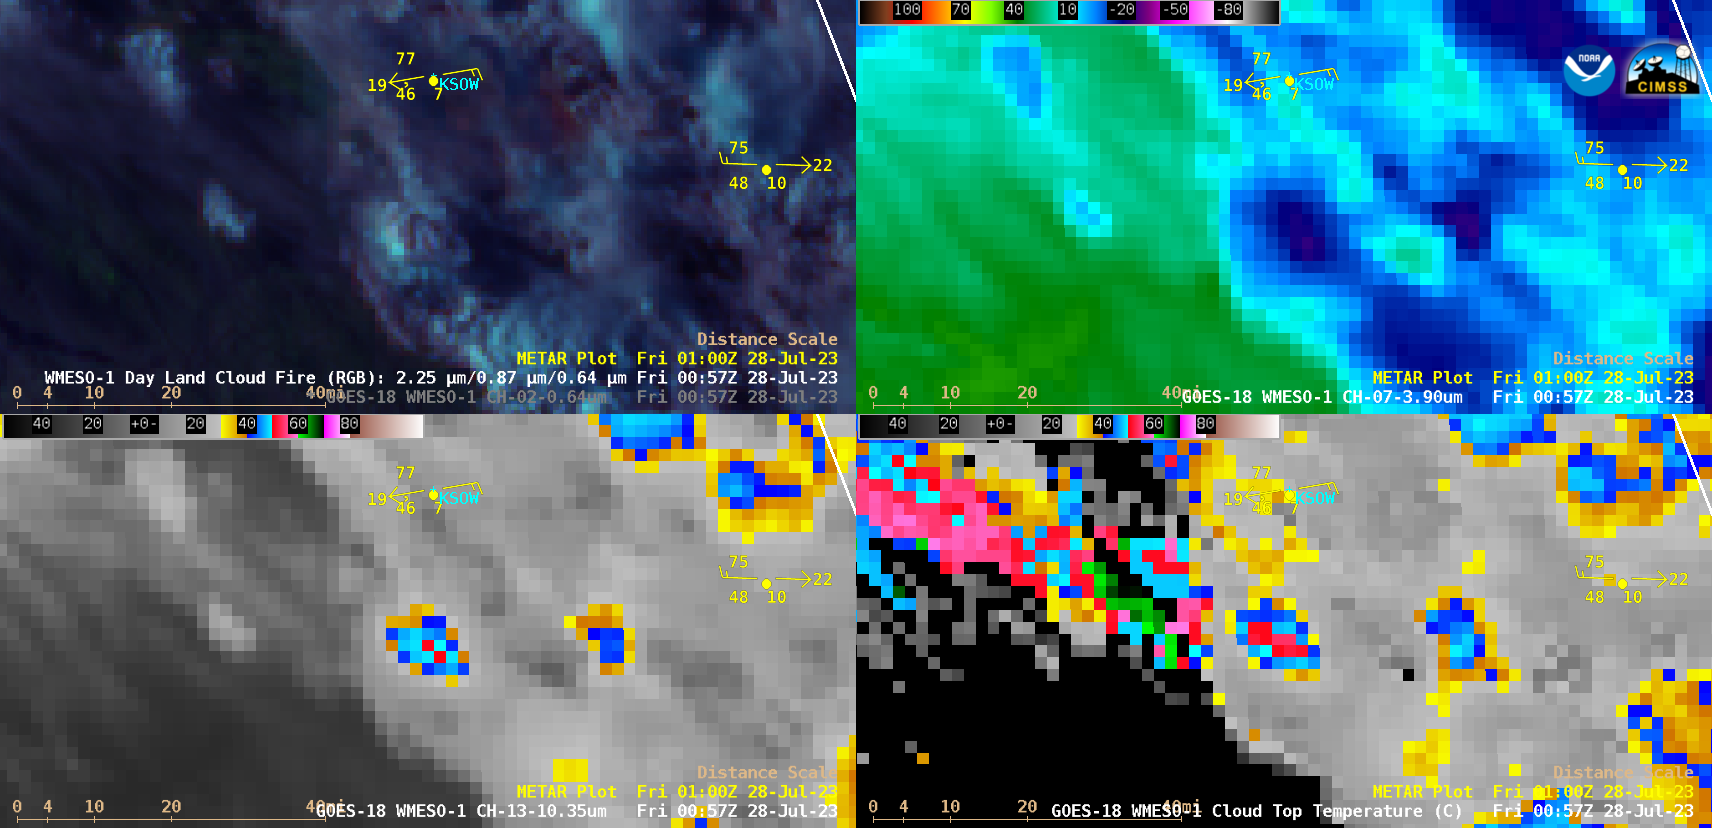
Pulses of overshooting tops were evident with many of these thunderstorms, such as one seen just northeast of Eielson Air Force Base (PAEI) in a toggle between GOES-18 Visible and Infrared images at 0244 UTC (below) — which was about 30 minutes prior to the first report of damaging winds 15 miles ESE of Fairbanks.

GOES-18 “Red” Visible (0.64 µm) and “Clean” Infrared Window (10.3 µm) images at 0244 UTC on 25 July [click to enlarge]
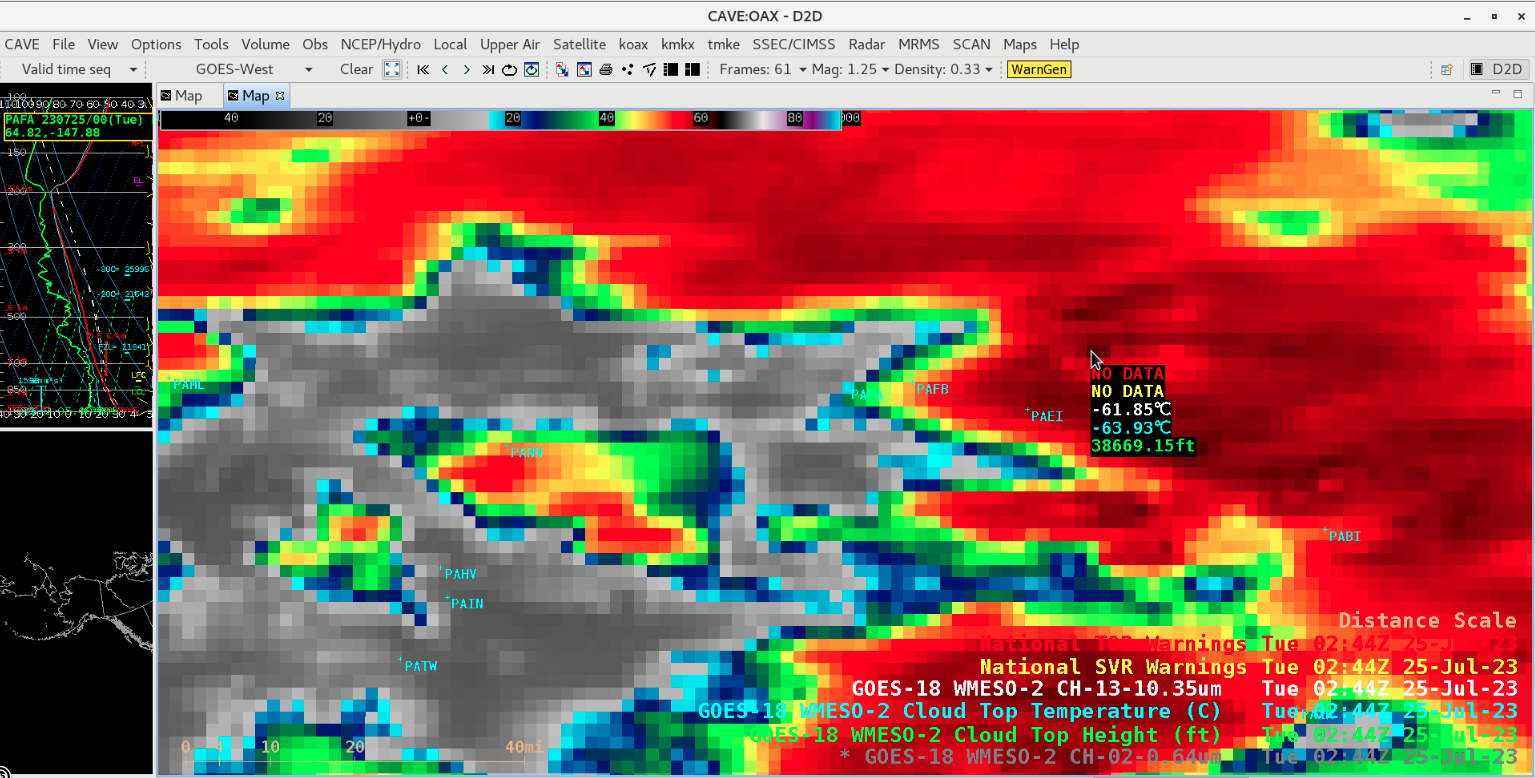
Cursor-sampled values of GOES-18 infrared (10.3 µm) brightness temperature (white), Cloud Top Temperature (cyan) and Cloud Top Height (green) for a thunderstorm overshooting top at 0244 UTC on 25 July [click to enlarge]
For the overshooting top northeast of PAEI at 0244 UTC, cursor-sampled values of GOES-18 infrared (10.3 µm) brightness temperature, Cloud Top Temperature and Cloud Top Height were -61.85ºC, -63.93ºC and 38669.15 feet, respectively (above) — which, according to a plot of 0000 UTC rawinsonde data from Fairbanks (below), represented an altitude just above the Equilibrium Level (EL) of a Most Unstable (MU) air parcel.
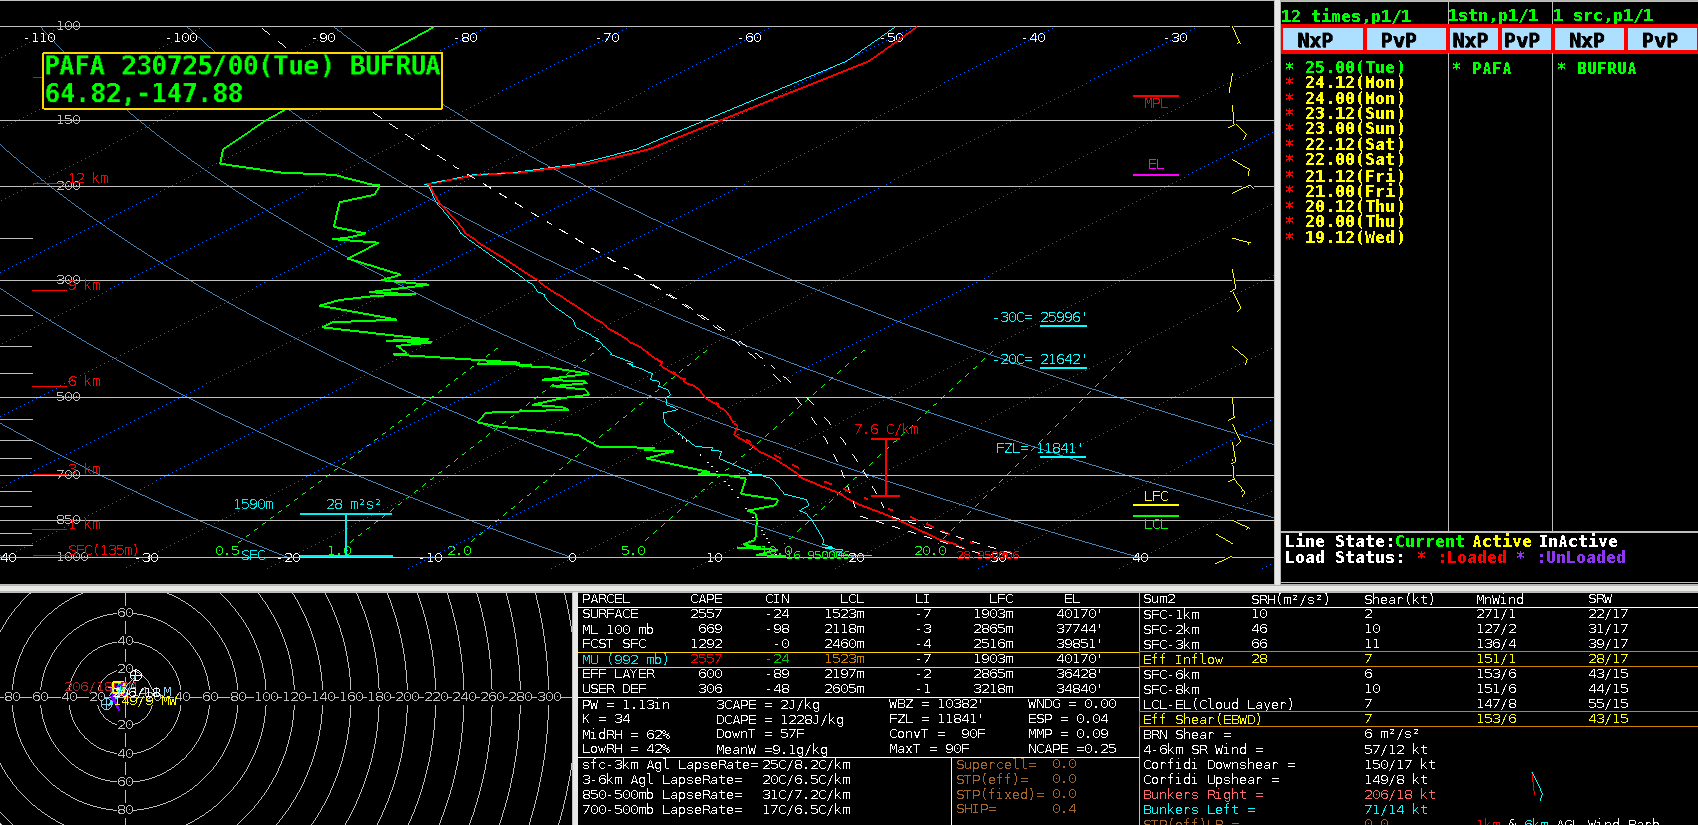
Plot of rawinsonde data from Fairbanks, Alaska at 0000 UTC on 25 July [click to enlarge]
These thunderstorms occurred on a day that Fairbanks set a new daily record high temperature of 90ºF — and a Cooperative Observer in the Fairbanks area reported a high temperature of 92ºF (Regional Temperarture and Precipitation).
View only this post
Read Less


