Train derailment and fire in East Palestine, Ohio
GOES-16 Shortwave Infrared (3.9 µm) images, with railroads plotted in violet [click to play animated GIF | MP4]
===== 06 February Update =====
GOES-16 “Red” Visible (0.64 µm, top left), Shortwave Infrared (3.9 µm, top right), Cloud Top Phase (bottom left) and “Clean” Infrared Window (10.3 µm) / Cloud Top Temperature / Cloud Top Height (bottom right); railroads are plotted in violet [click to play animated GIF | MP4]
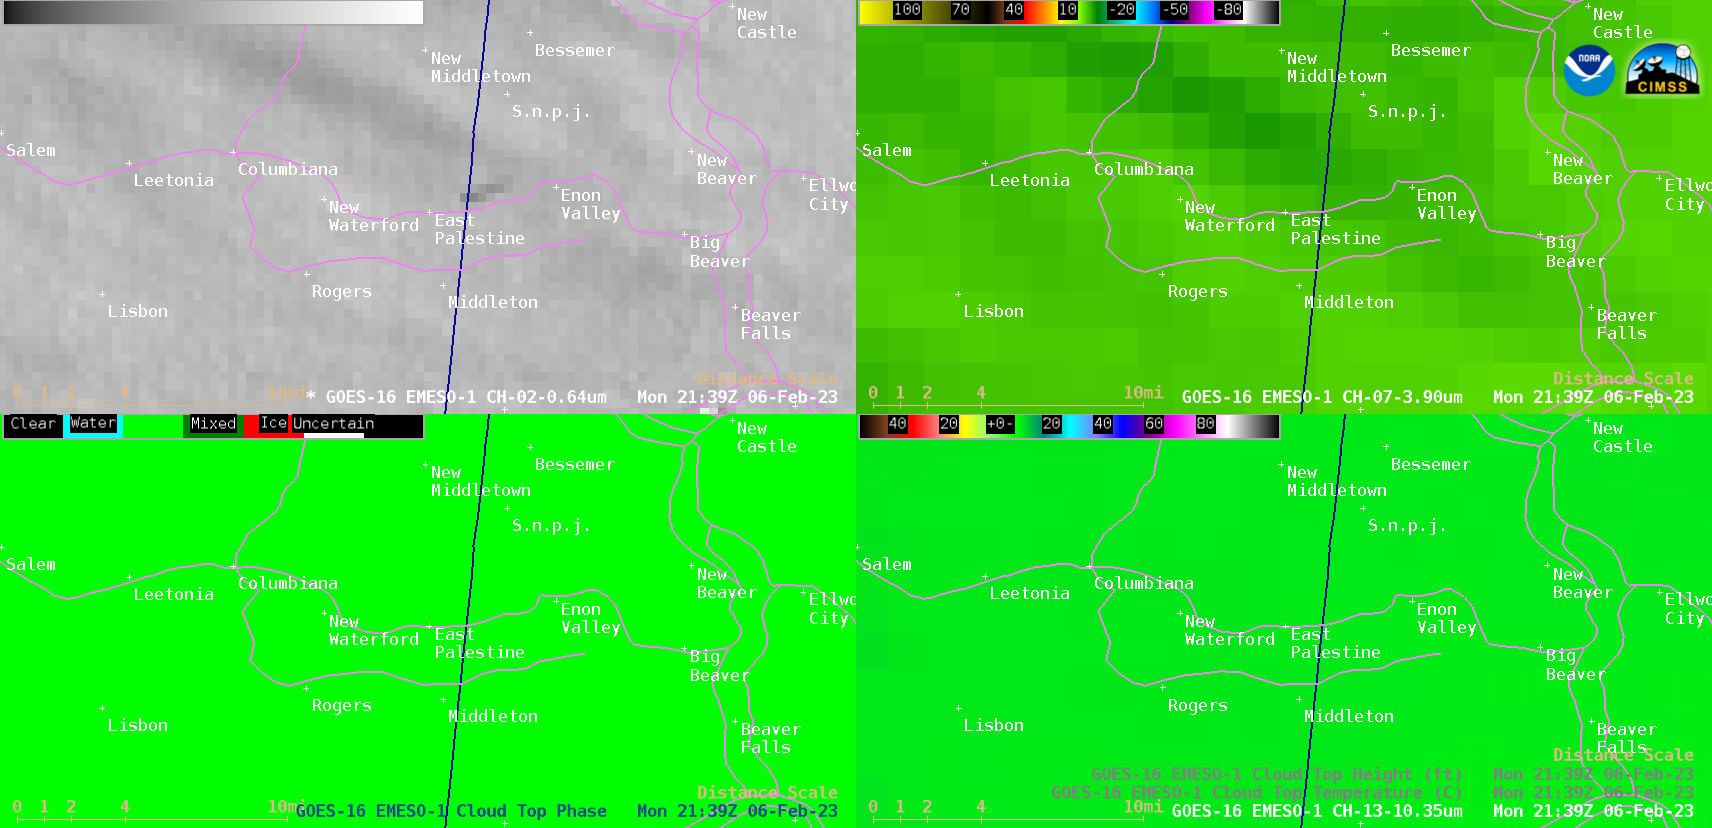
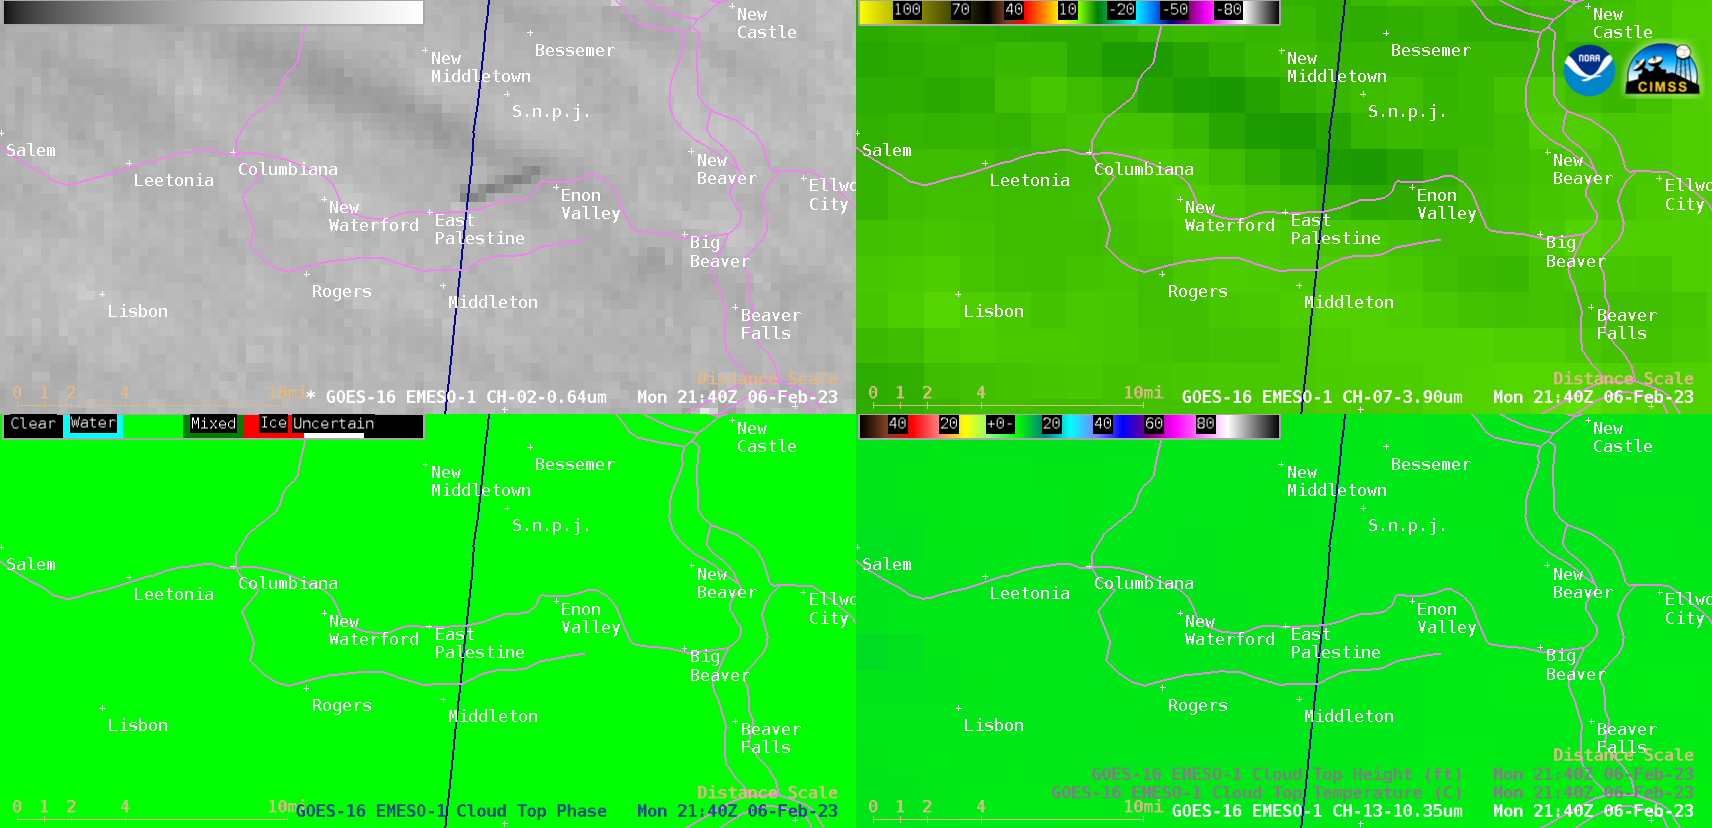
The black smoke cloud seen in Visible imagery also exhibited a signature in Dust RGB and Split Cloud Top Phase brightness temperature difference imagery (below) — which both leverage the 8.5 µm spectral band that is sensitive to differences in emissivity (in this case, the emissivity of the smoke particles differed from that of the supercooled water droplets along the top of the surrounding stratus cloud layer) .

GOES-16 “Red” Visible (0.64 µm) / Dust RGB / Split Cloud Top Phase brightness temperature difference (top left), Shortwave Infrared (3.9 µm, top right), Cloud Top Phase (bottom left) and “Clean” Infrared Window (10.3 µm, bottom right); railroads are plotted in violet [click to play animated GIF |MP4]
Plot of rawinsonde data from Pittsburgh, Pennsylvania at 00 UTC on 07 February [click to enlarge]
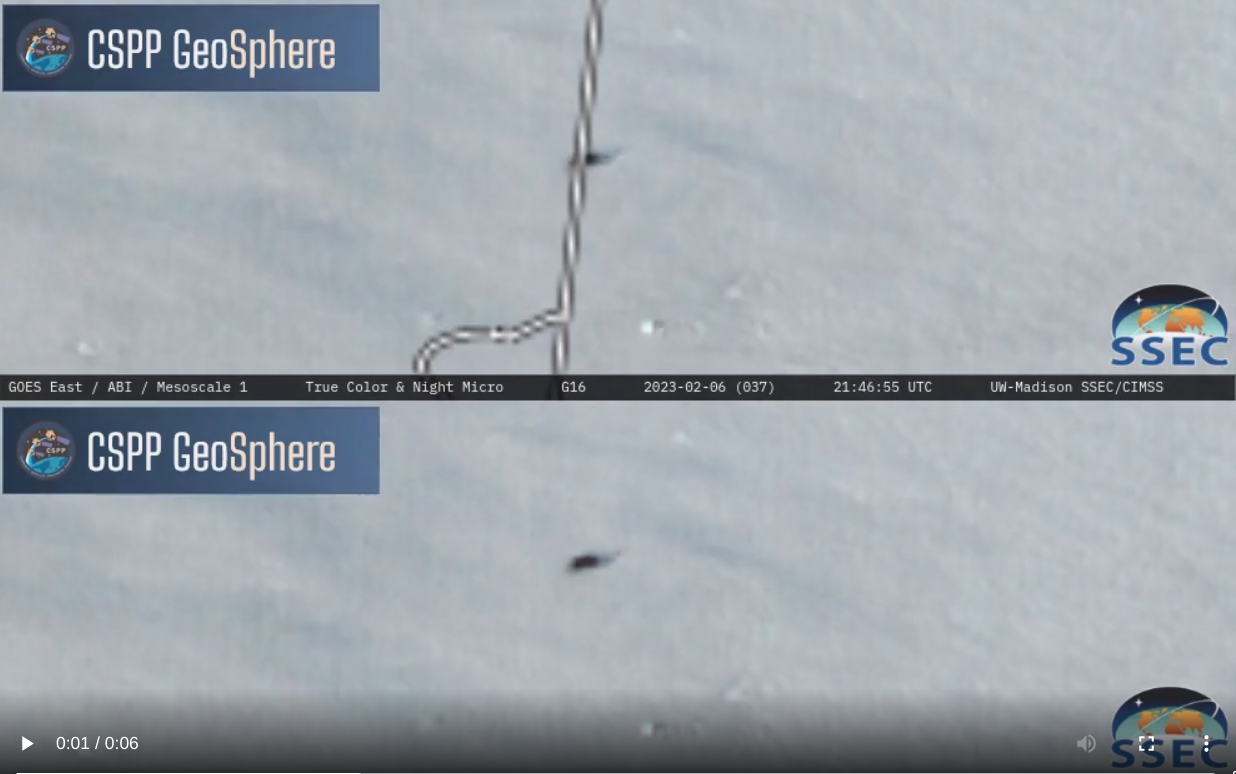
GOES-16 True Color RGB images, with and without a map overlay [click to play MP4 animation]