Ice storm across the Southern Plains and Mid-South

GOES-16 “Red” Visible (0.64 µm) and Day Snow-Fog RGB images [click to play animated GIF | MP4]
The Day Snow-Fog RGB imagery is more useful here, because it leverages the 1.61 µm “Snow/Ice” spectral band. As seen in a plot of ABI Spectral Response Functions (below), snow and ice are efficient absorbers of radiation (and therefore exhibit a low reflectance) at the 1.61 µm wavelength — making those features appear as shades of red in the RGB images (and since ice absorbs even more strongly than snow, ice appears as the darkest shades of red).
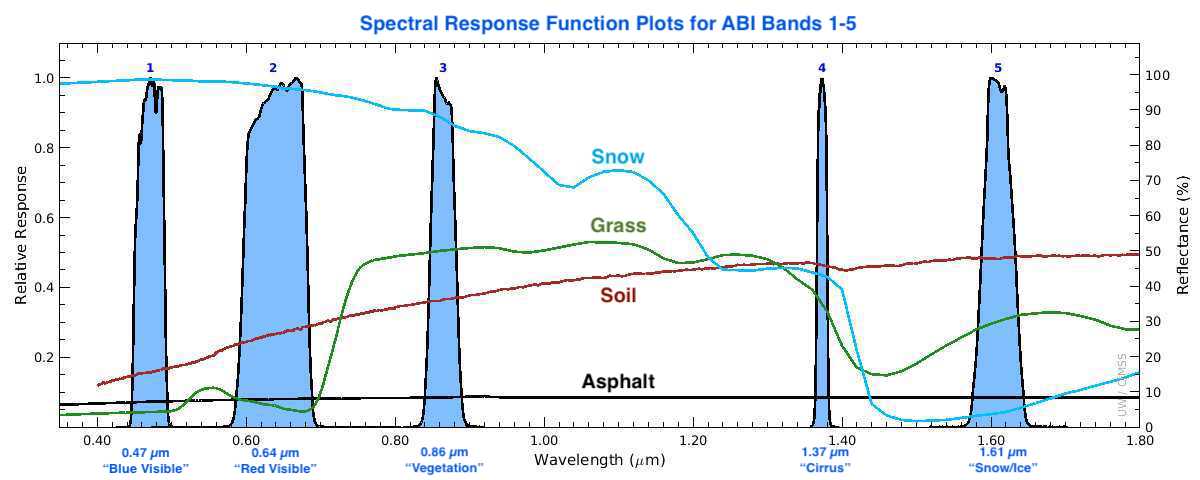
Plots of Spectral Response Function for ABI Bands 1-5 (credit: Mat Gunshor, CIMSS) [click to enlarge]
GOES-16 “Red” Visible (0.64 µm) and Day Snow-Fog RGB images at 1616 UTC [click to enlarge]

NOAA-20 VIIRS Visible (0.64 µm) and Near-Infrared “Snow/Ice” (1.61 µm) images vaid at at 1831 UTC [click to enlarge]