Polar2Grid is a powerful software package that enables a user to take Sensor Data Record (SDR) files from JPSS satellites (Suomi-NPP, NOAA-20, NOAA-21) and create high-quality georeferenced imagery that can be color-enhanced. (Polar2Grid also works with data from other polar orbiting satellites!) This blog post details how to scale an infrared image to specific brightness temperature bounds that are then shown with a colorbar embedded into the image. This is similar to what is done with ACSPO Sea Surface Temperatures as discussed in this online documentation. Data for this example were downloaded from the CIMSS Direct Broadcast site. I wanted to show I05 VIIRS imagery (11.45 µm) so I downloaded both the SVI05 and GIMGO hdf files on 16 August 2023 covering the times 0832 and 0840 UTC. These data, from NOAA-21, can came from the directory https://bin.ssec.wisc.edu/pub/eosdb/j02/viirs/2023_08_16_228_0828/sdr/ (this directory will be purged on 8/23). You can also get these data from NOAA CLASS, or from online web services such as Amazon Web Services (AWS link for NOAA-21). Before invoking the Polar2Grid commands to create the imagery, you must specify the I05 Brightness Temperatures of interest, done by adding the following snippet of code to the viirs.yaml file that can be found in this directory: $POLAR2GRID_HOME/etc/polar2grid/enhancements/ In the case below, I’m interested initially just in the values between 170 and 330 Kelvin, using a linear stretch.
 I05:
    name: I05
    sensor: viirs
    operations:
      - name: linear_stretch
        method: !!python/name:satpy.enhancements.stretch
        kwargs: {stretch: 'crude', min_stretch: 170., max_stretch: 330.}
Next, run the Polar2Grid commands to specify (optionally) a region of interest, and to generate the tif file of the imagery in that specified domain.
$POLAR2GRID_HOME/bin/p2g_grid_helper.sh Madison -89.0 43.8 375.0 -375.0 1280 960 > $POLAR2GRID_HOME/bin/MSN.yaml
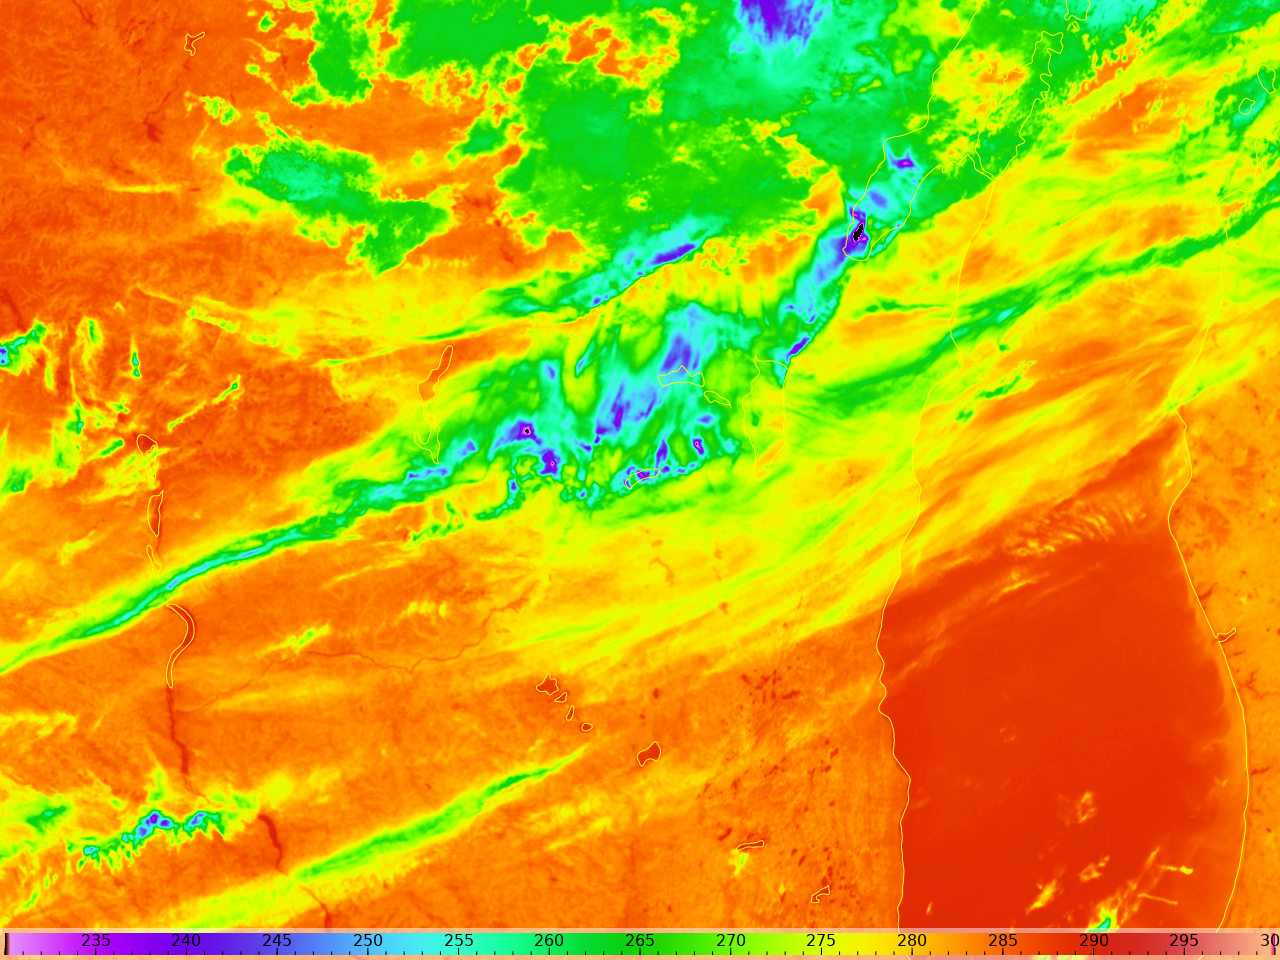
$POLAR2GRID_HOME/bin/polar2grid.sh -r viirs_sdr -w geotiff -p i05 -g Madison --grid-configs $POLAR2GRID_HOME/bin/MSN.yaml -f /path/to/downloaded/SVI05andGIMGOFiles.h5The commands above create a tif file: noaa21_viirs_i05_20230816_083259_Madison.tif. The first of the two commands below adds a color enhancement to the tif file; the second adds coastlines and a colorbar to the tif file and outputs a png file: noaa21_viirs_i05_20230816_083259_Madison.png . That image, scaled from 170 to 330 K, is shown below.
$POLAR2GRID_HOME/bin/add_colormap.sh $POLAR2GRID_HOME/colormaps/p2g_sst_palette.txt noaa21_viirs_i05_20230816_083259_Madison.tif

$POLAR2GRID_HOME/bin/add_coastlines.sh --add-coastlines --coastlines-resolution f --add-colorbar noaa21_viirs_i05_20230816_083259_Madison.tif
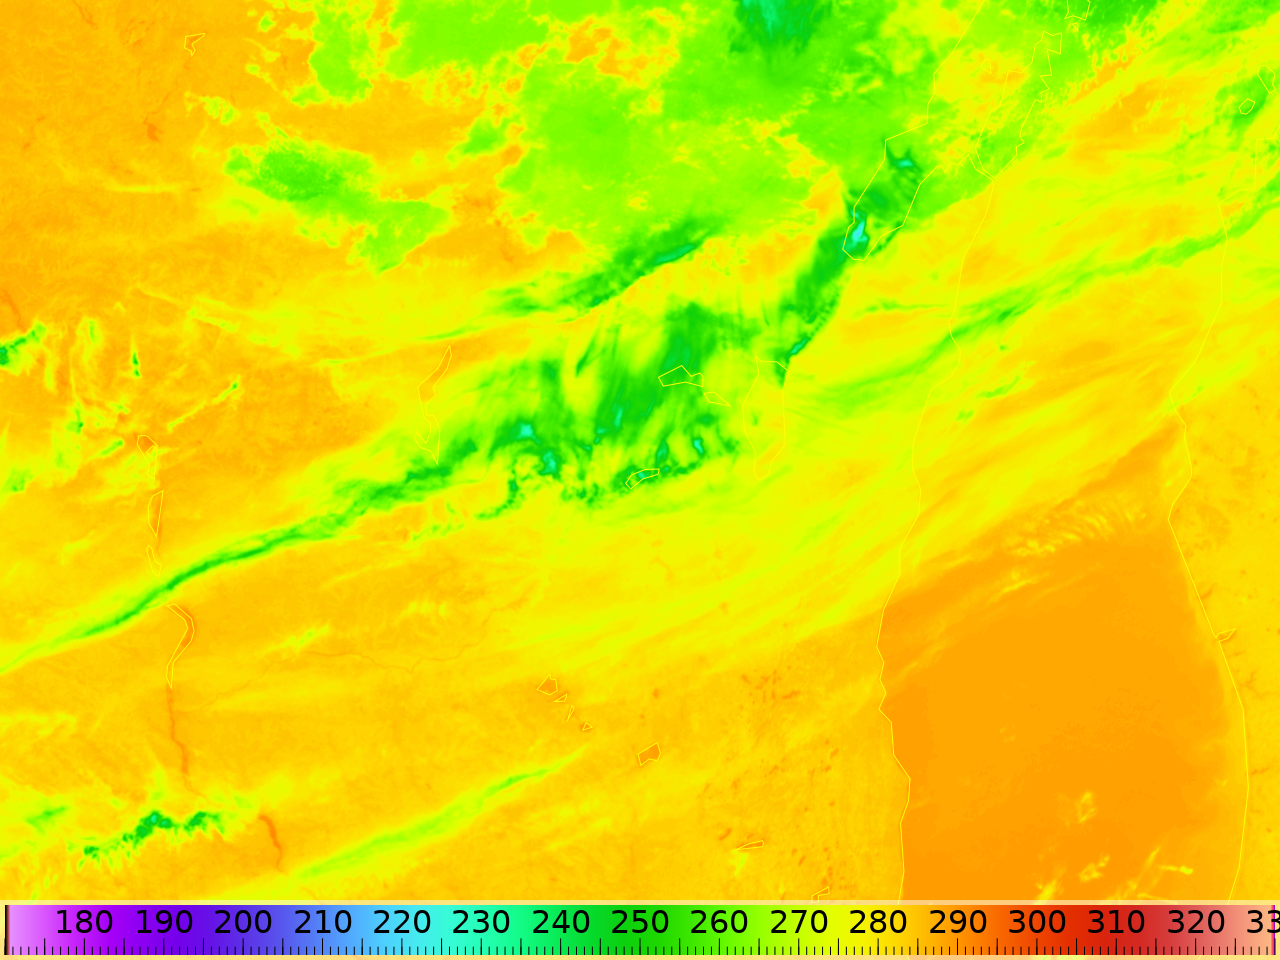
It’s apparent above that the range chosen for the image above is too broad. So, edit the I05 definition in the viirs.yaml file shown up top, changing the one line to this: kwargs: {stretch: 'crude', min_stretch: 230., max_stretch: 300.}. Then, rerun the polar2grid, add_colorbar and add_coastlines commands above. The result below shows a toggle between those two results. Note how things change as you might expect.

The image with more color contrast from cold to warm shown above is the same one as shown at the top of the image, but I’ve modified the presentation of the coastlines and colorbar in the add_coastlines command: $POLAR2GRID_HOME/bin/add_coastlines.sh --add-coastlines --coastlines-resolution f --add-colorbar --colorbar-text-size 16 --colorbar-height 32 noaa21_viirs_i05_20230816_083259_Madison.tif
Polar2Grid software can be downloaded from this website; Polar2Grid documentation is here.
View only this post Read Less


