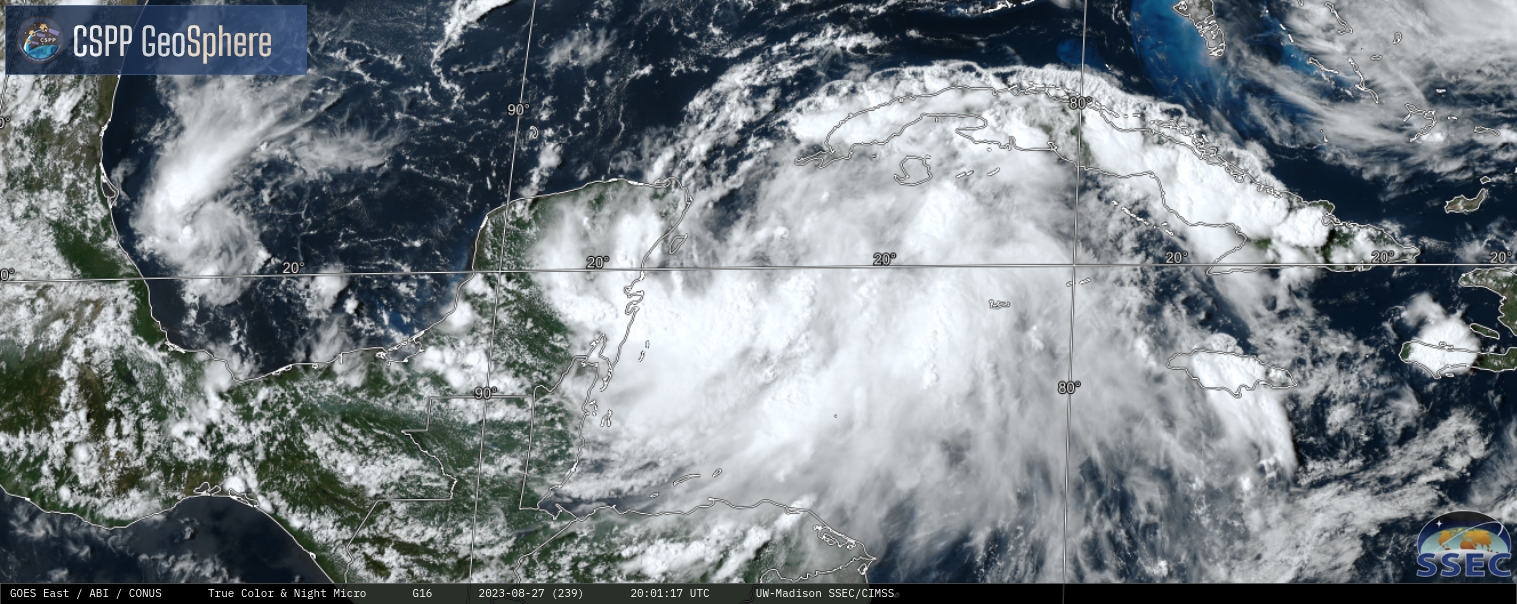
Tropical Storm Idalia has formed in the northwestern Caribbean Sea, in between Cuba and Mexico. The True-Color mp4 animation above, taken from CSPP Geosphere site (direct link to the animation), shows active convection over the Caribbean that is coalescing around the low-level circulation center (located near 20oN, 85.5oW at 2100 UTC on 27 August)
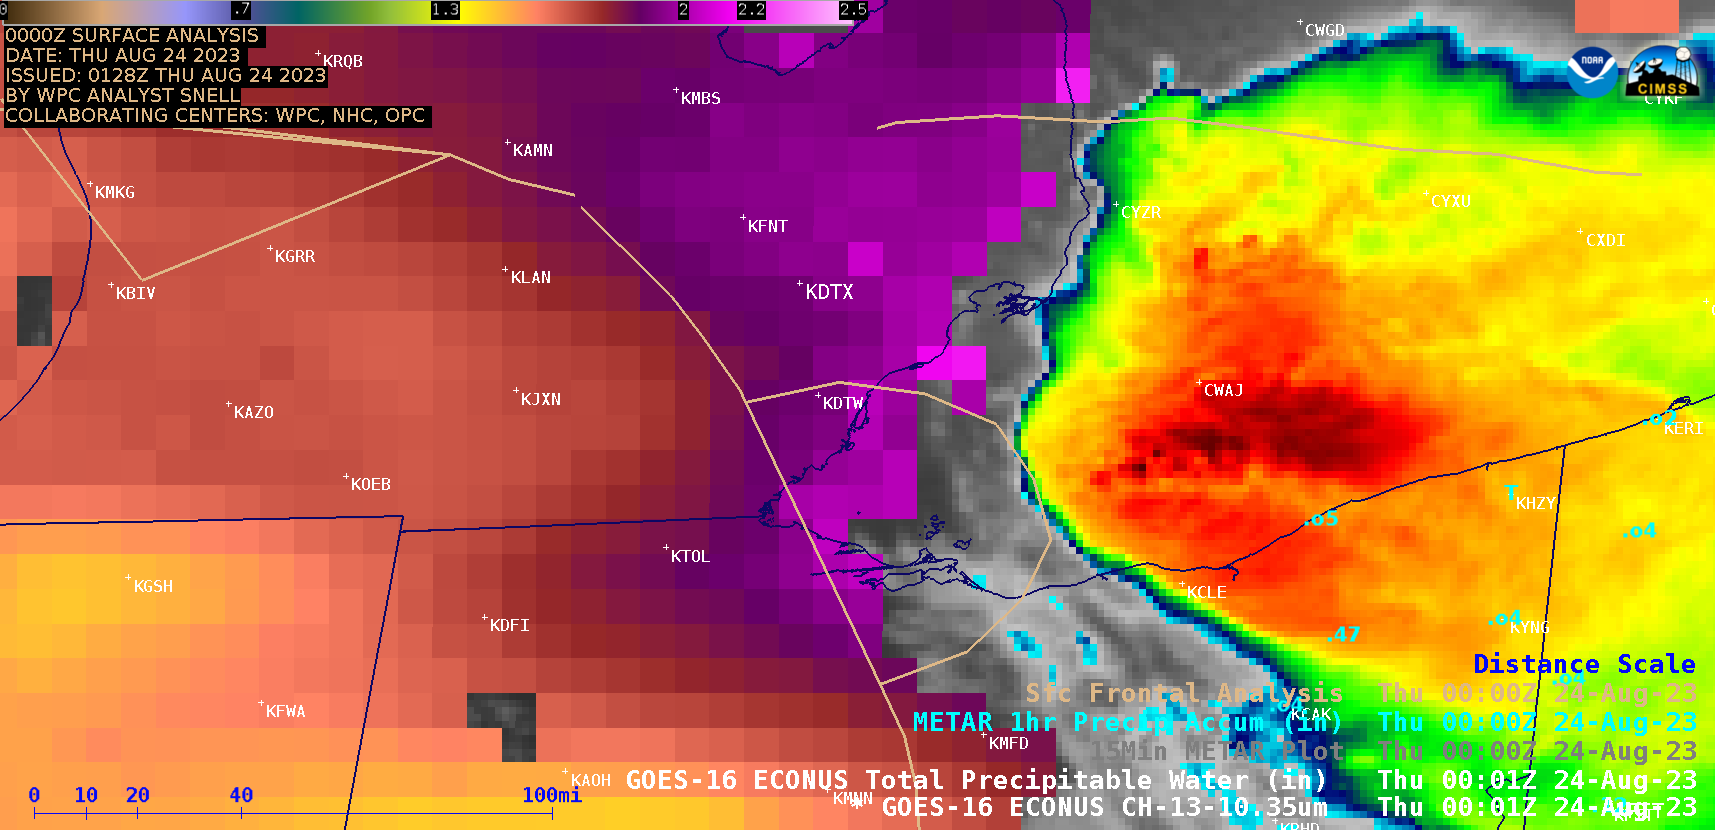
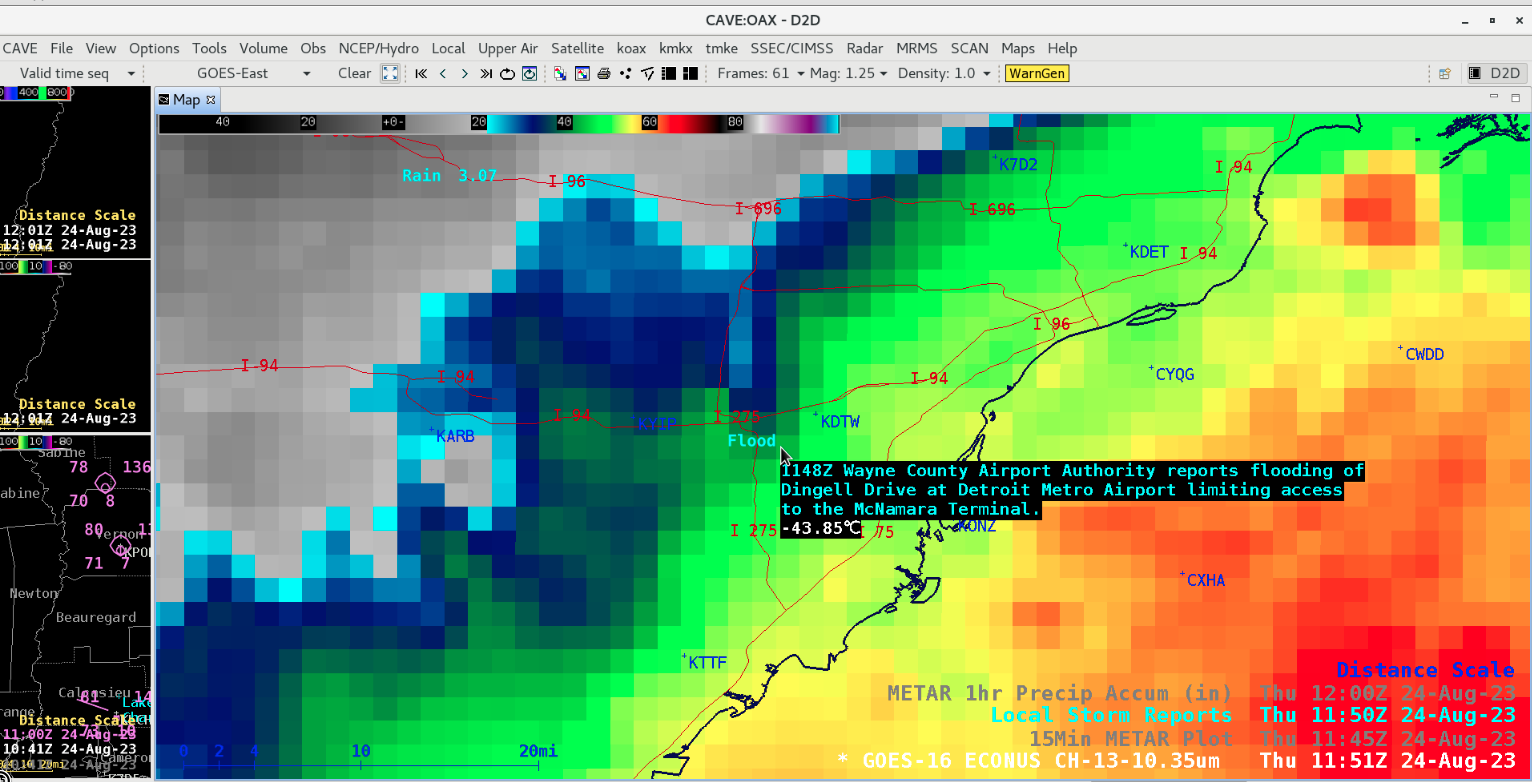
A still image from 2236 UTC on 27 August, below, shows GOES-16 Band 13 “Clean Window” infrared (10.3 µm) imagery overlain on top of the derived SSTs from 2200 UTC. Very warm water — upper 80s to low 90s degrees Fahrenheit — is diagnosed along Idalia’s forecast path in the eastern Gulf of Mexico. Band 13 Brightness Temperatures are very cold: near -80oC.

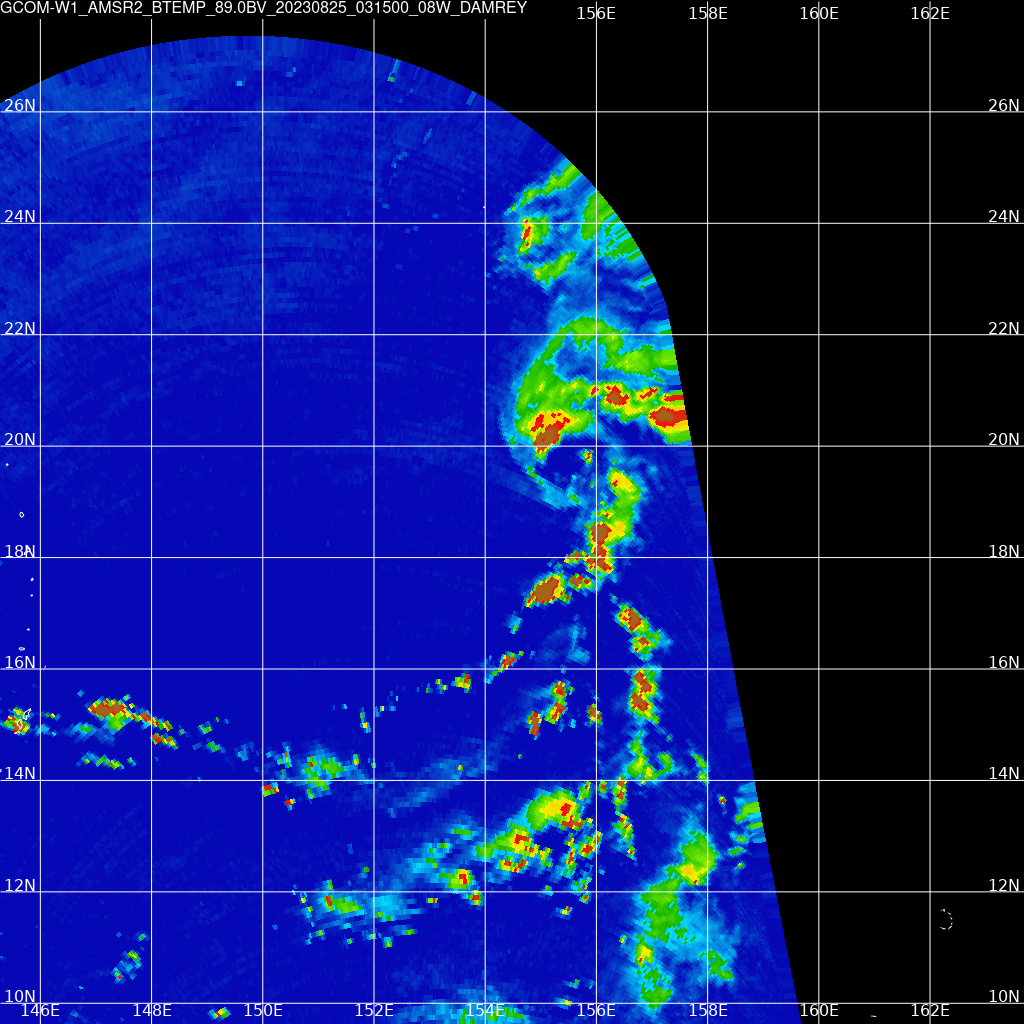
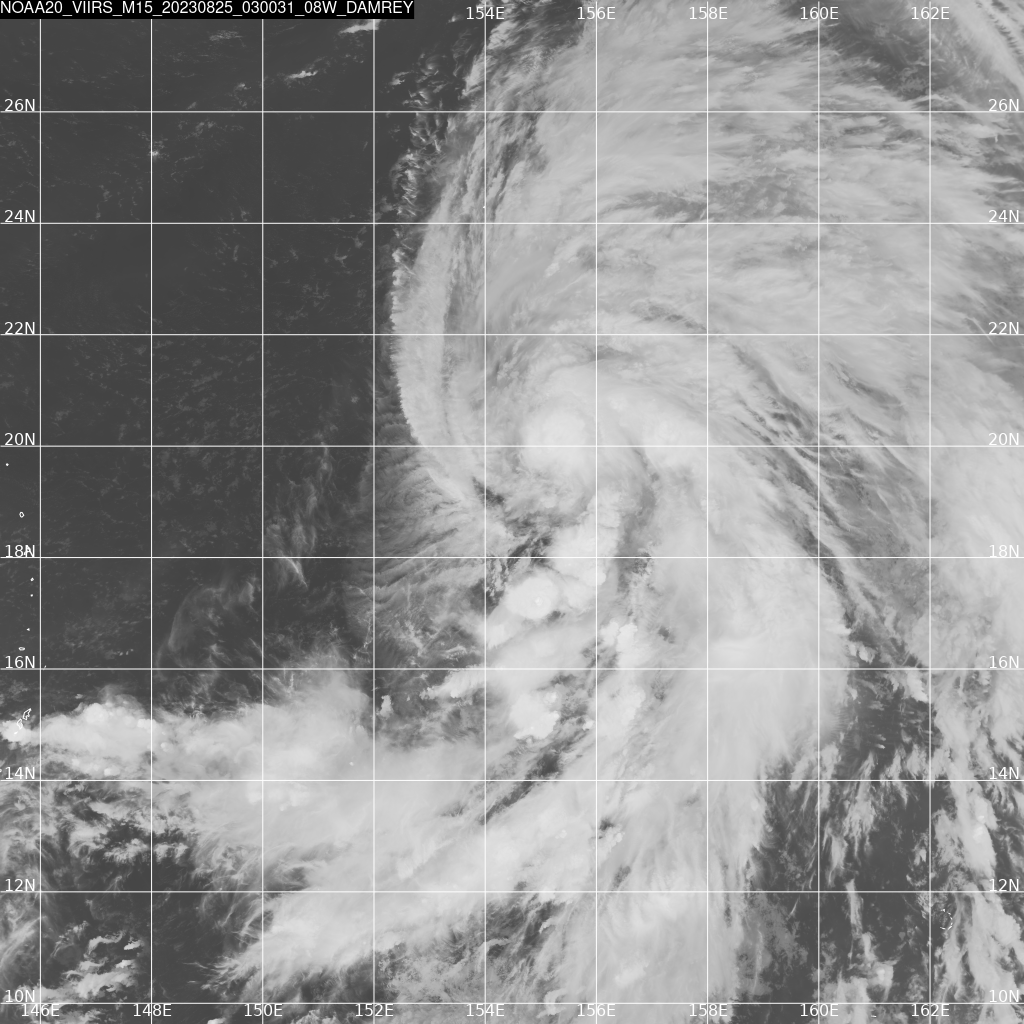
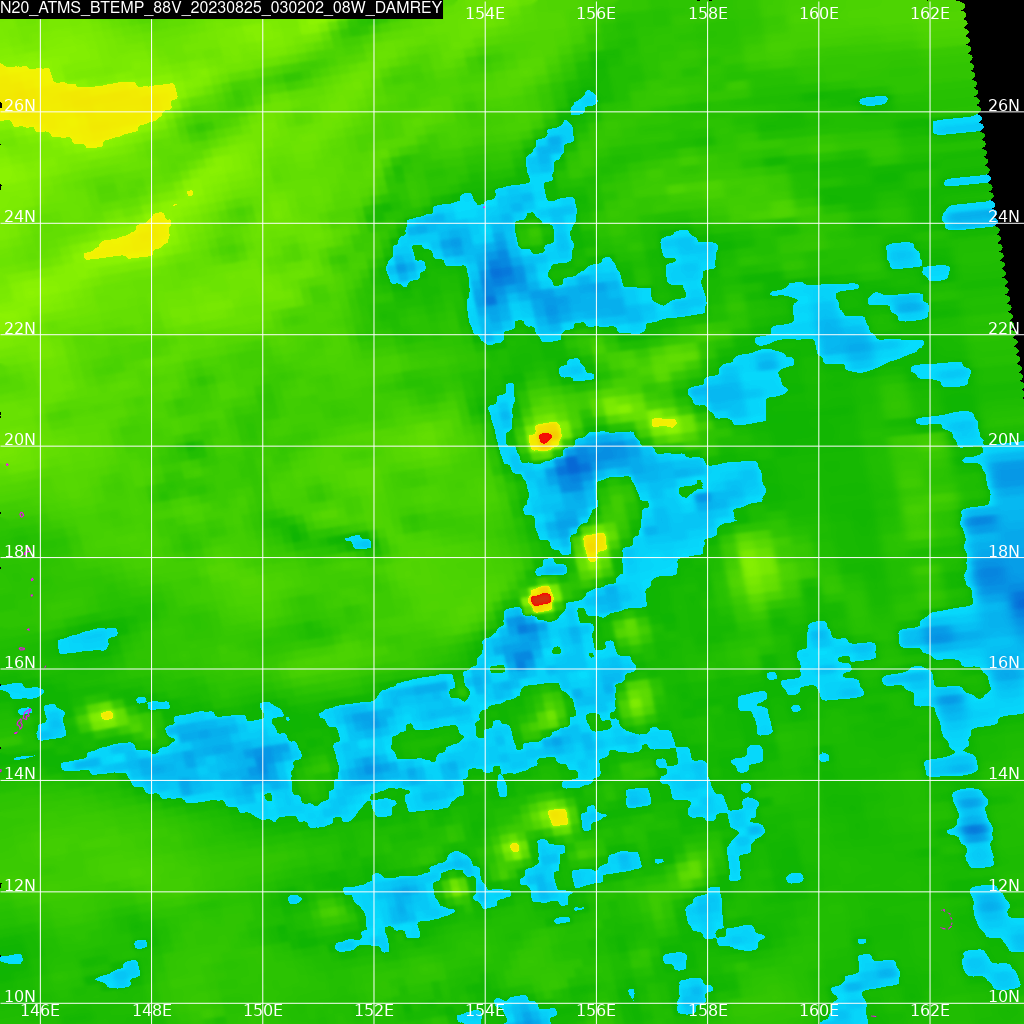
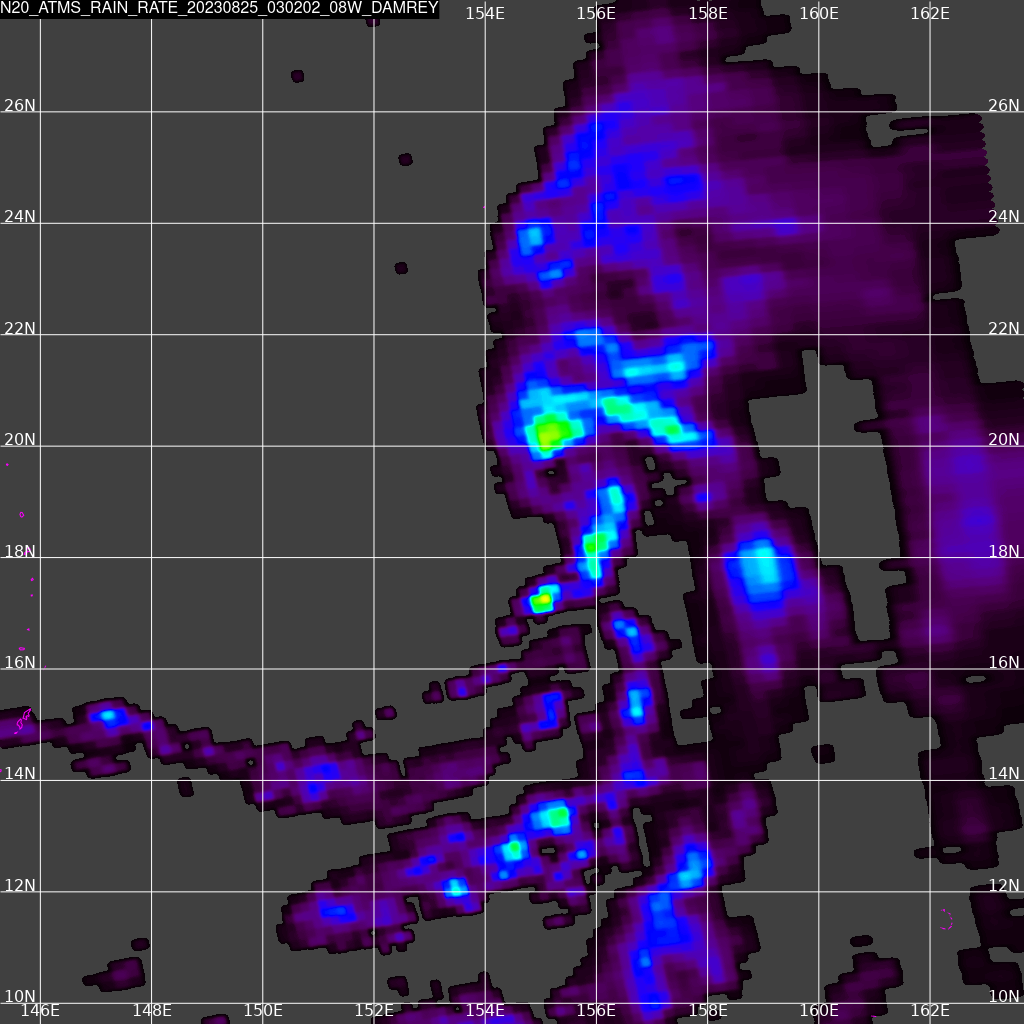
Microwave imagery from the CIMSS Tropical Website, below, show that Idalia in the afternoon of 27 August 2023 was not a poorly-organized lopsided storm. Much of the deepest convection was south of the center (as might also be inferred from the asymmetric distribution of cold cloud tops around the center in the infrared imagery above).

The toggle below shows the forecast path of Idalia into the northwestern Gulf of Mexico along with plots of Oceanic Heat Content — a measure of how deep the warm waters are — and atmospheric shear. Idalia is forecast to traverse very warm waters as shown in the SST plot above. The narrow Loop Current in the Gulf of Mexico is where the warm surface waters are least likely to be cooled by storm-induced mixing. In addition, the shear fields show Idalia moving into a less favorable shear environment. Strengthening is expected.

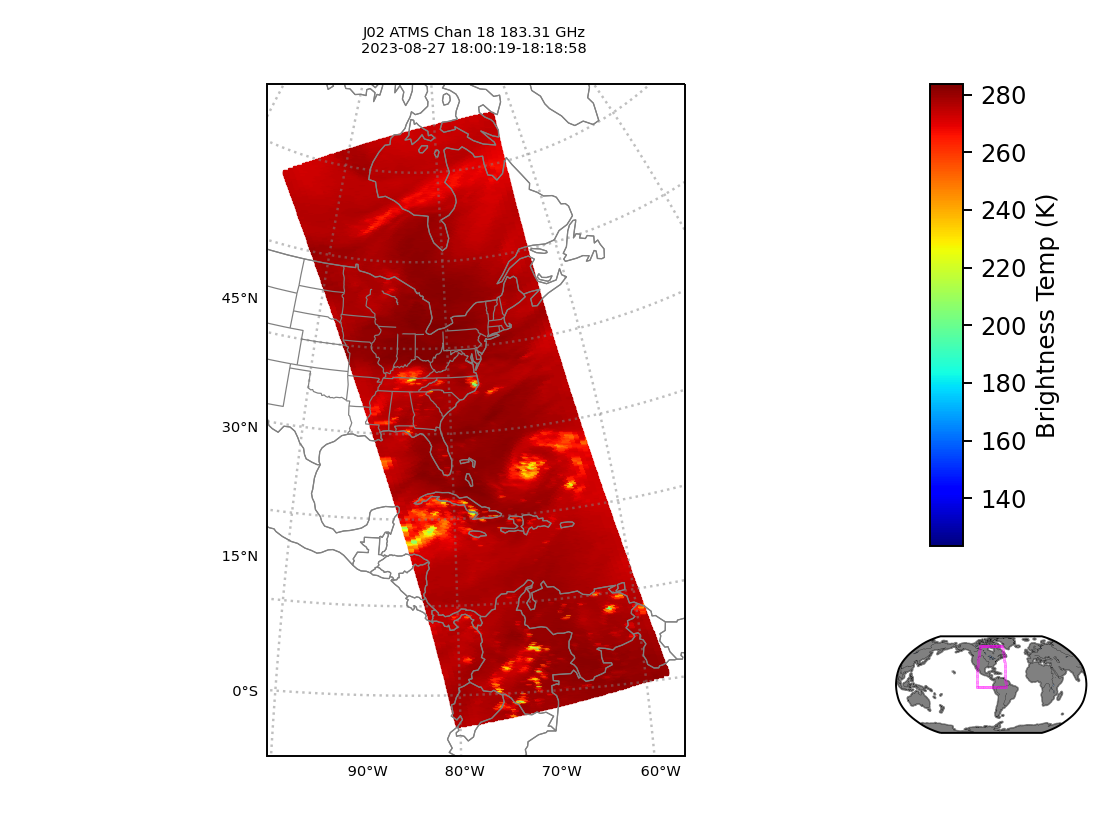
Note that Idalia’s position allows imagery from the CIMSS Direct Broadcast site to show information, for example channel 18 (183 GHz from NOAA-21), or VIIRS True Color from Suomi NPP (an image that includes both Idalia and Hurricane Franklin over the Atlantic Ocean). Direct Broadcast imagery for Idalia is also available from AOML.
Interests along the northeastern Gulf Coast and in the southeastern United States should pay close attention to Idalia’s path. Refer to the National Hurricane Center for the latest information on Idalia.
View only this post Read Less


