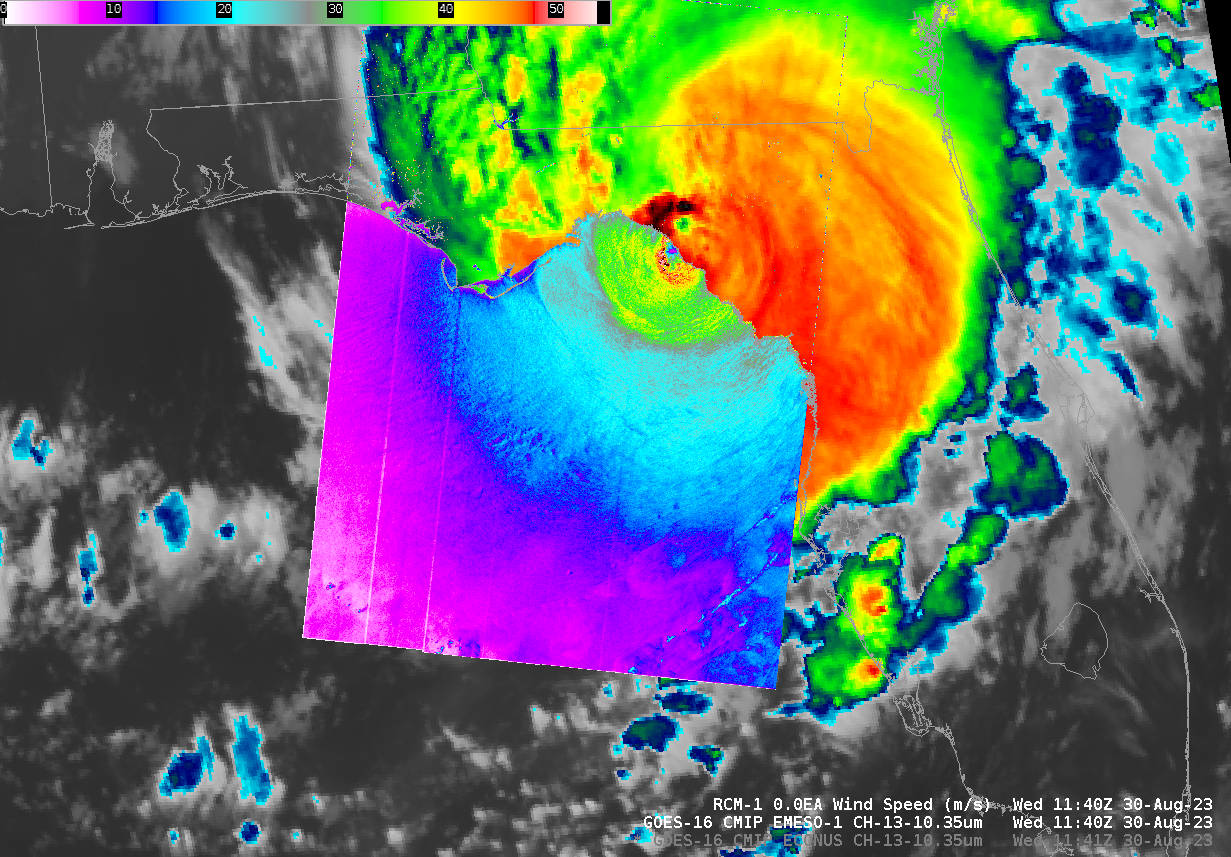
As noted in this blog post, Radar Constellation Mission (RCM1) Synthetic Aperture Radar (SAR) wind estimates were available over Idalia just before landfall on 30 August 2023, as shown above. RCM1 sampled the hurricane 12 hours before landfall, as well, (All SAR overpasses for Idalia are available online here) Peak winds are just under 60 m/s, and the eye is just offshore. Compare this to the image from 12 hours earlier, below, which image has a maximum wind speed around 55 m/s. The area of strong winds has expanded (green/yellow in the enhancement) between the earlier overpass (below) and the later overpass (above)
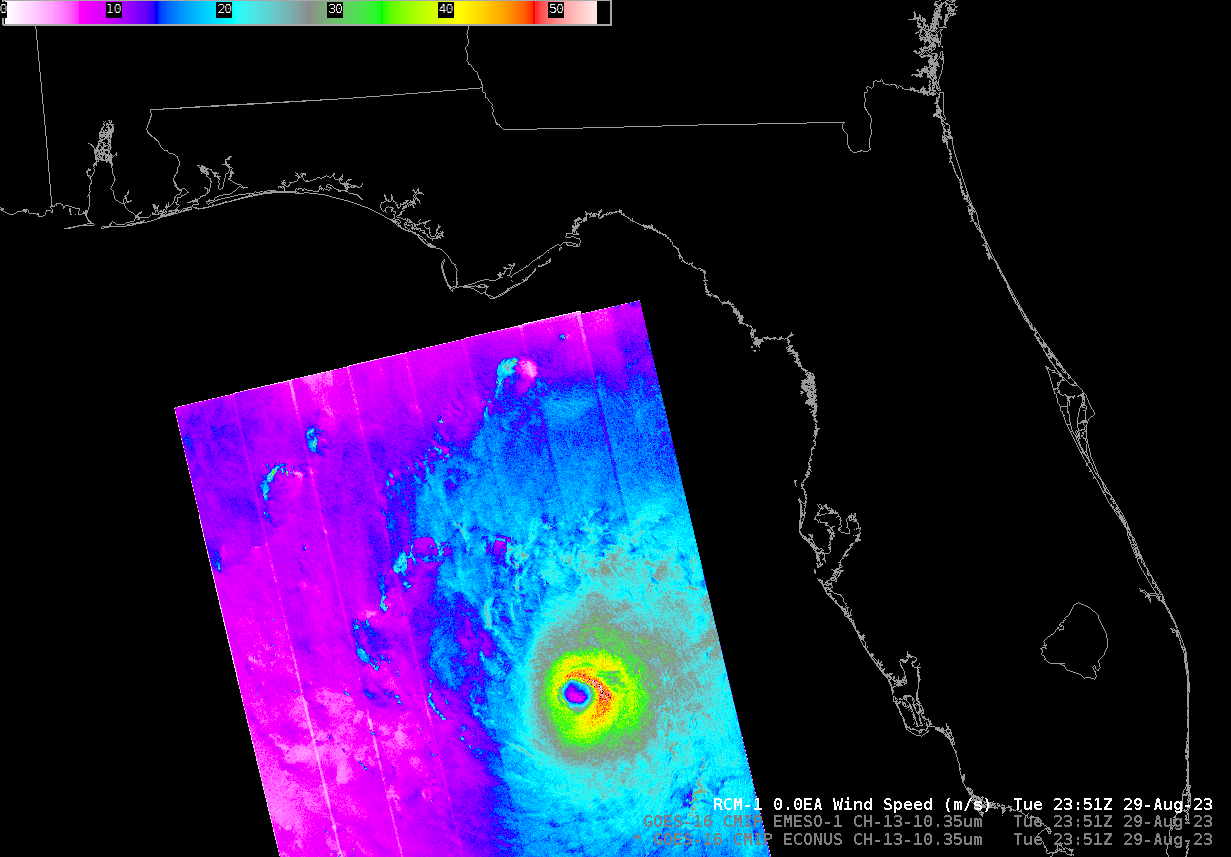
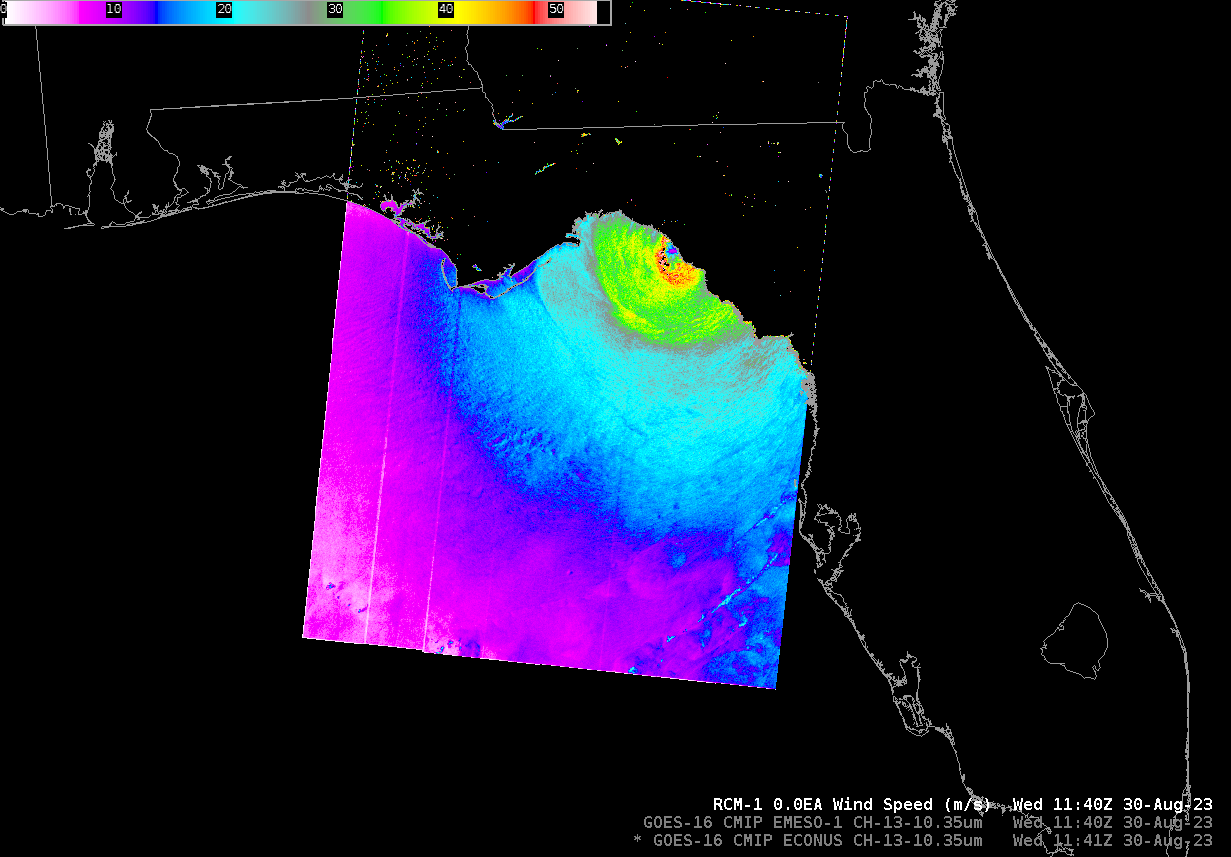
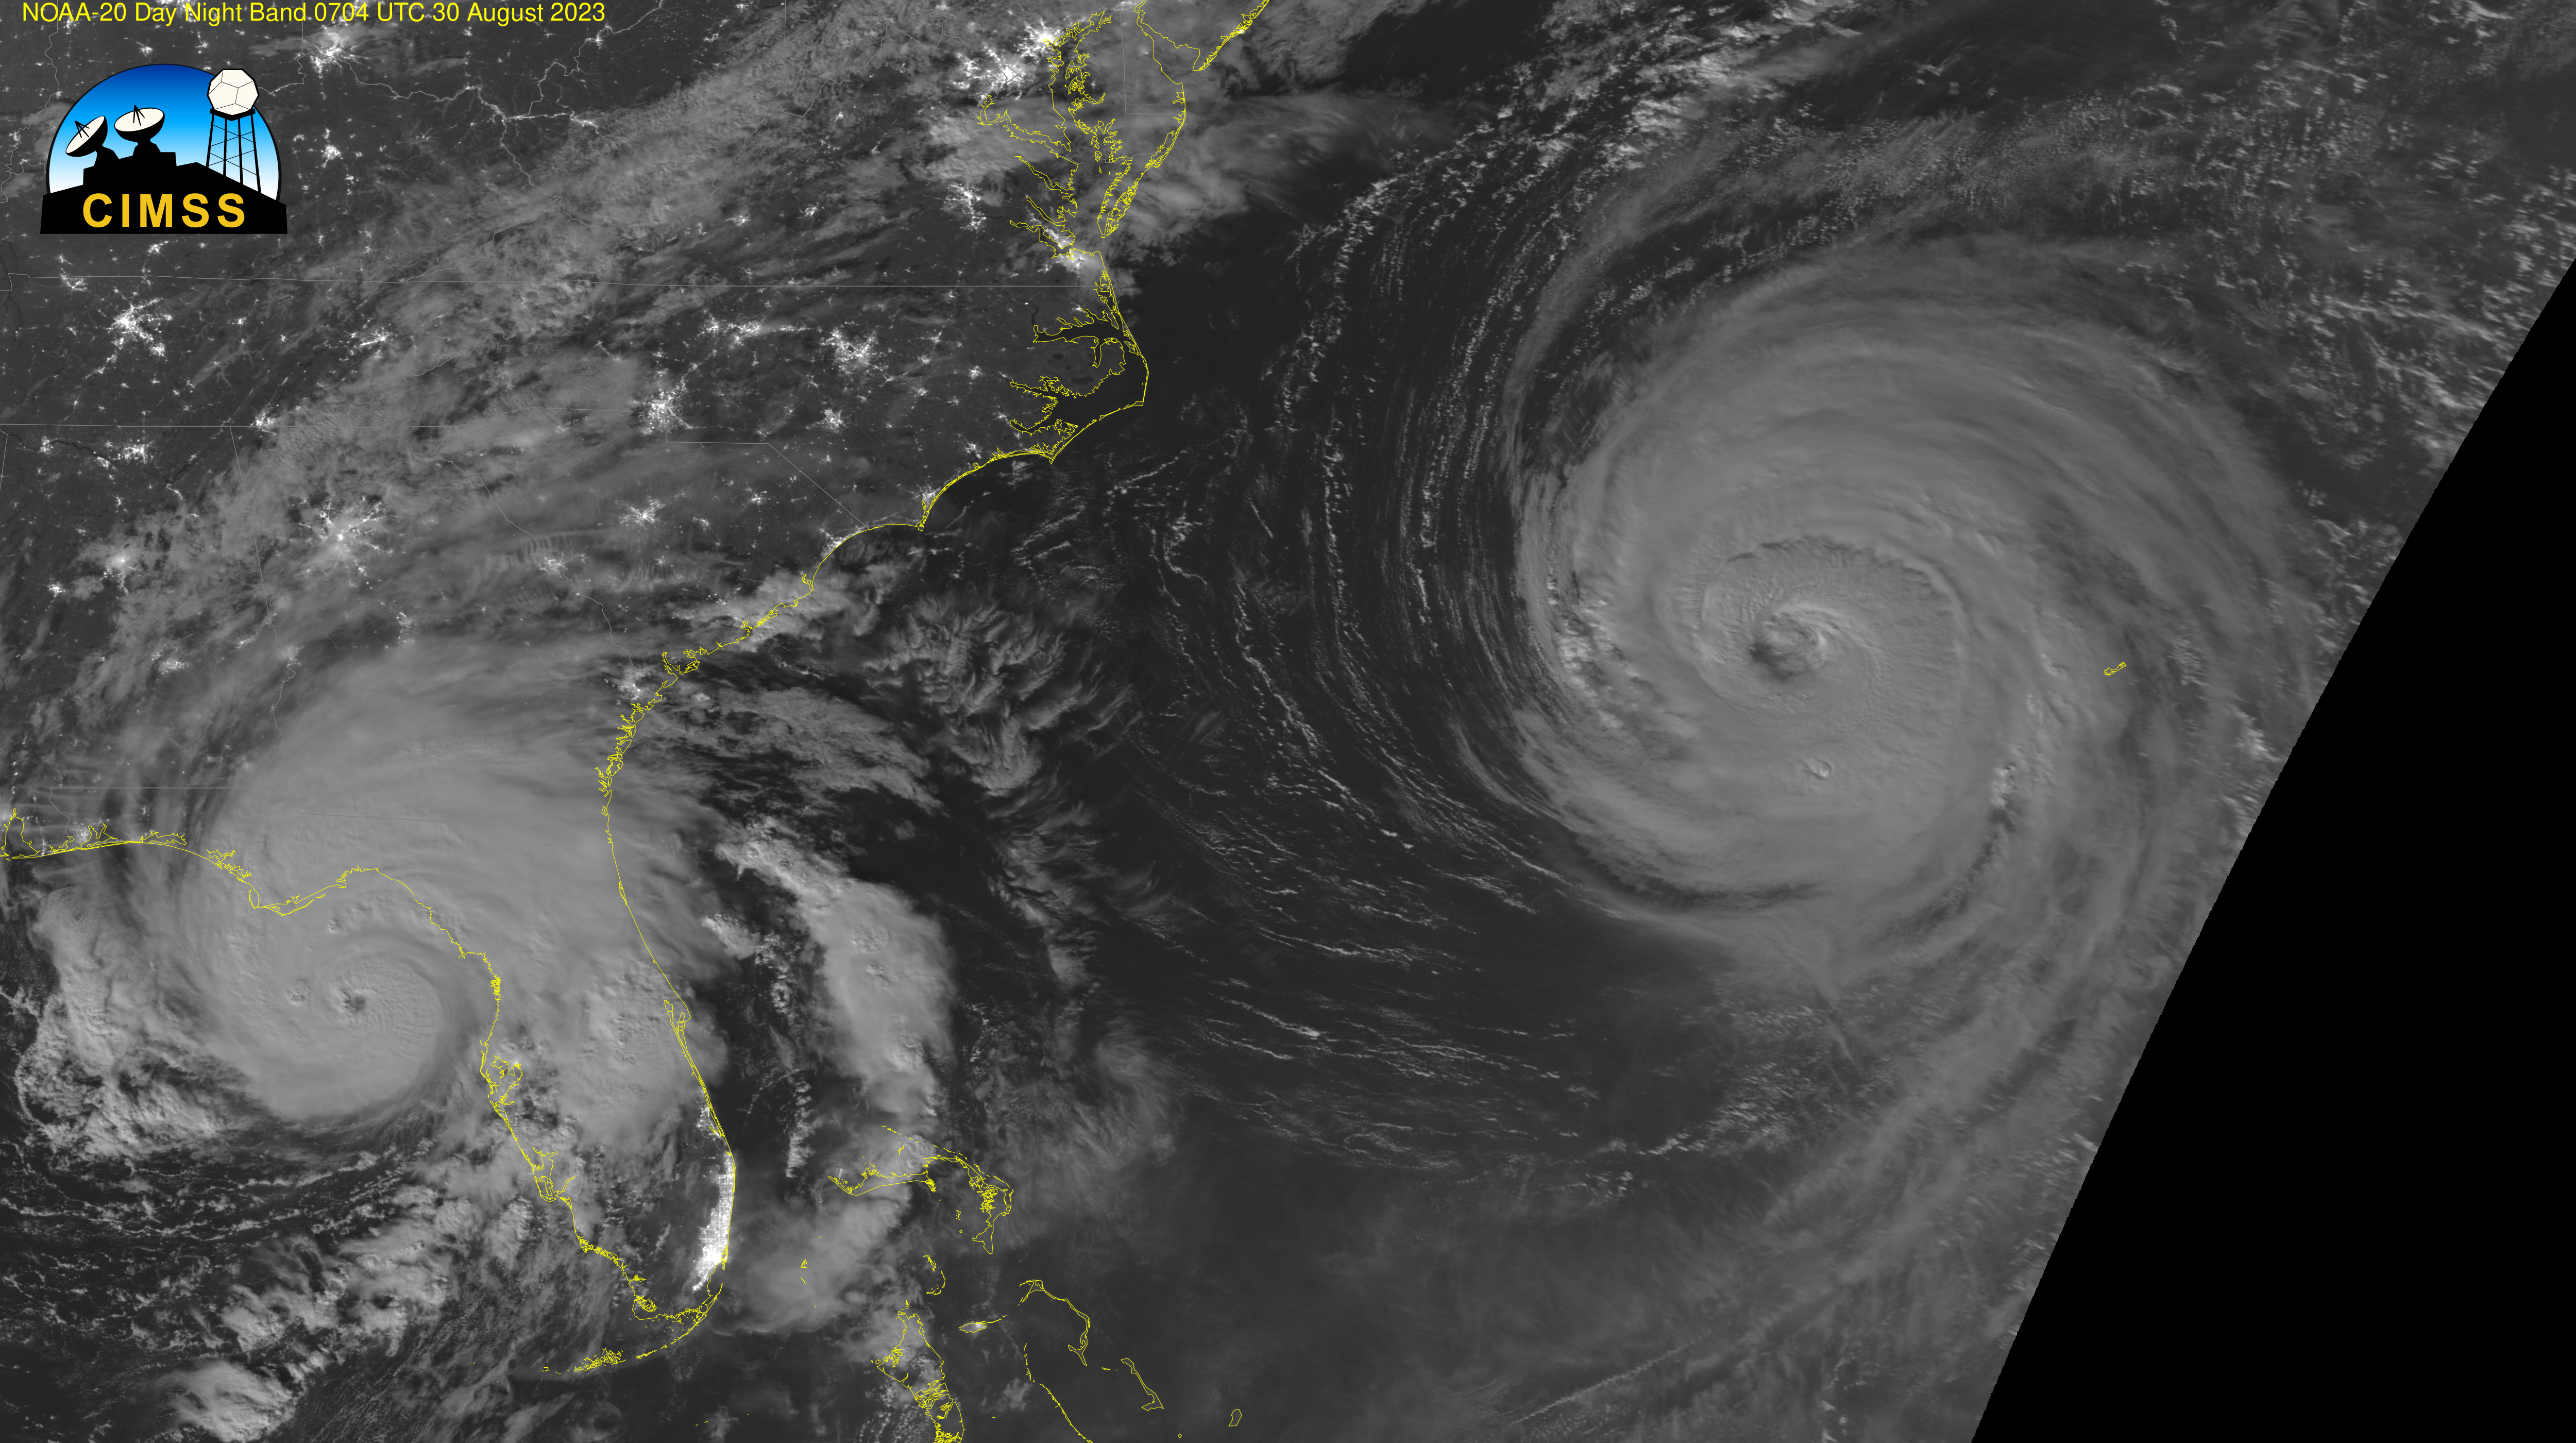
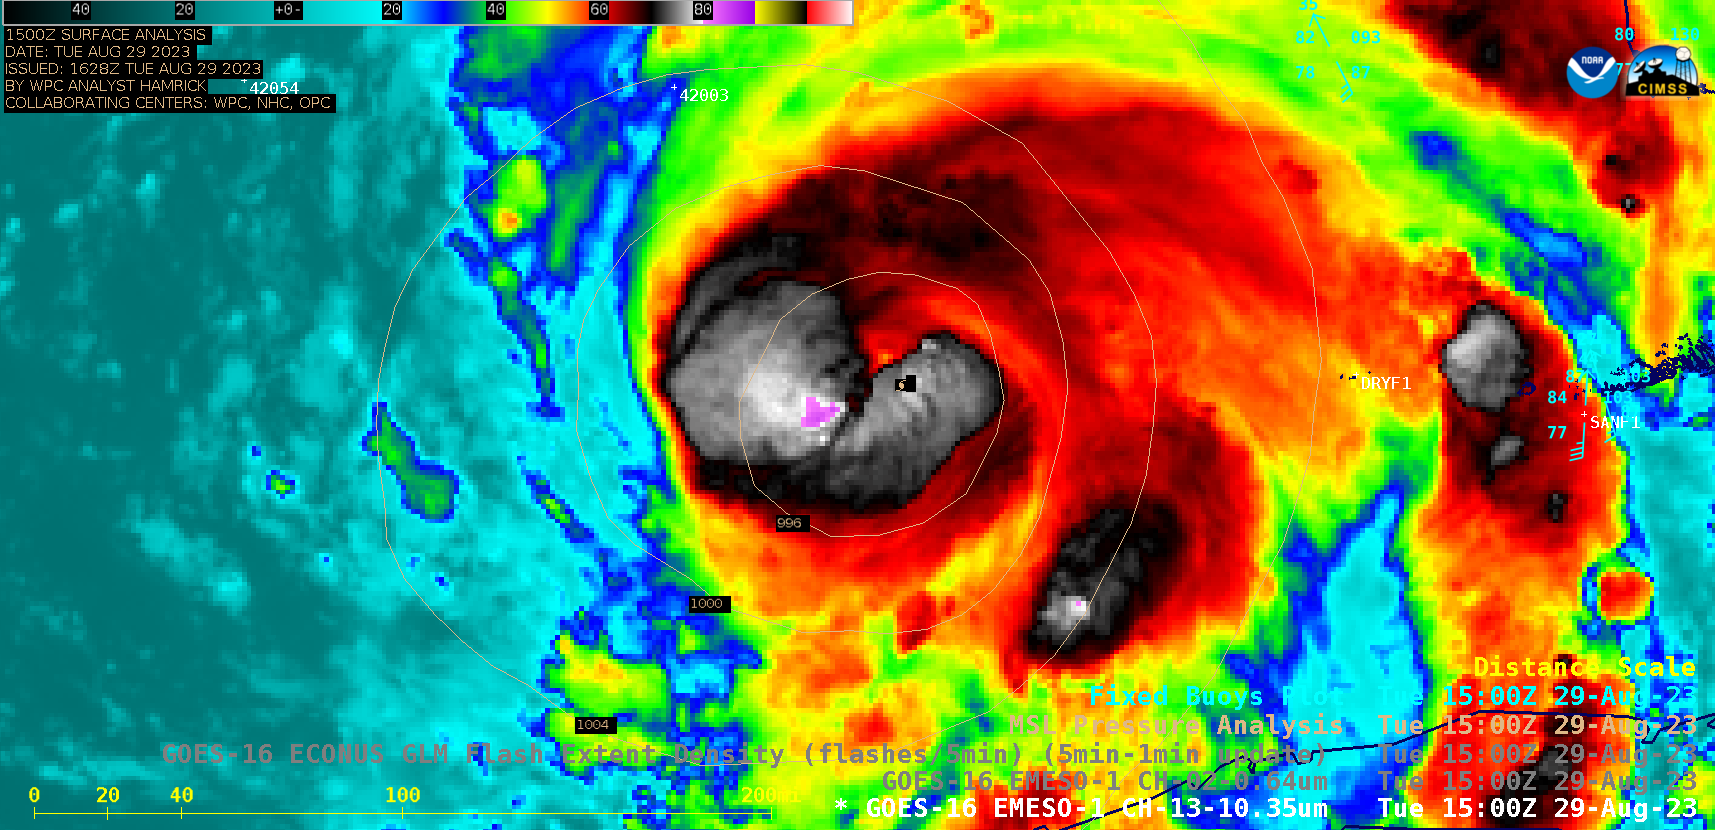
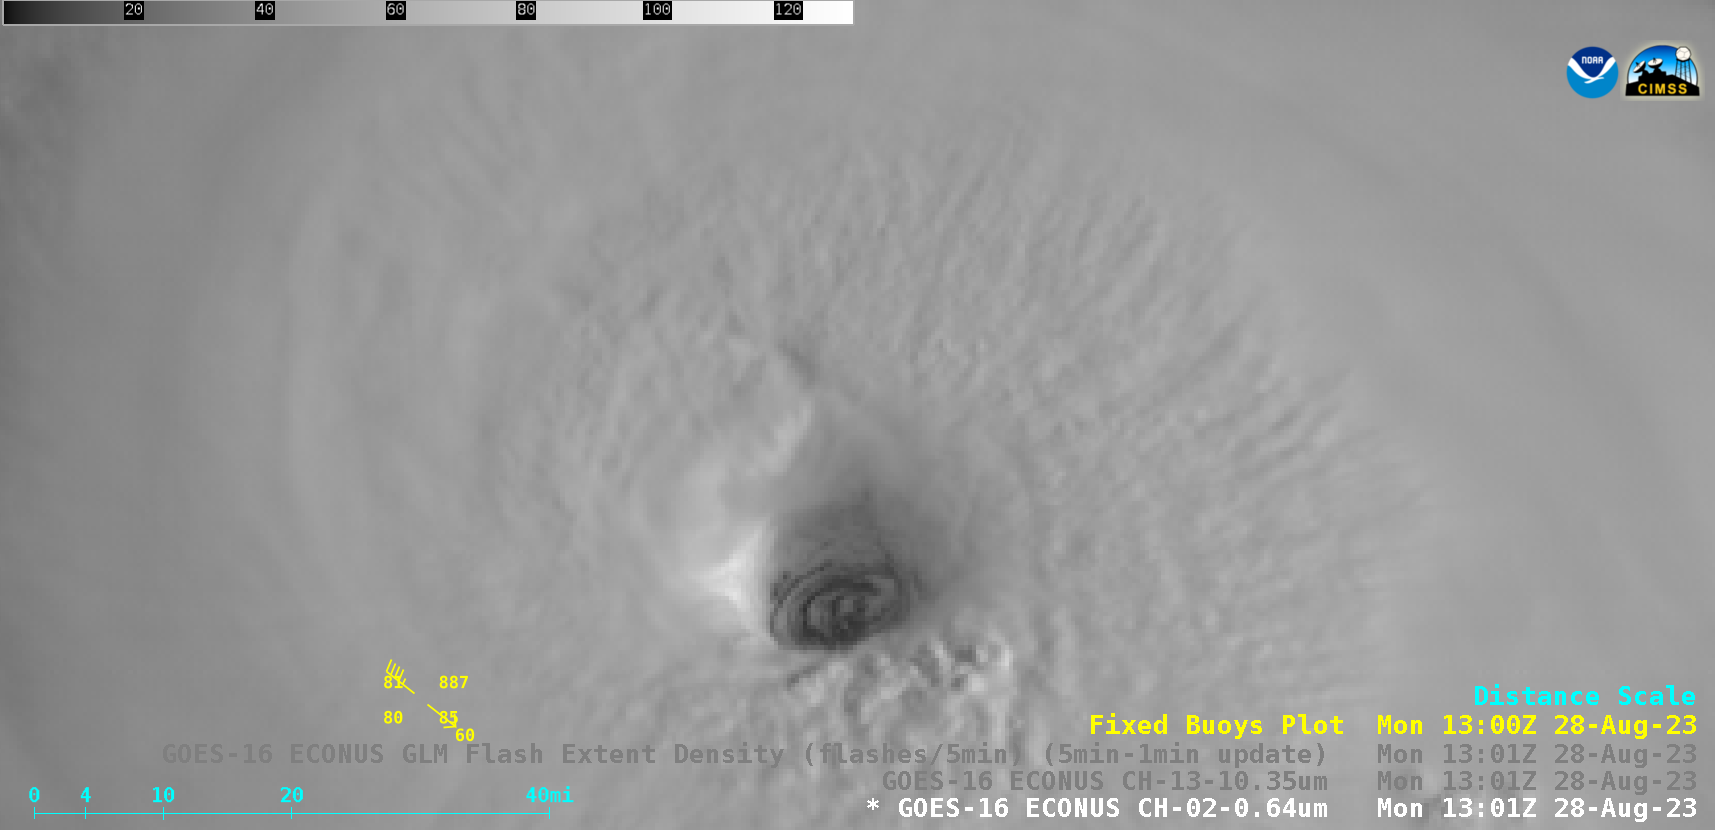
How do the SAR winds compare with ABI infrared imagery of the storm? That is shown in the sliders below. AT 2351 UTC on 29 August 2023, the eye of the storm is nearly beneath the warm region in the ABI where an eye might be inferred to be forming (the 29 August/2100 UTC discussion from NHC noted that an eye was forming in satellite imagery).
Just before the 1145 UTC landfall on 30 August, at 1140 UTC, below, SAR winds show the eye just offshore, but the eye in satellite imagery is inland. Why the difference between the SAR/ABI comparison above and below?
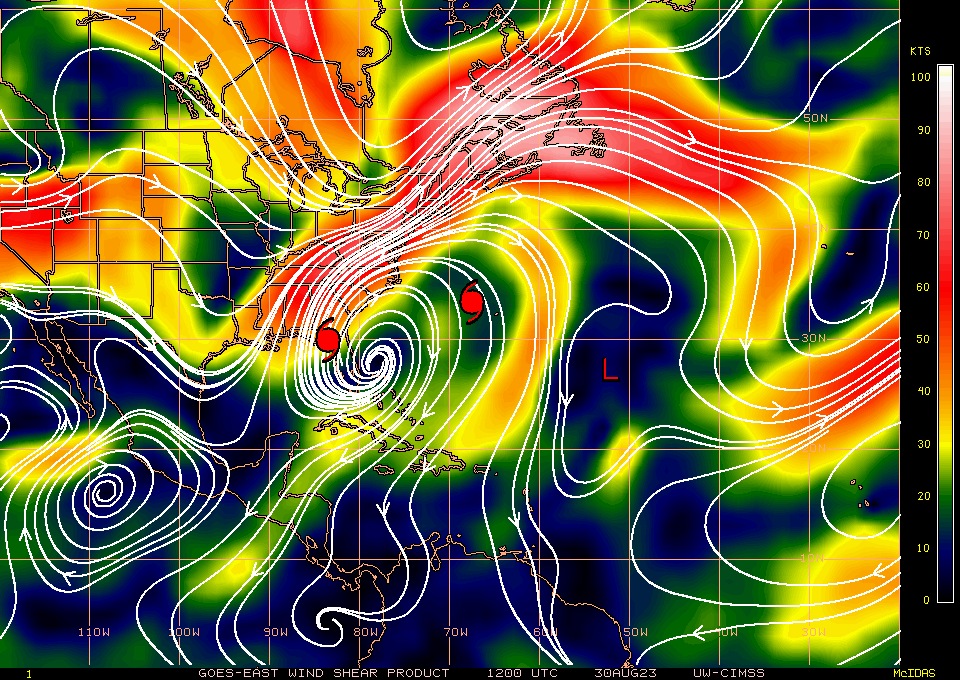
At 0000 UTC on 30 August (i.e., just before the earlier SAR overpass shown above), wind shear values over the storm were diagnosed as low as shown below. In contrast, by 1200 UTC on 30 August, just after landfall, at bottom, shear values were considerably larger, and would be displacing the top of the storm to the northeast.

View only this post Read Less

