
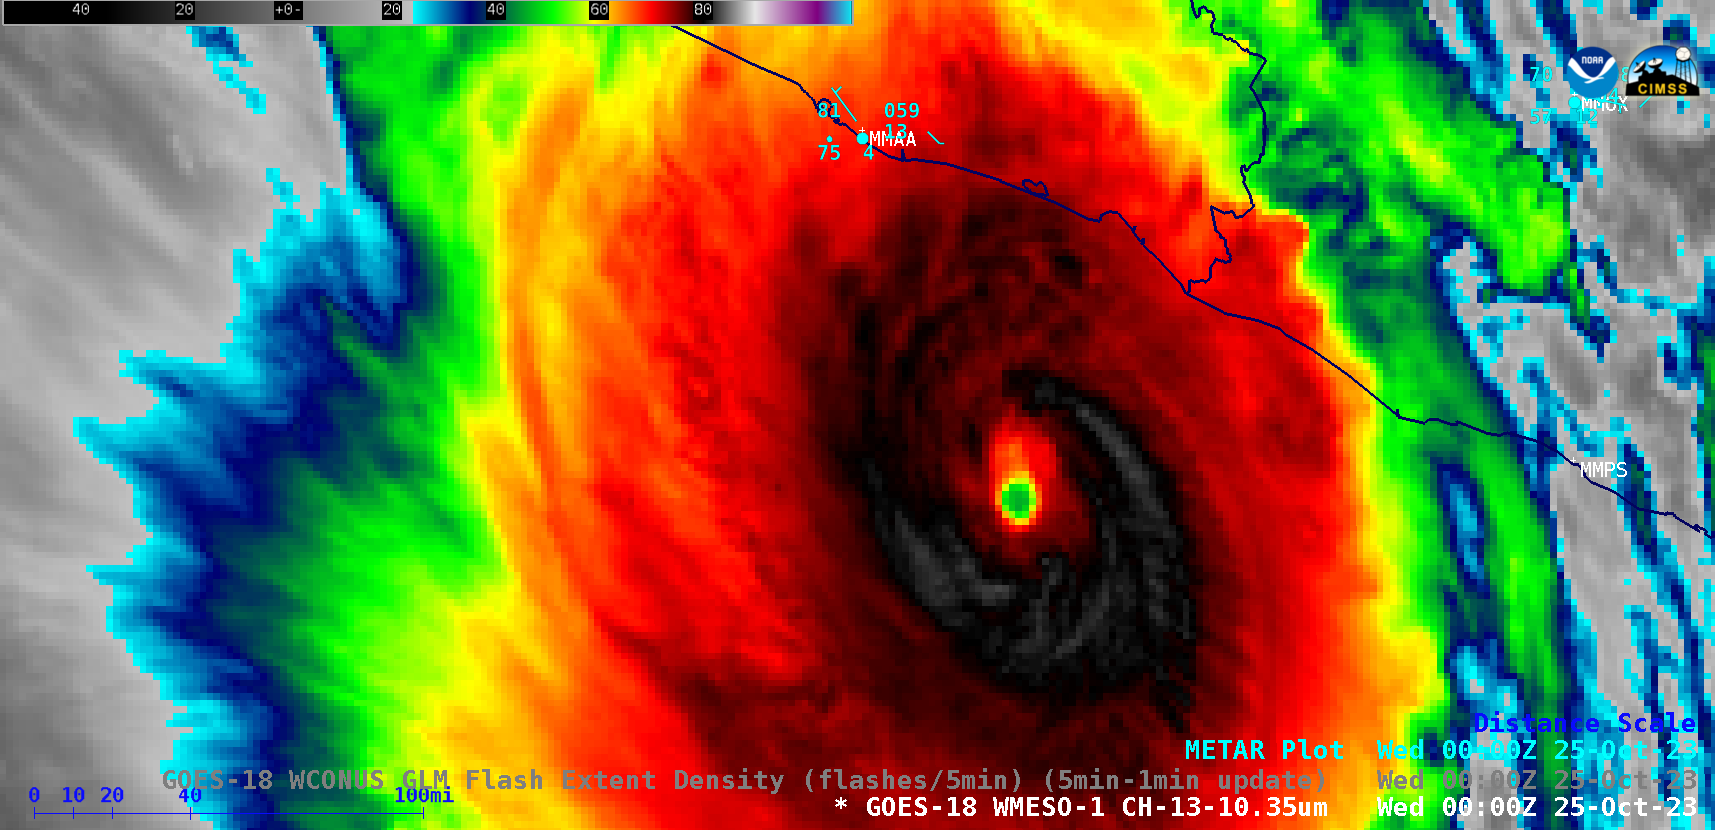
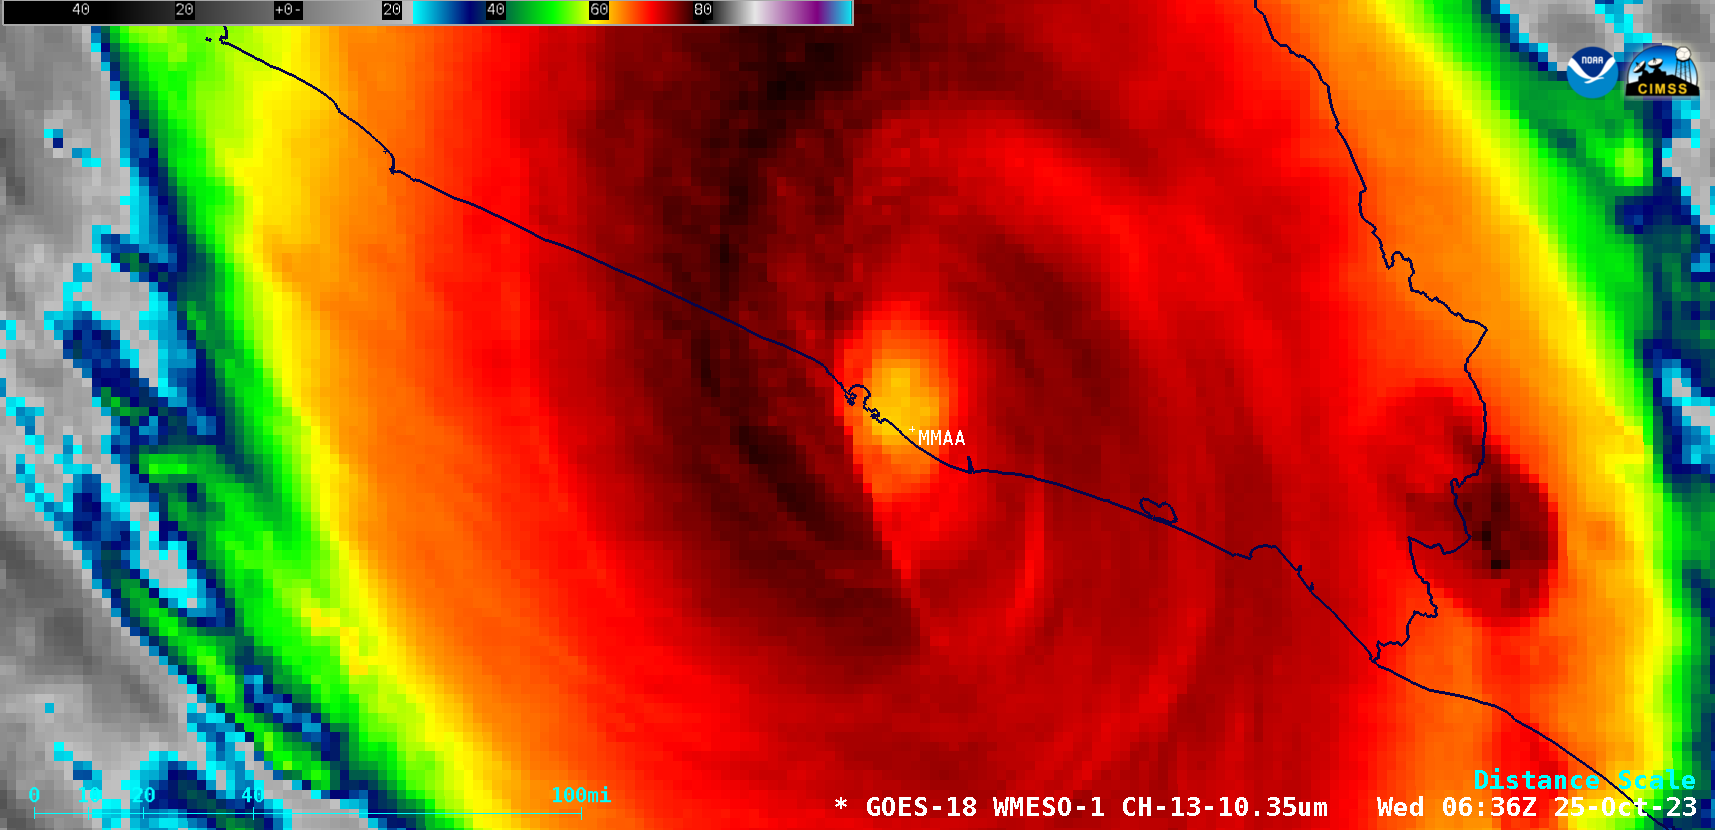
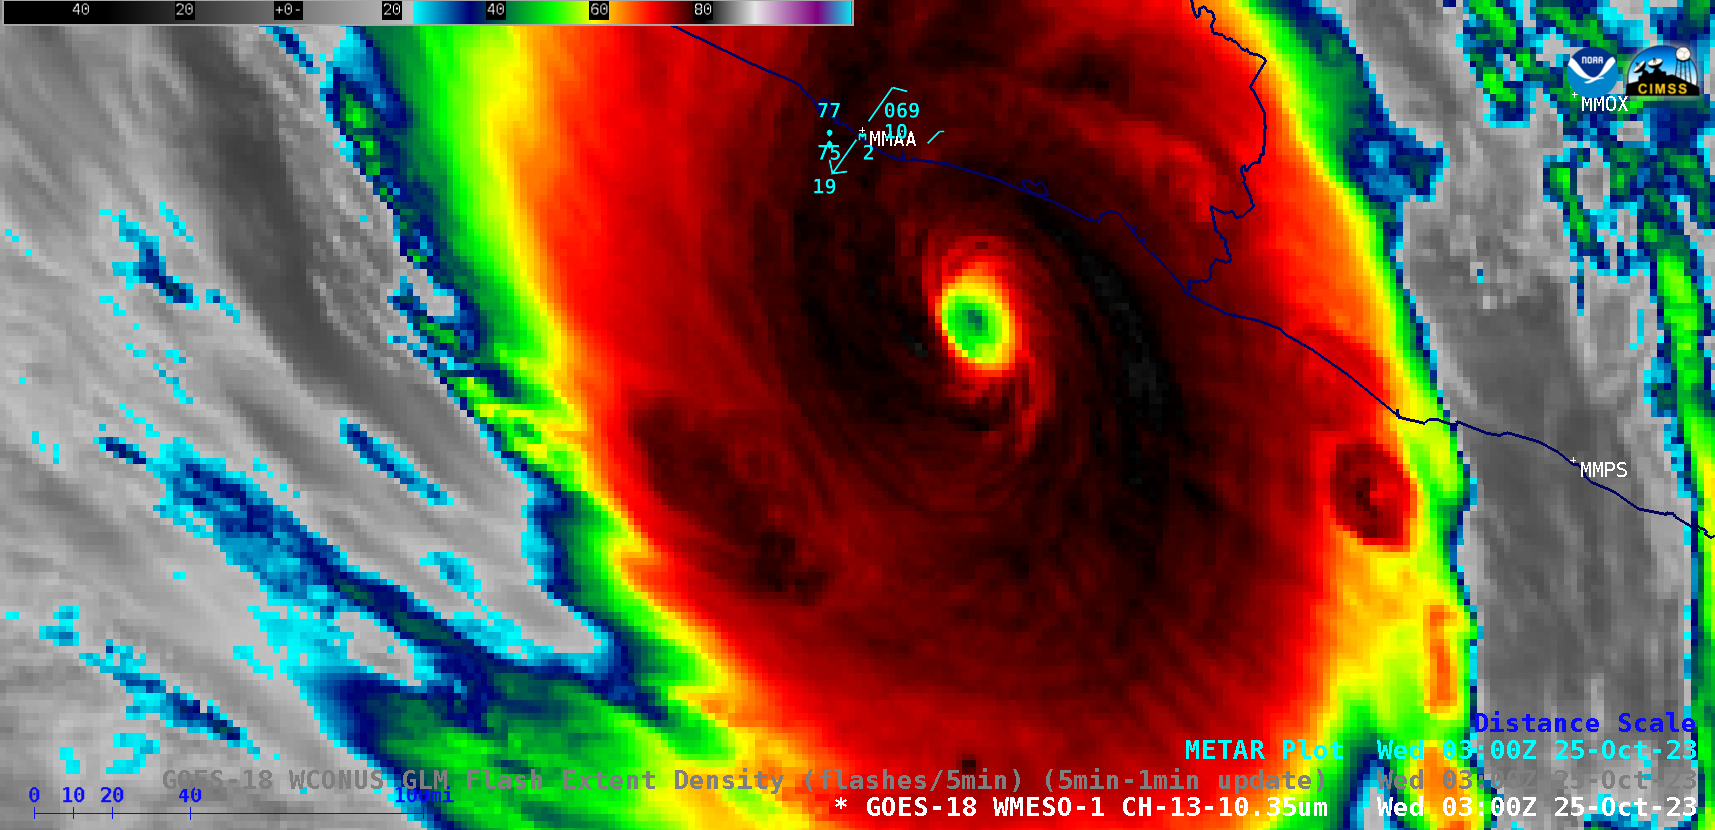
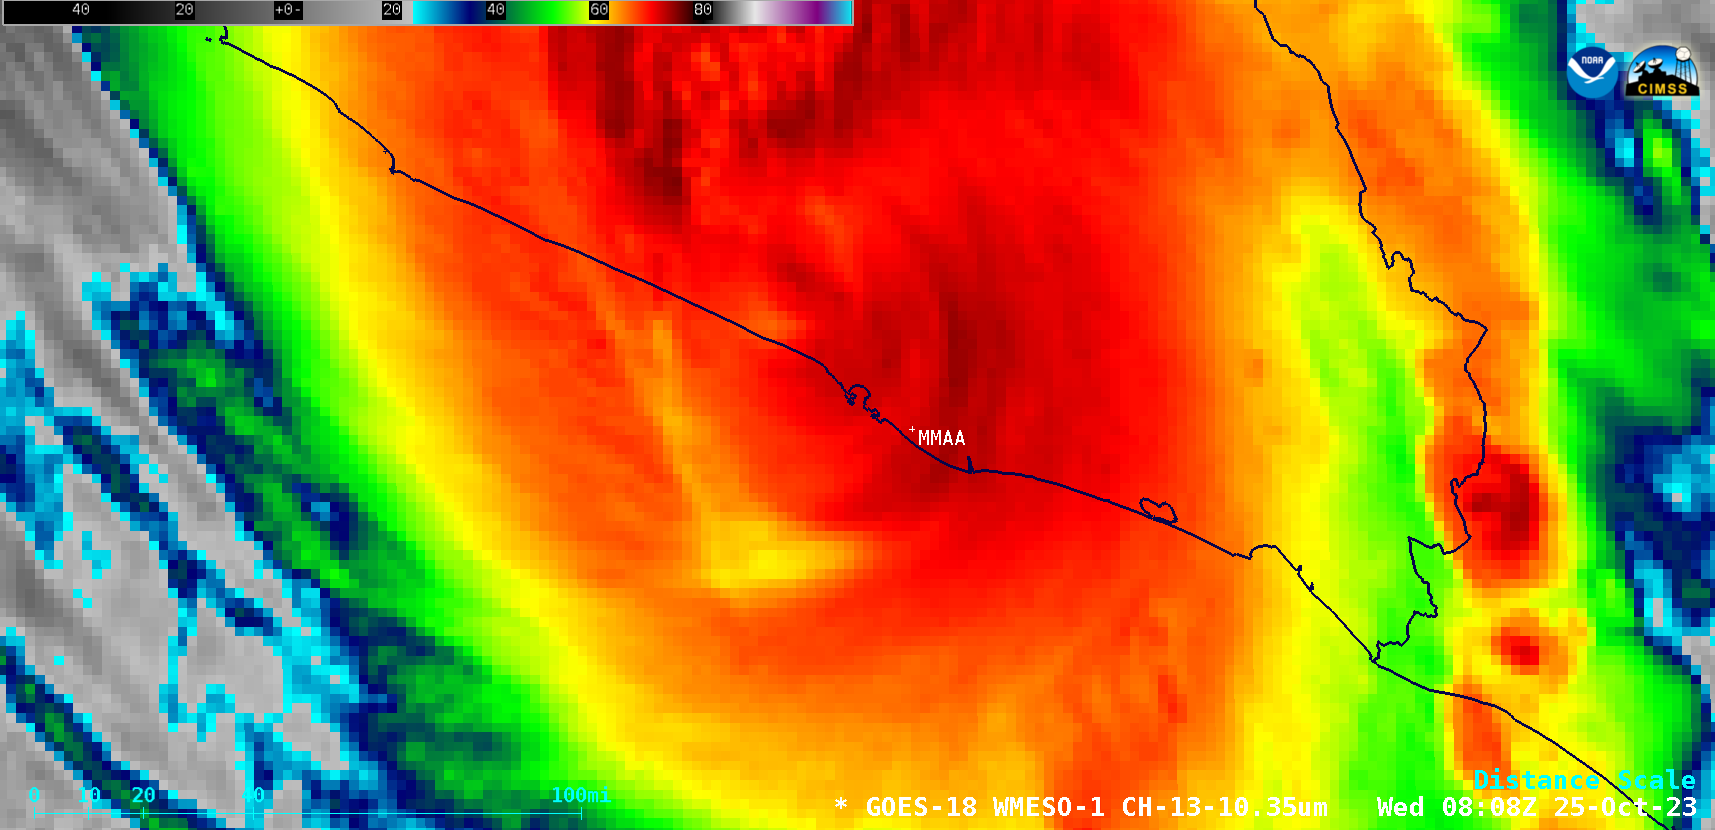
1-minute Mesoscale Domain Sector GOES-18 (GOES-West) “Clean” Infrared Window (10.3 µm) images (above) showed Hurricane Otis as it approached the coast of Mexico, making landfall near Acapulco (Acapulco International Airport, METAR identifier MMAA, is located about 16 miles southeast of the city center) around 0625 UTC on 25 October 2023. During the 11-hour time period shown,... Read More
GOES-18 “Clean” Infrared Window (10.3 µm) images, from 2000 UTC on 24 October to 0700 UTC on 25 October [click to play animated GIF | MP4]
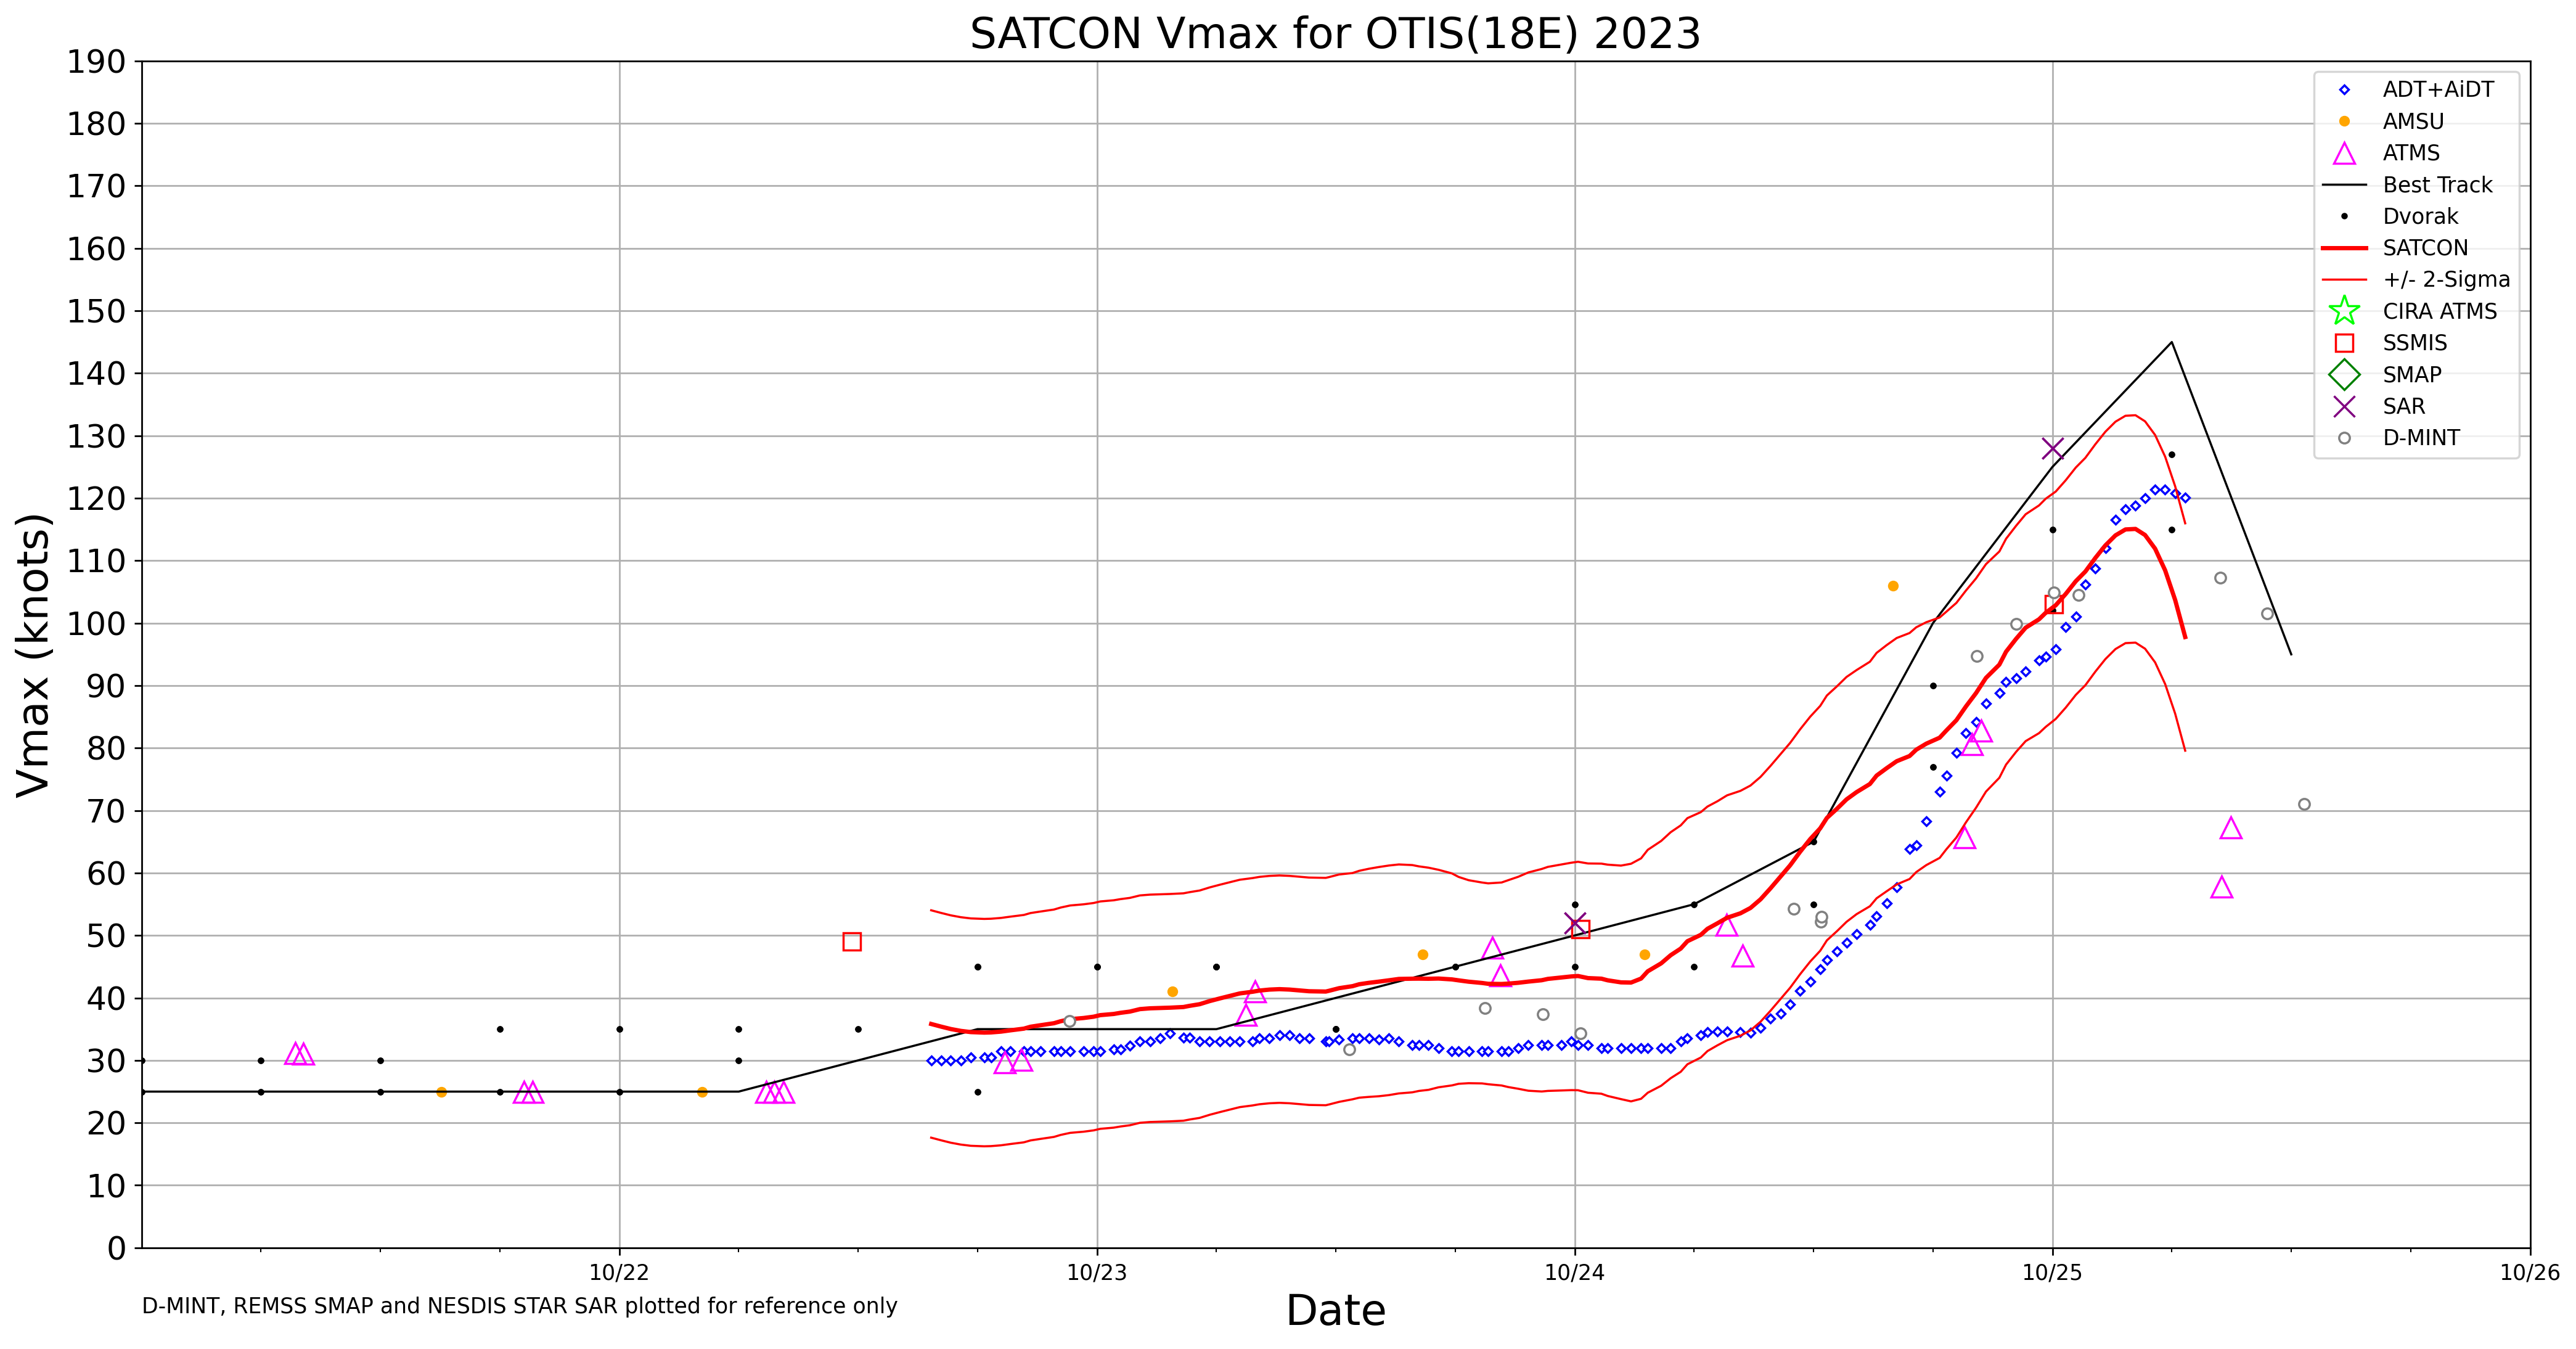
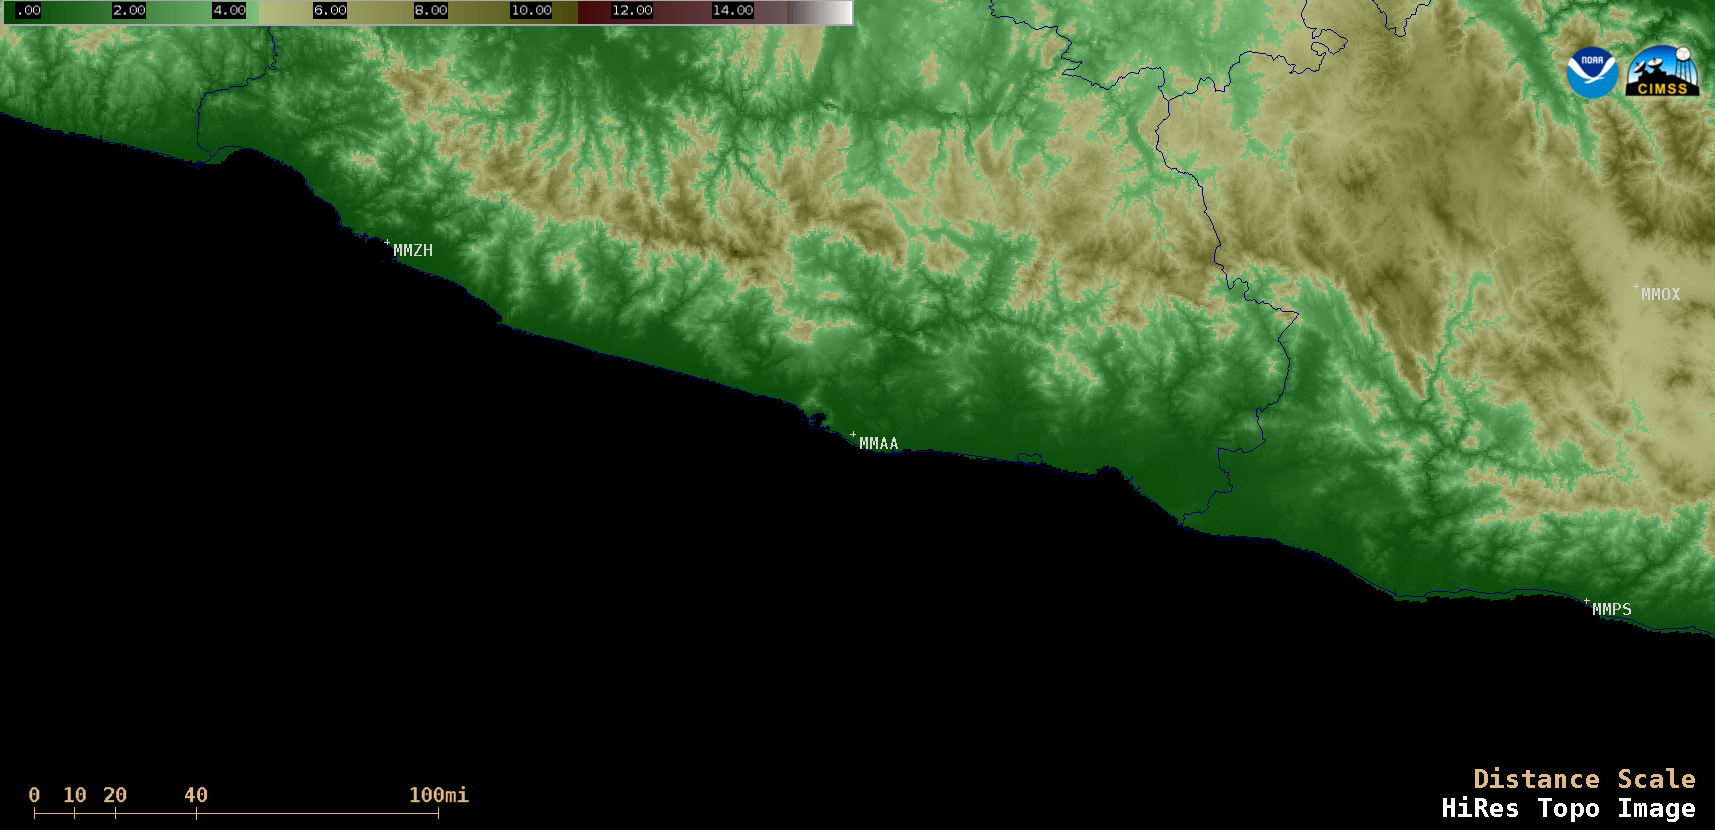
1-minute Mesoscale Domain Sector GOES-18 (GOES-West) “Clean” Infrared Window (10.3 µm) images (above) showed Hurricane Otis as it approached the coast of Mexico, making landfall near Acapulco (Acapulco International Airport, METAR identifier MMAA, is located about 16 miles southeast of the city center) around 0625 UTC on 25 October 2023. During the 11-hour time period shown, Otis was rapidly intensifying from a Category 2 hurricane at 2000 UTC on 24 October to Category 5 at 0300 UTC on 25 October (SATCON) — exhibiting a pinhole eye in the process. The coldest cloud-top infrared brightness temperatures were in the -80 to -90ºC range (shades of white, embedded within dark shades of black). After landfall Otis weakened quickly to a Category 2 storm by 1200 UTC on 25 October, due to interaction with the complex Sierra Madre del Sur topography.
Note that surface reports from Acapulco International Airport ceased after 0341 UTC on 25 October (presumably due to evacuation and/or power outages) — by that time, the site had already received 11 inches of rainfall (below) .
Plot of surface report data from Acapulco International Airport, from 1846 UTC on 24 October to 0341 UTC on 25 October [click to enlarge]
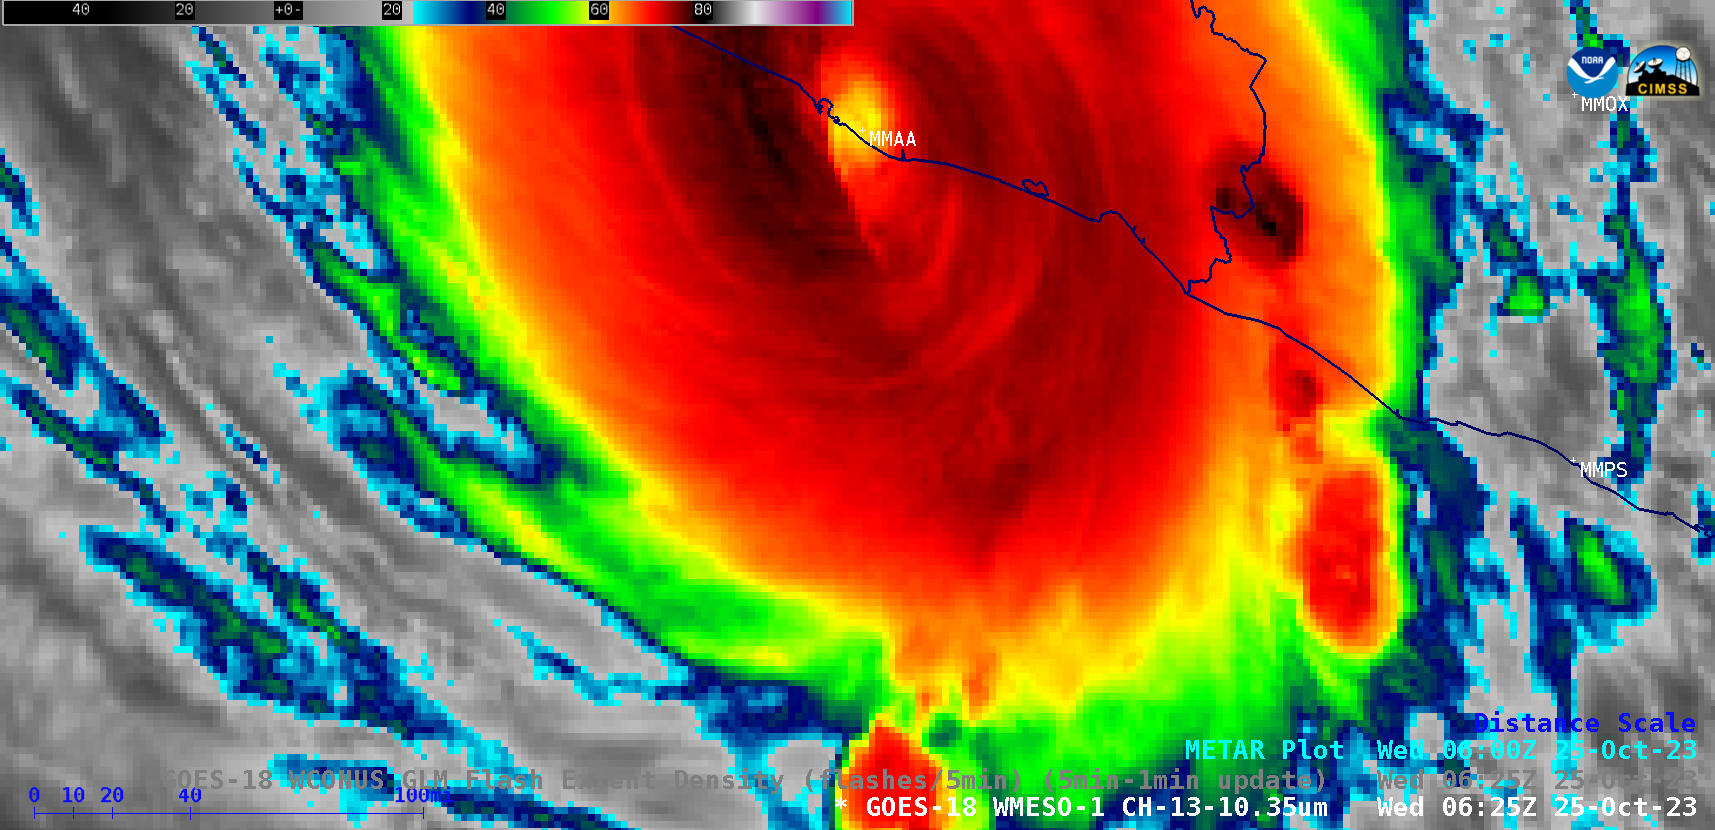
1-minute GOES-18 Infrared images with an overlay of GLM Flash Extent Density (below) revealed continuous lightning activity within the eyewall — which peaked in intensity at 0550 UTC, about 35 minutes prior to landfall.
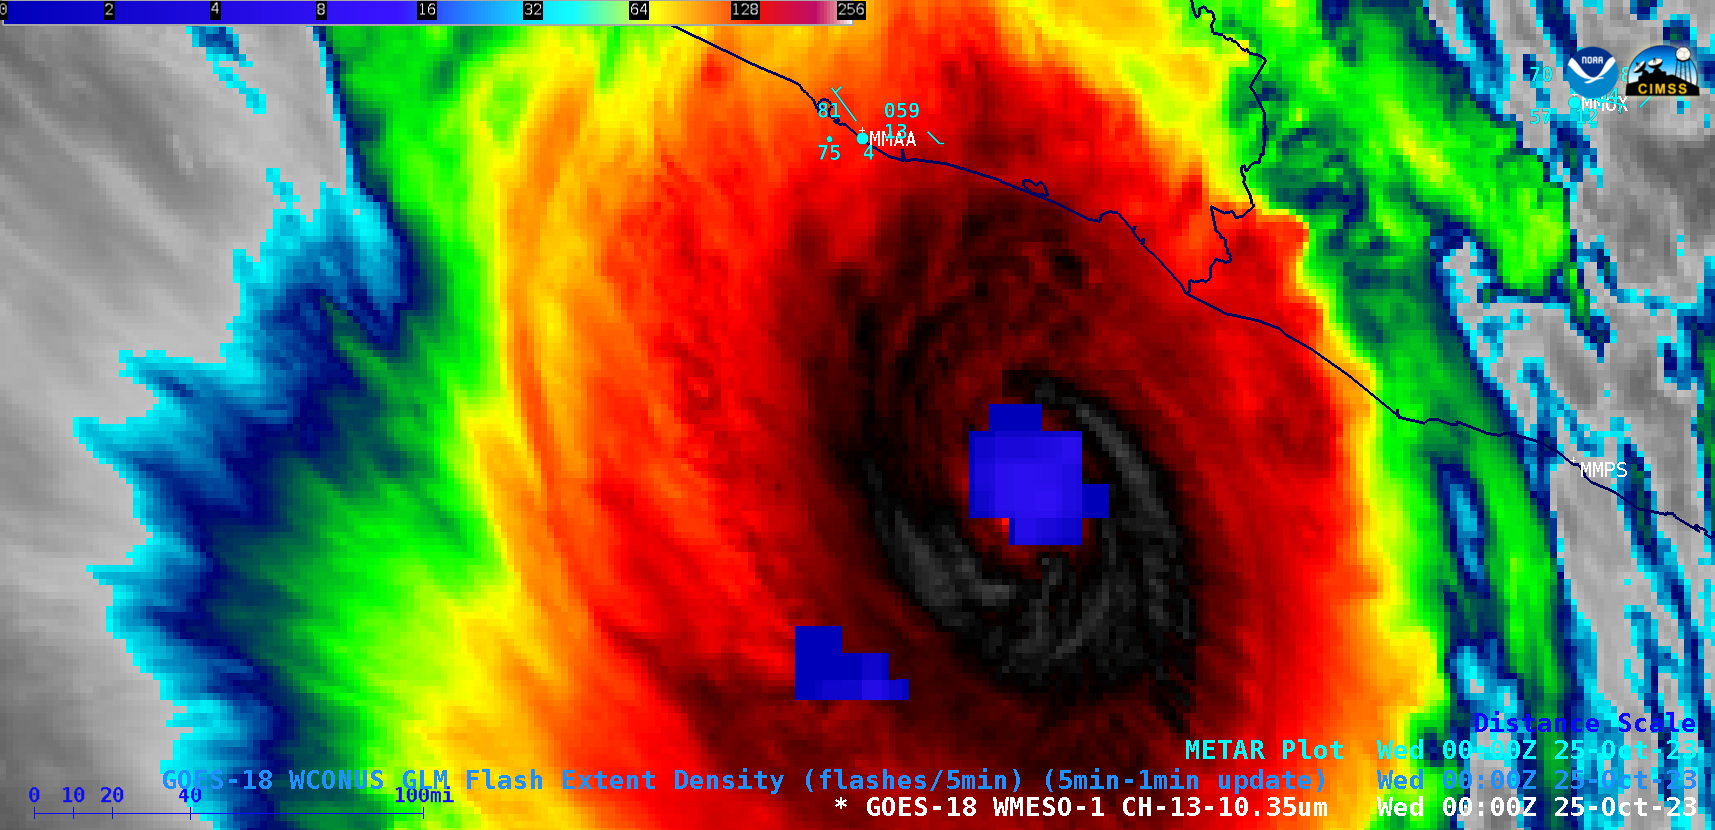
GOES-18 “Clean” Infrared Window (10.3 µm) images with an overlay of GLM Flash Extent Density, from 2000 UTC on 24 October to 0700 UTC on 25 October [click to play animated GIF | MP4]
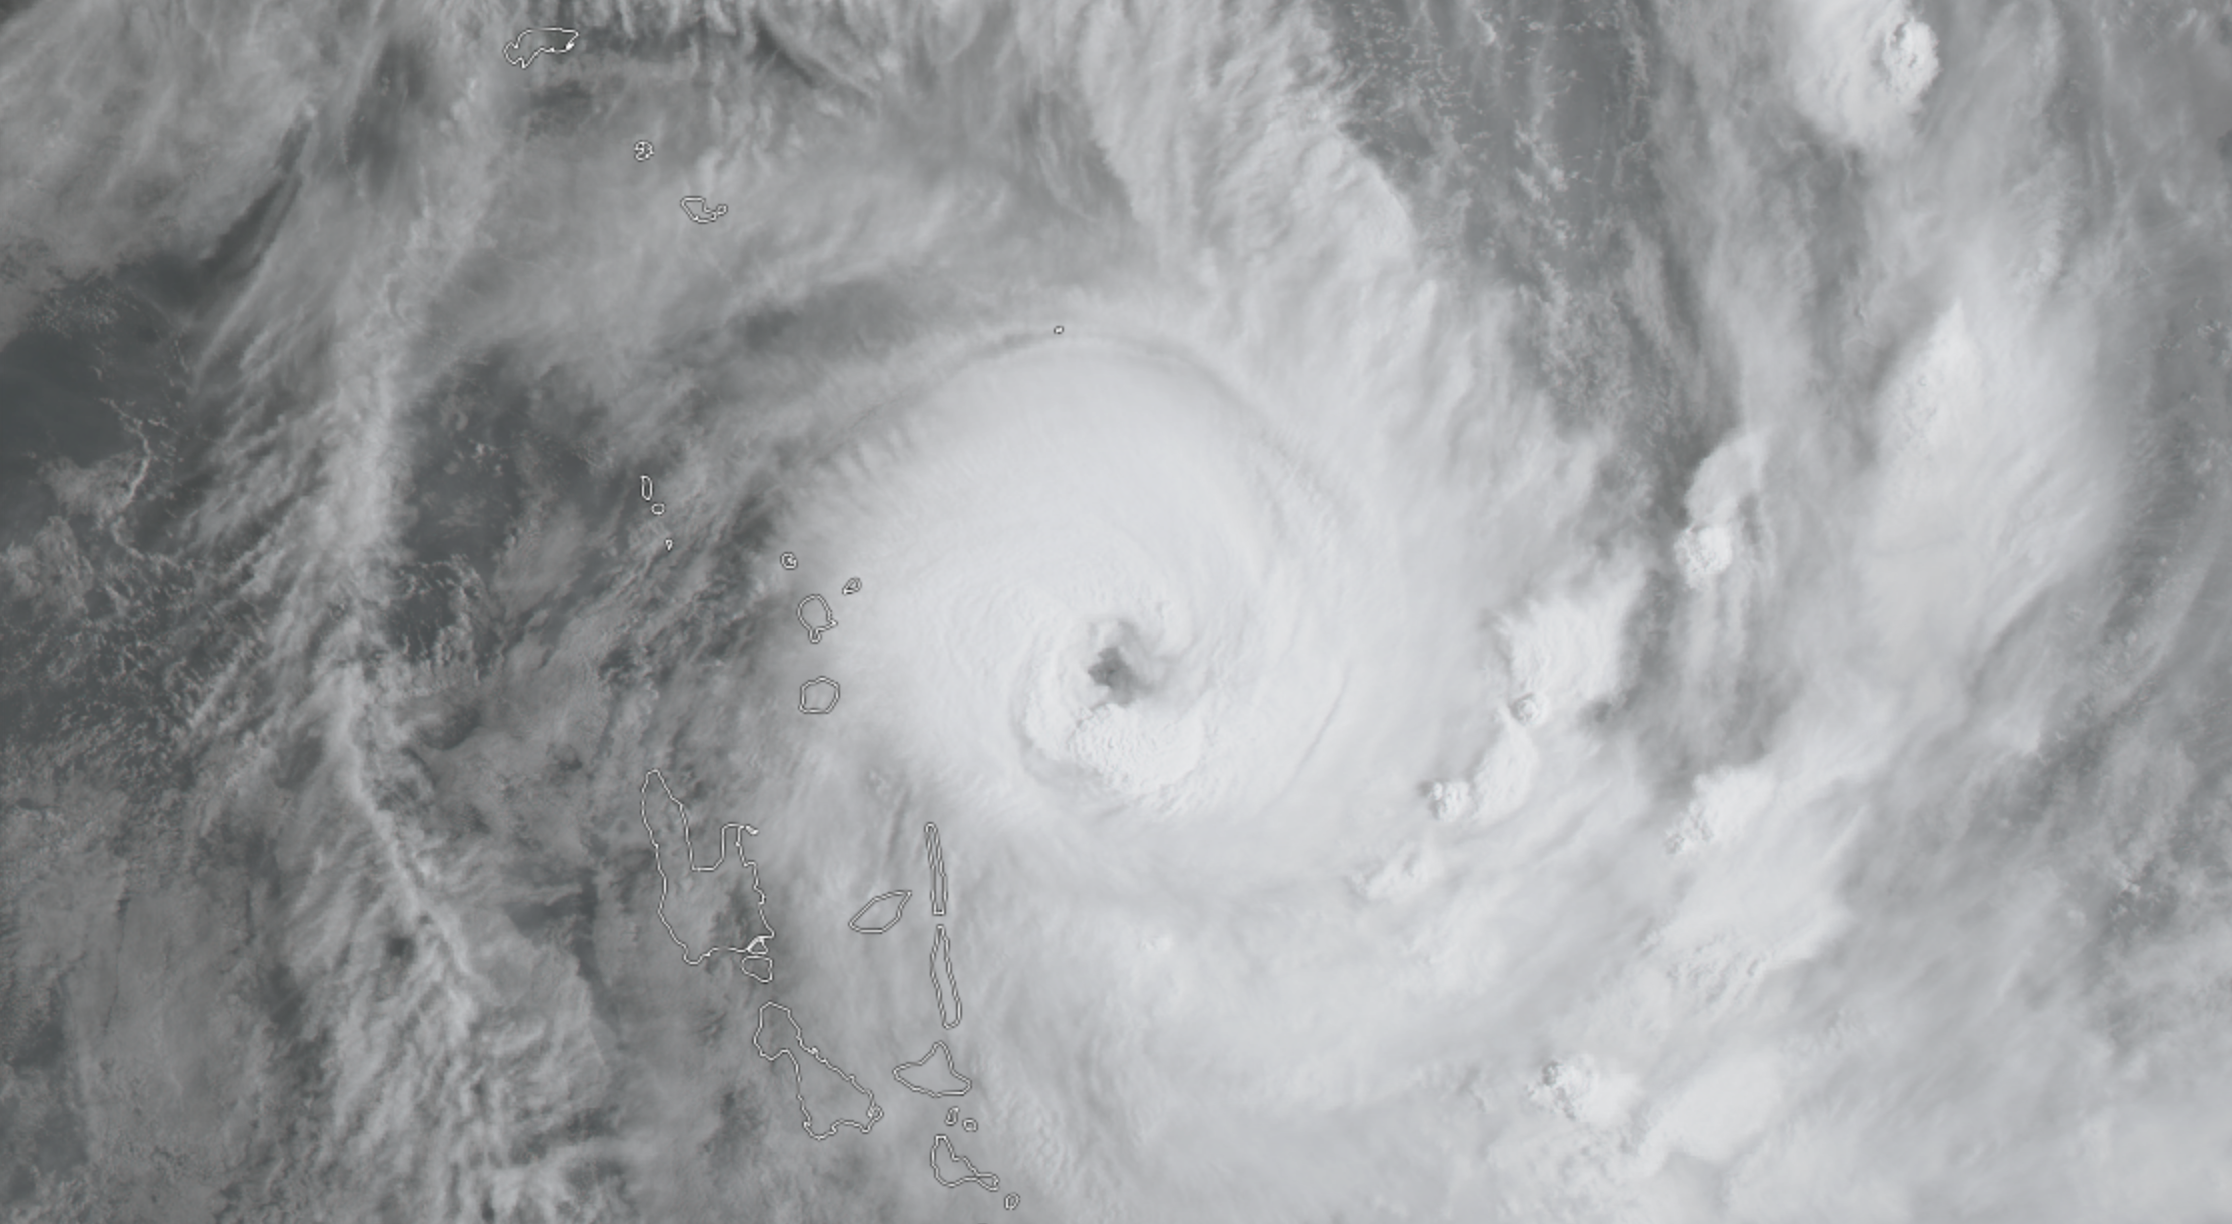
1-minute GOES-18 “Red” Visible (0.64 µm) images (below) showed a cloud-filled eye during the hours leading up to sunset, with intermittent pulses of convective overshooting tops within the eyewall (Visible/Infrared image toggle at 2246 UTC).
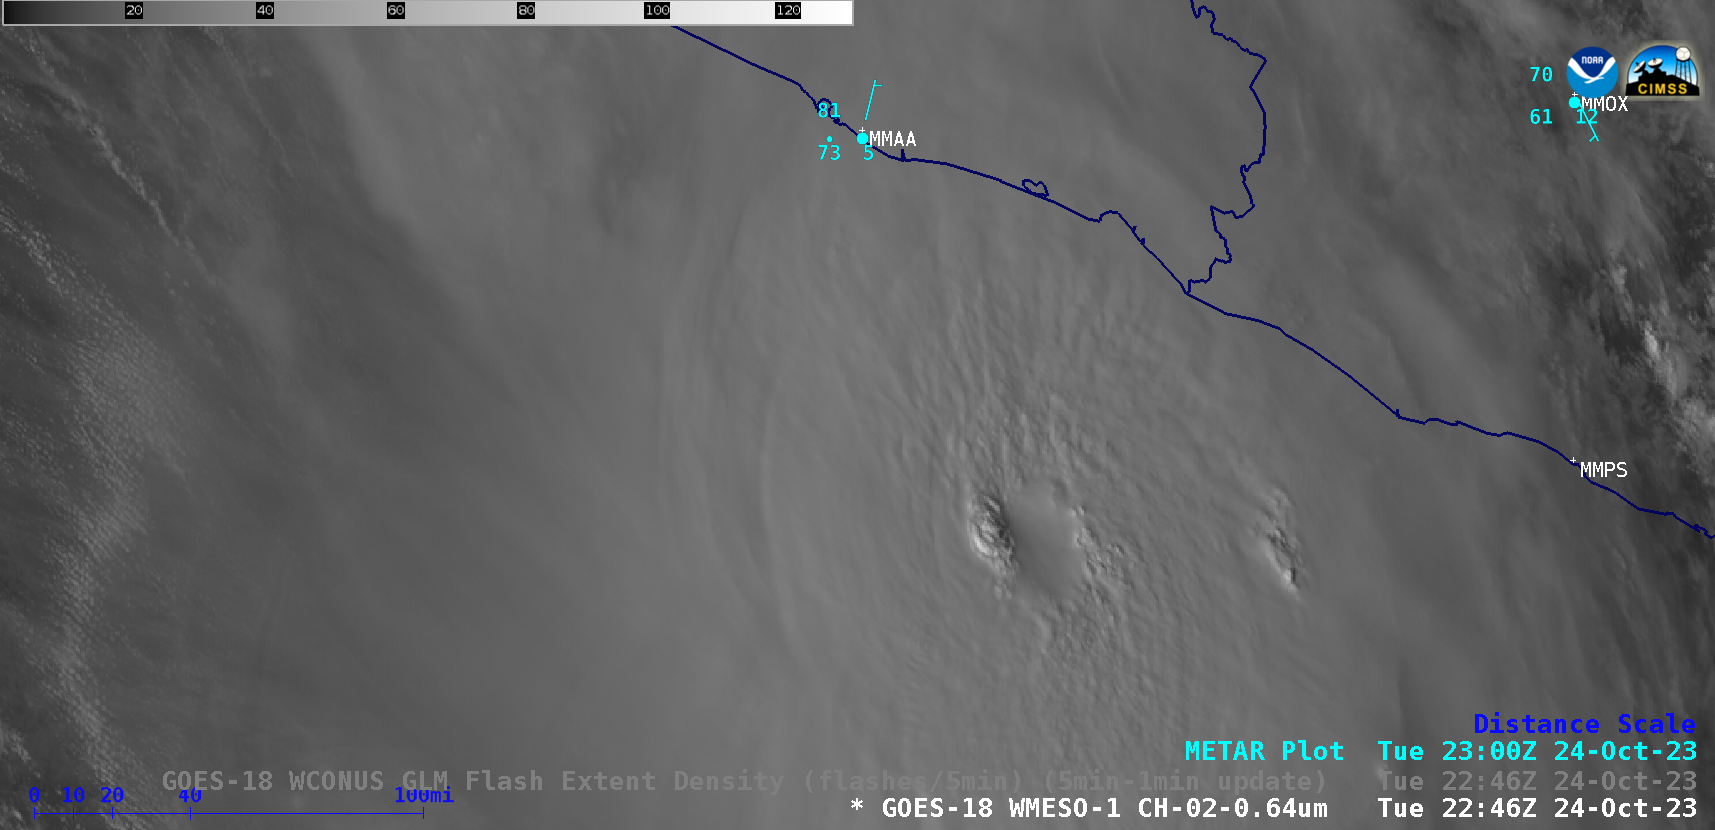
GOES-18 “Red” Visible (0.64 µm) images, from 2000 UTC on 24 October to 0000 UTC on 25 October [click to play animated GIF | MP4]
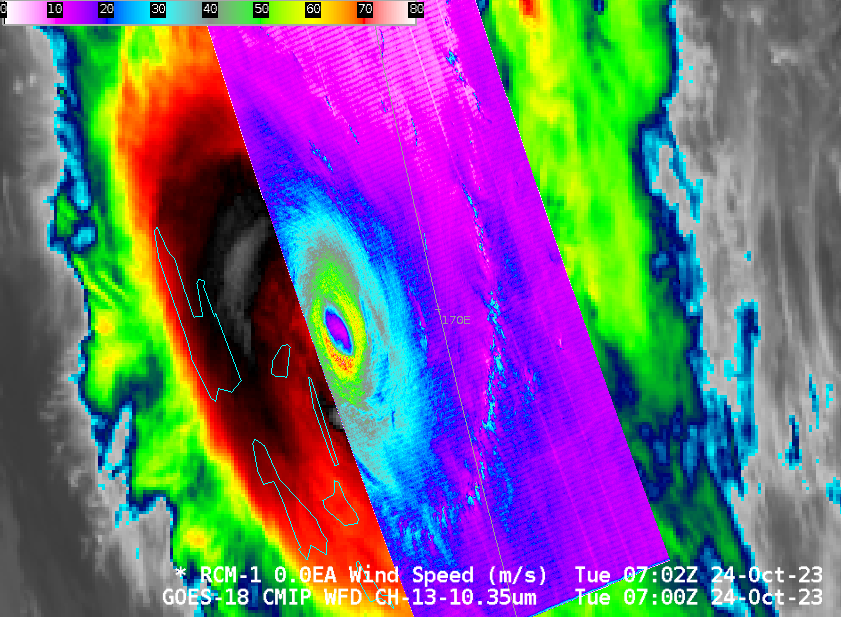
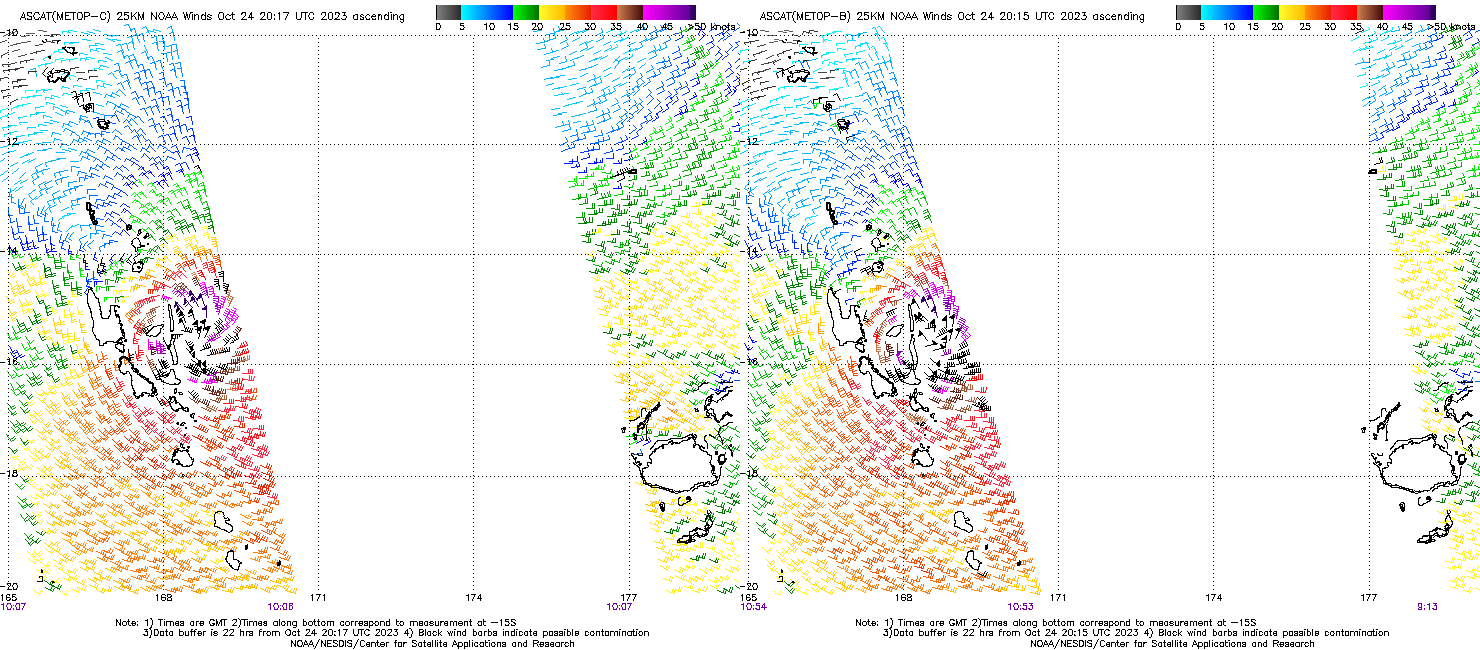
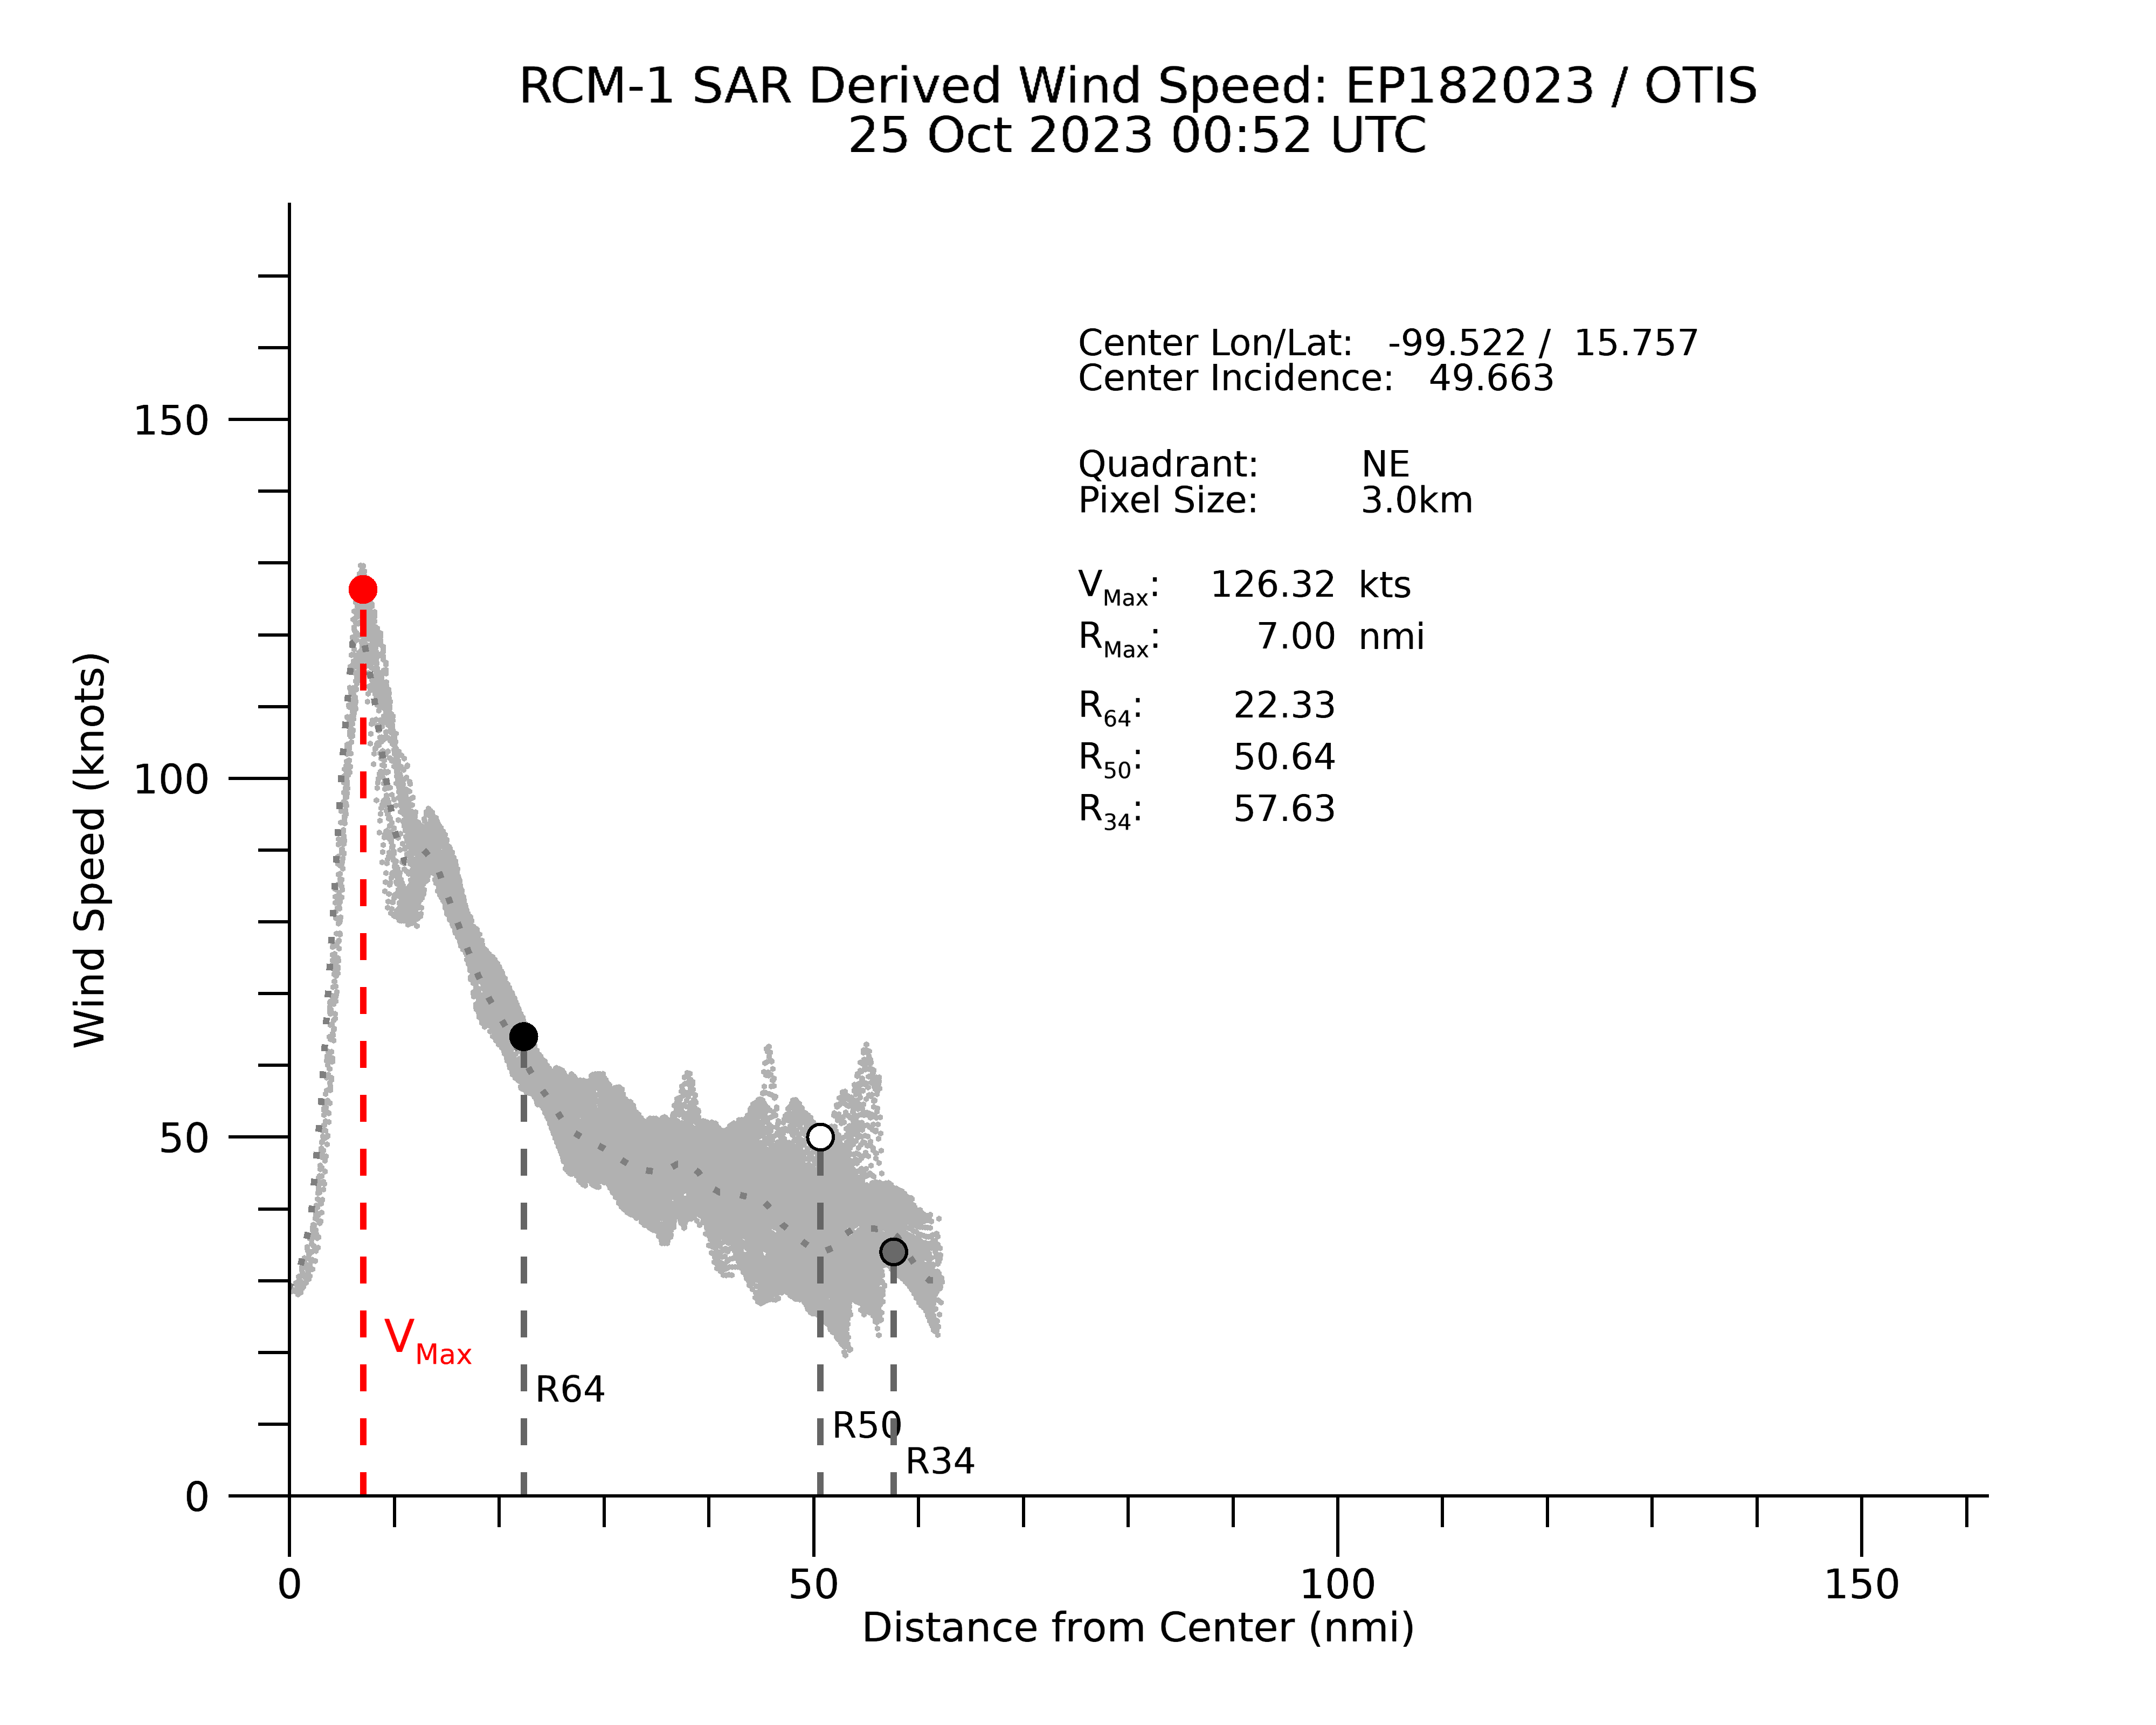
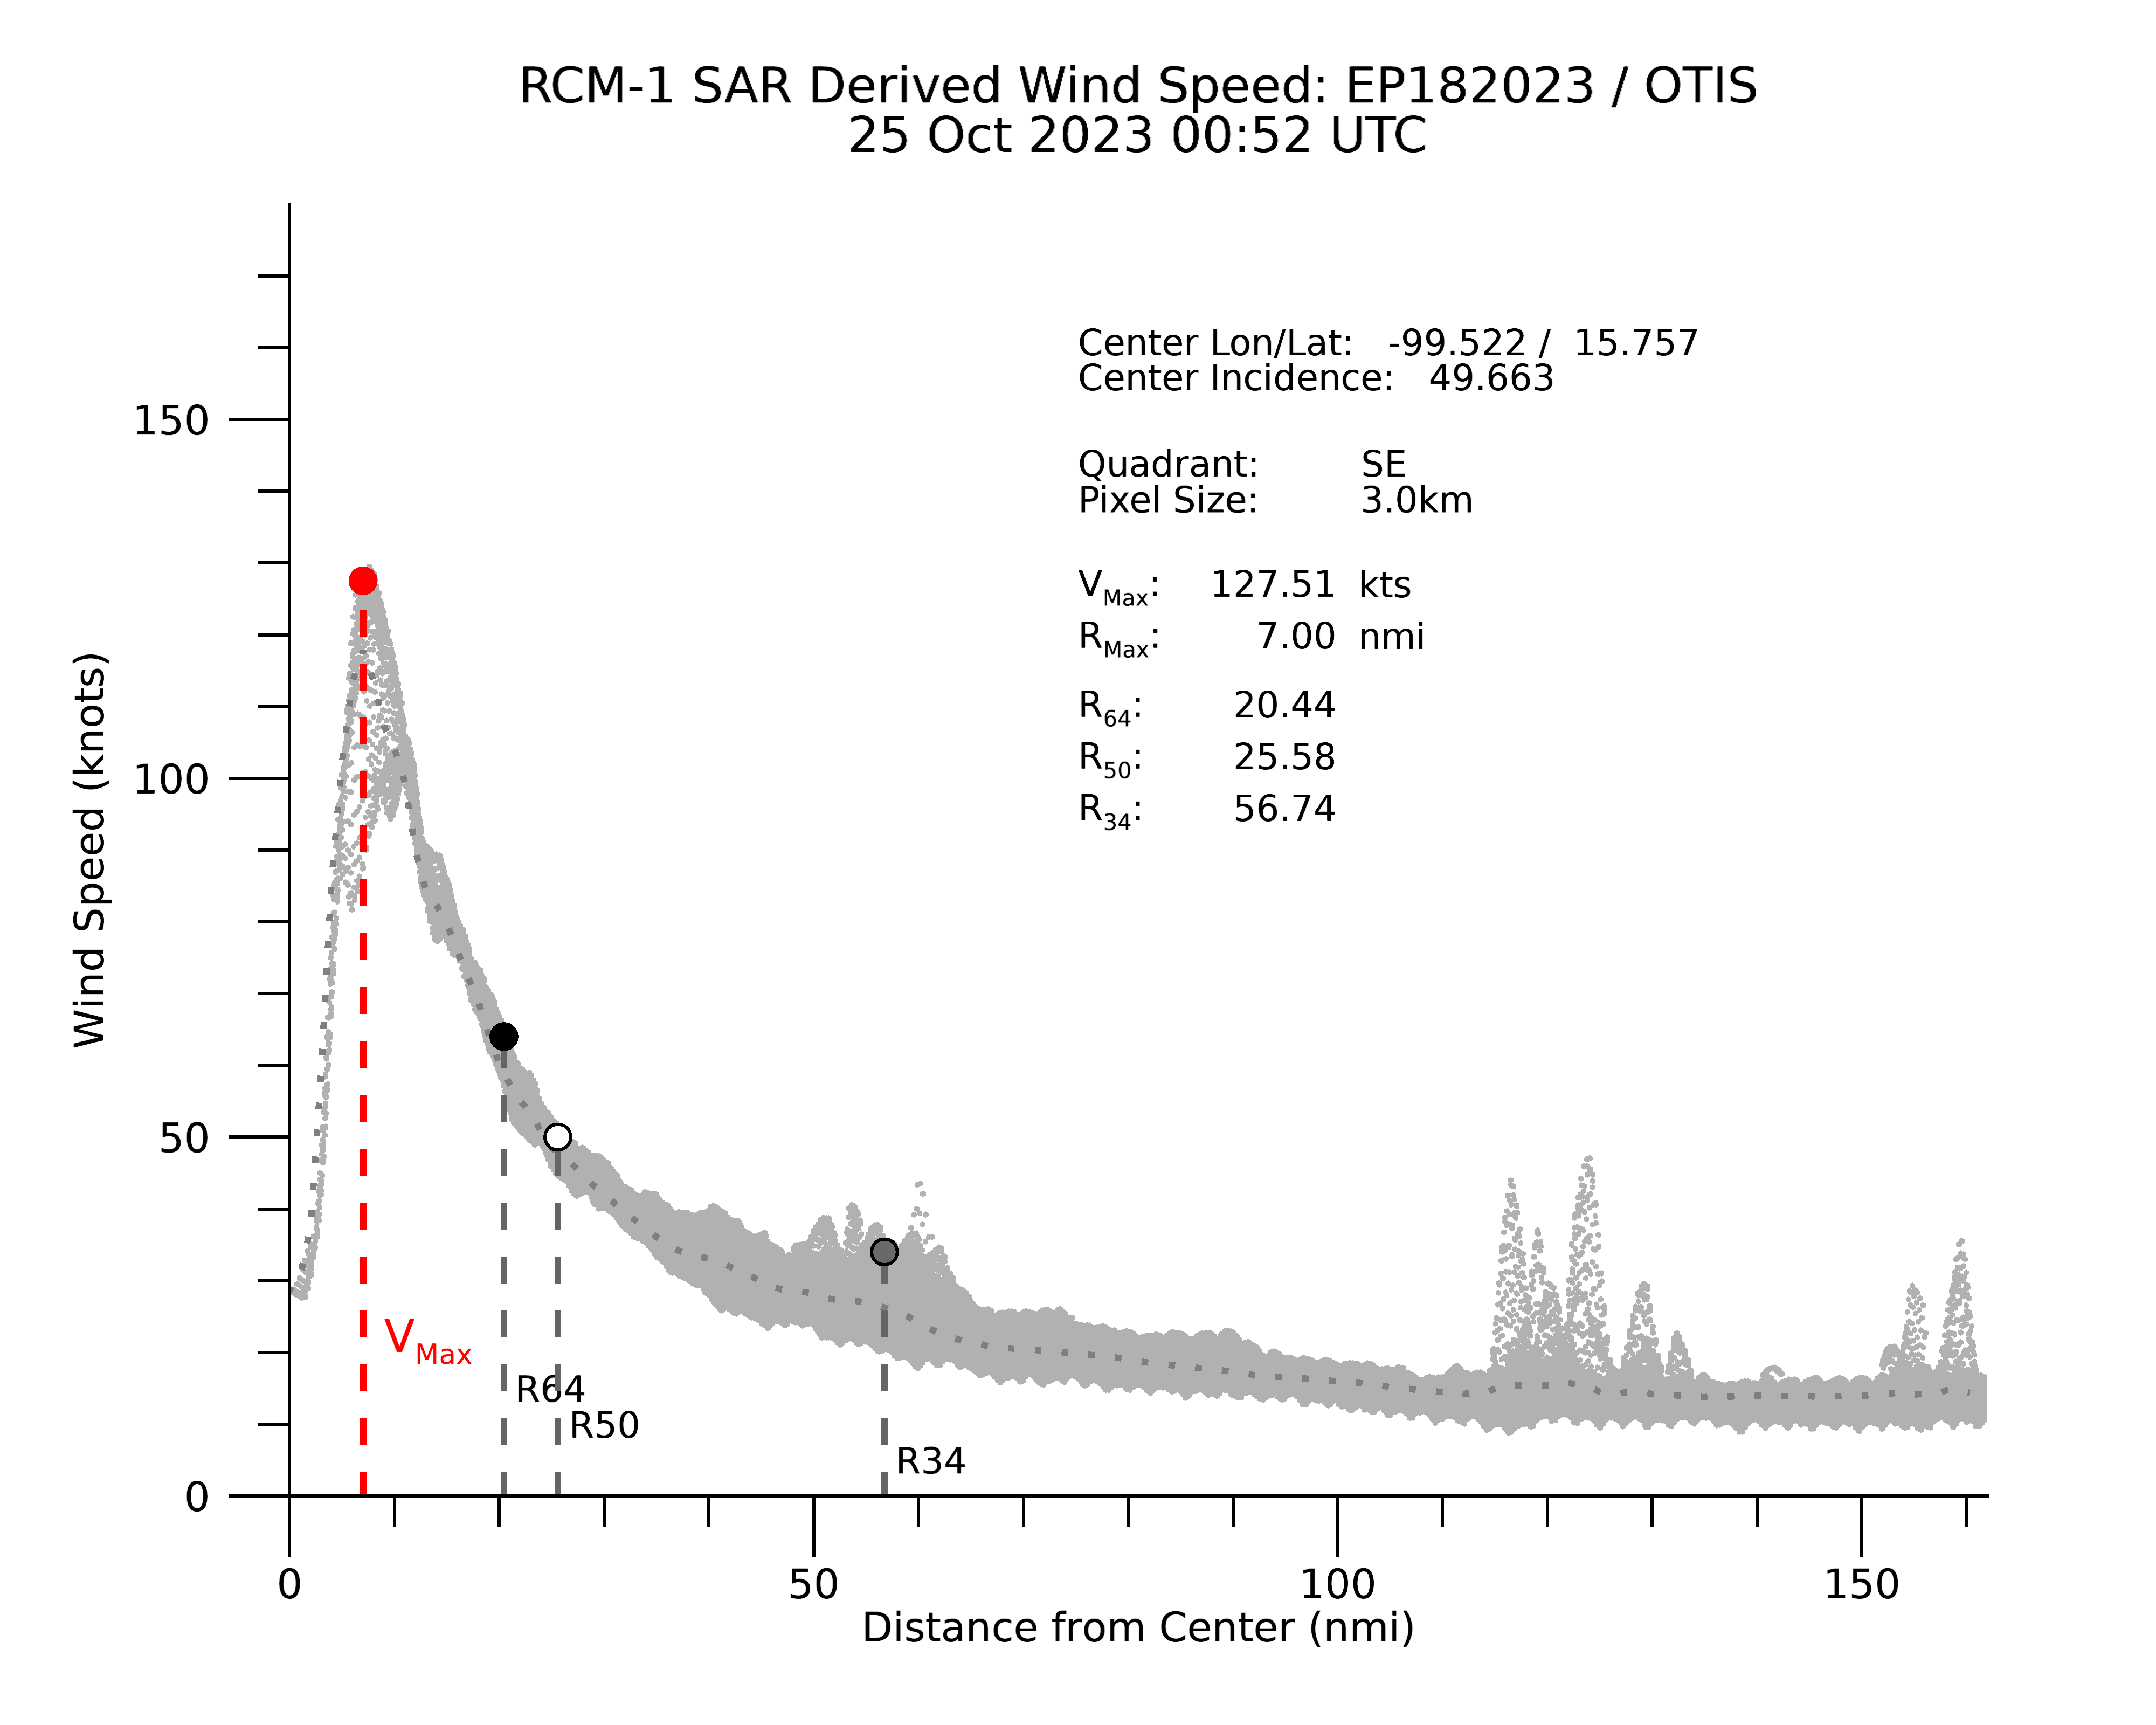
An image of RCM-1 Synthetic Aperture Radar (SAR) winds at 0052 UTC on 25 October (source) is shown below — the maximum satellite-derived wind speeds were in the northeast and southeast quadrants of the eyewall.
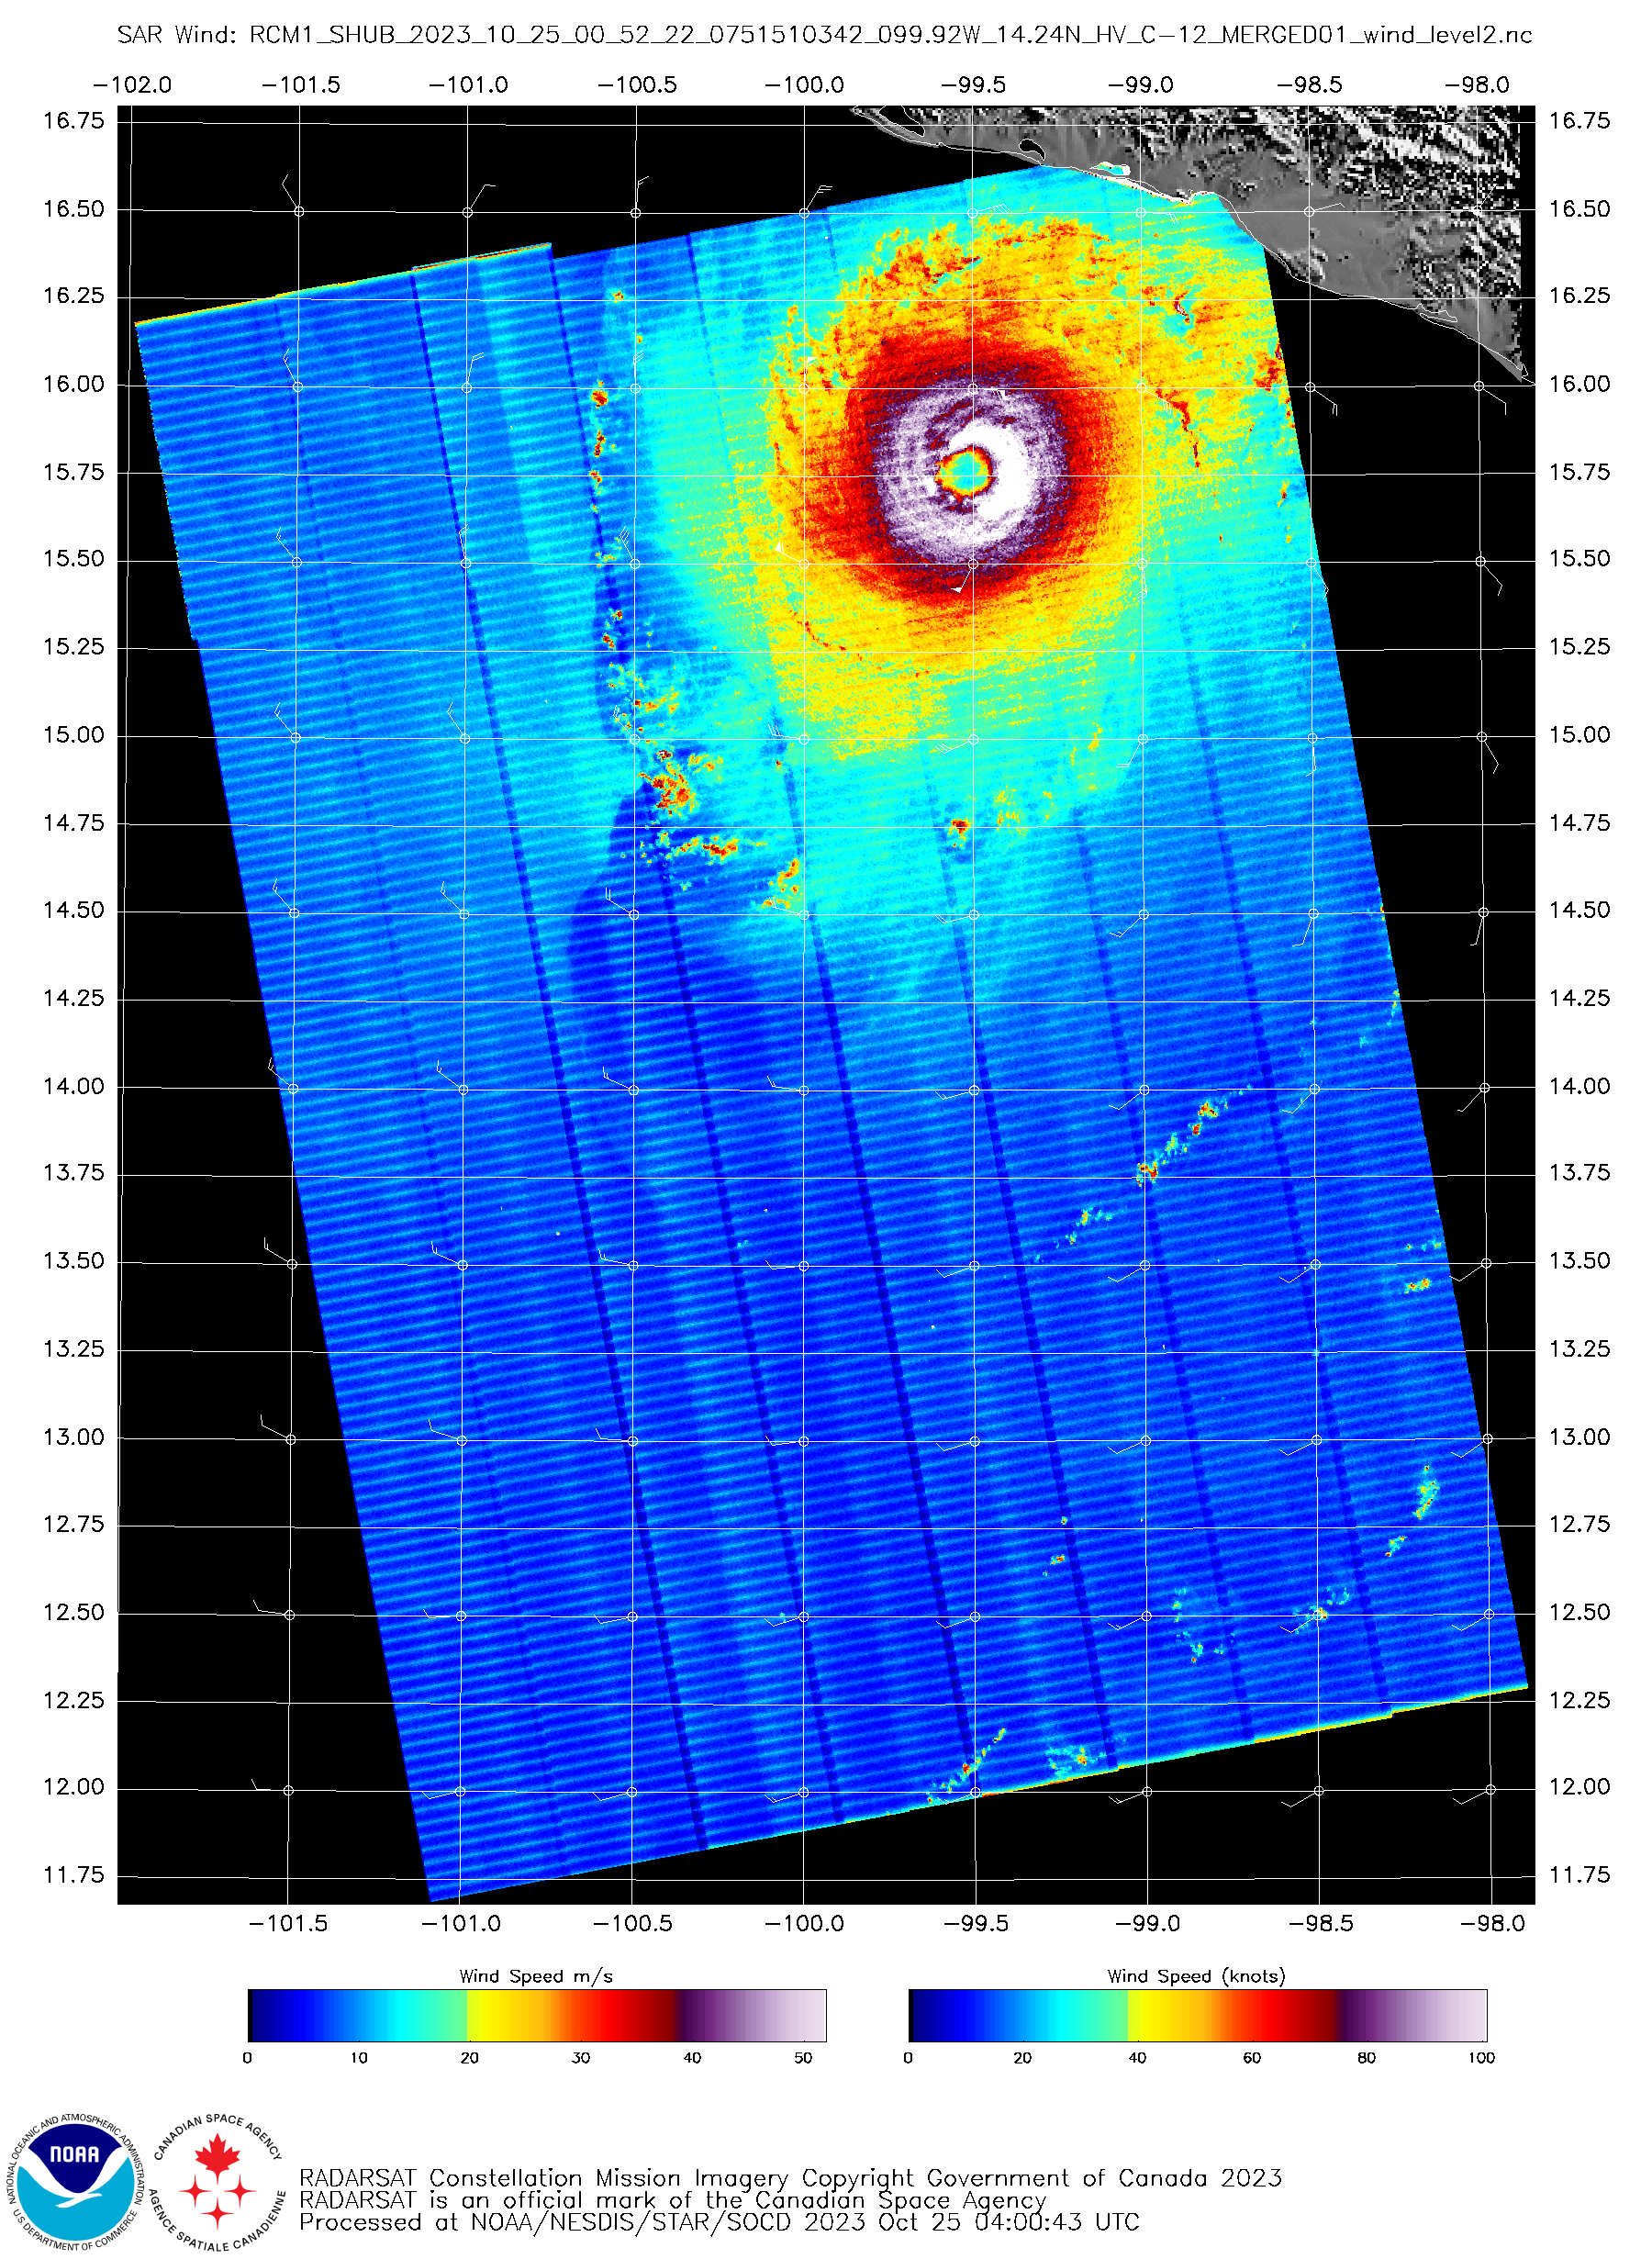
RCM-1 SAR wind speeds at 0052 UTC on 25 October [click to enlarge]
GOES-18 Water Vapor images, with contours and streamlines of deep-layer wind shear [click to enlarge]
Imagery from the CIMSS Tropical Cyclones site indicated that Otis was moving through an environment characterized by low values of deep-layer wind shear (above), and was also traversing warm water (below) — both factors that were favorable for further intensification.
Sea Surface Temperature and Ocean Heat Content on 24 October, with an overlay of the track of Otis [click to enlarge]
___________________________
GOES-18 “Clean” Infrared Window (10.3 µm) images, from 0500 UTC to 0900 UTC on 25 October [click to play animated GIF | MP4]
Around the time of landfall, Otis began to exhibit a “cloud cliff” feature that extended southward from the western edge of the eye (above). To further characterize this cloud cliff, the Cloud Top Height derived product was examined from GOES-16 (GOES-East) — using both the full-resolution (2 km) CLAVR-x version and the “legacy” 10-km resolution version that is currently distributed in AWIPS (below). It is clear that the sharp horizontal gradient associated with the cliff feature was not well resolved with the 10-km version. This unique cloud cliff feature has occasionally been seen in strong typhoons in the West Pacific — for example, Typhoon Lekima and Typhoon Neoguri.
GOES-16 “Clean” Infrared Window (10.3 µm), CLAVR-x Cloud Top Height and legacy Cloud Top Height at 0636 UTC [click to enlarge]
Cursor samples of GOES-16 infrared (10.3 µm) brightness temperature, CLAVR-x Cloud Top Height and legacy Cloud Top Height across 2 portions of the cloud cliff feature (below) indicated that the “top” of the cliff was at CLAVR-x heights of 55904-56006 ft, while the adjacent downwind “trench” dropped to CLAVR-x heights of 47774-50523 ft — the height difference between the cliff top and the adjacent trench was 8210 ft and 5483 ft at the northern and southern cursor-sampled points, respectively. In addition, the CLAVR-x product cliff top heights were 4000-5000 ft higher (and the trench heights 2000-3000 ft lower) compared to the legacy product. Thanks are extended to Joleen Feltz (CIMSS) for staging the CLAVR-x products on our local AWIPS data server, allowing this Cloud Top Height comparison to be made.
Cursor samples of GOES-16 Infrared (10.3 µm) brightness temperature (white), CLAVR-x Cloud Top Height (blue) and legacy Cloud Top Height (red) at 0636 UTC [click to enlarge]
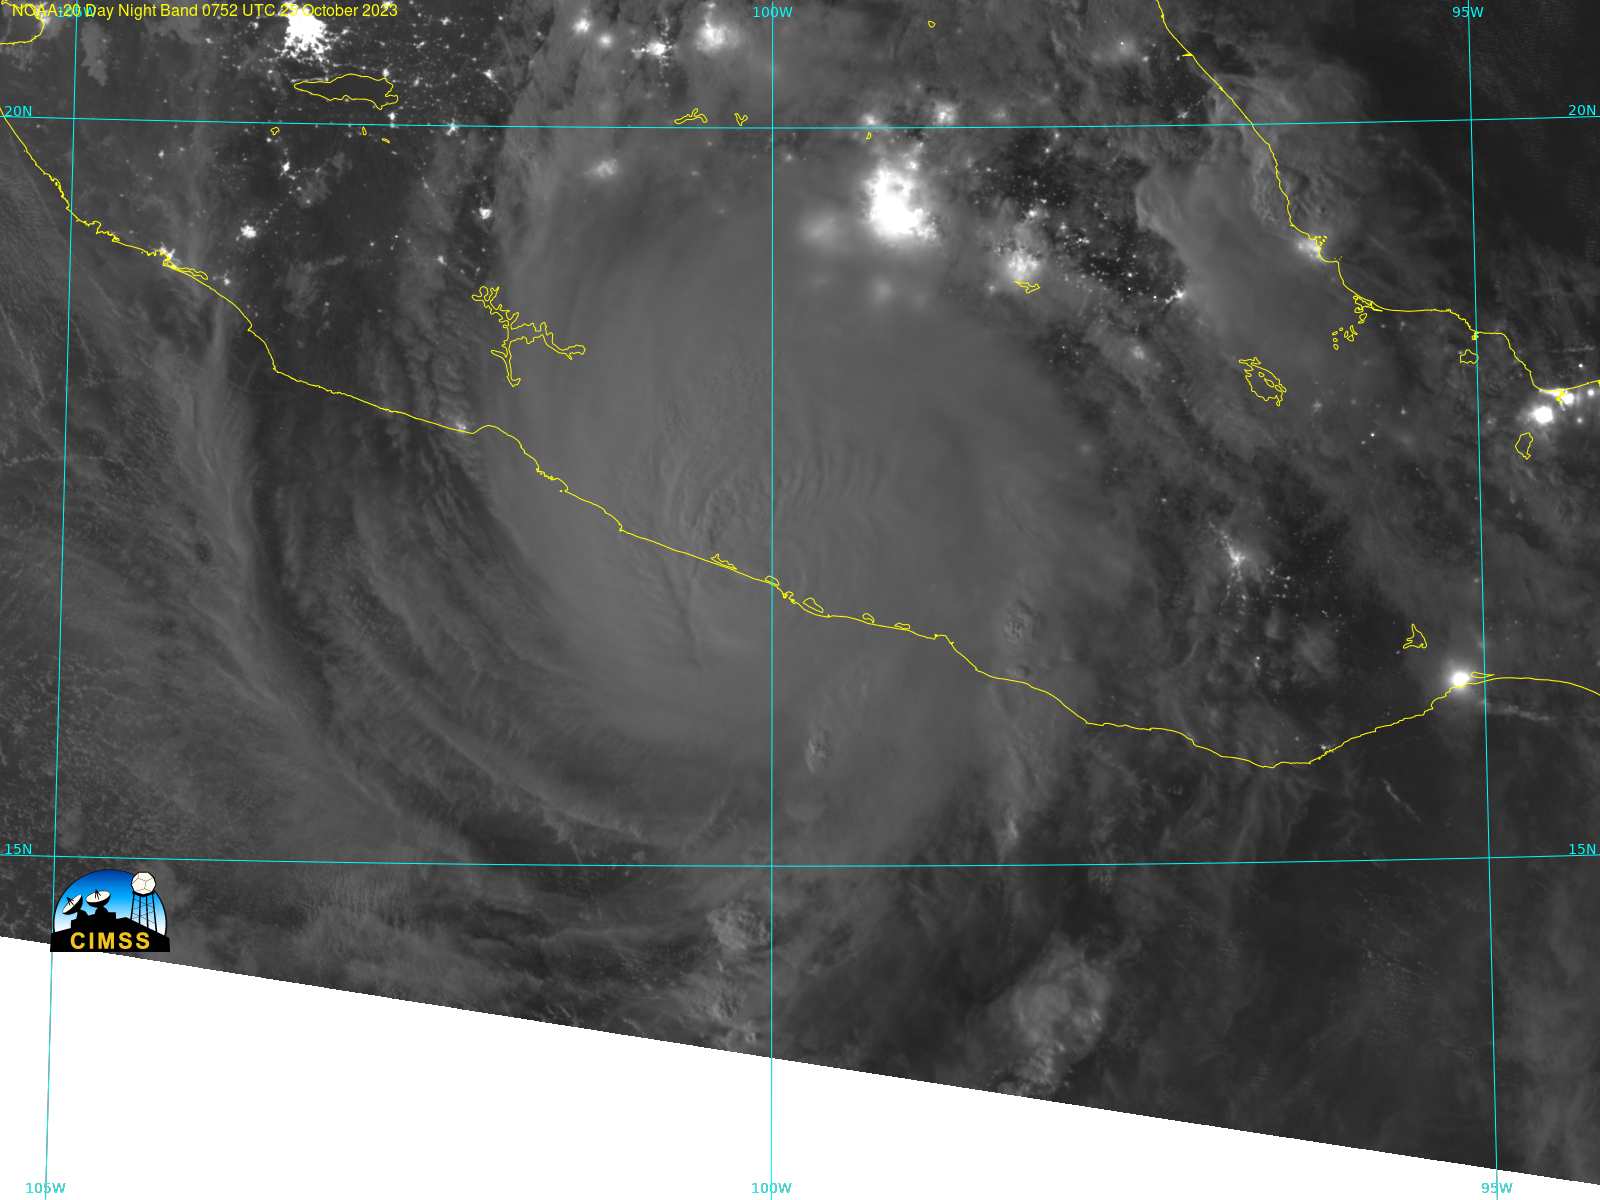
Due to ample illumination from the Moon (which was in the Waxing Gibbous phase, at 70% of Full), the trench feature was also evident just south of the Mexico coastline in a nocturnal NOAA-20 VIIRS Day/Night Band (0.7 µm) image valid at 0808 UTC on 25 October (below) — another version of the NOAA-20 image is available in this blog post; the corresponding GOES-18 Infrared image that showed the (warm) trench at that time can be seen here.
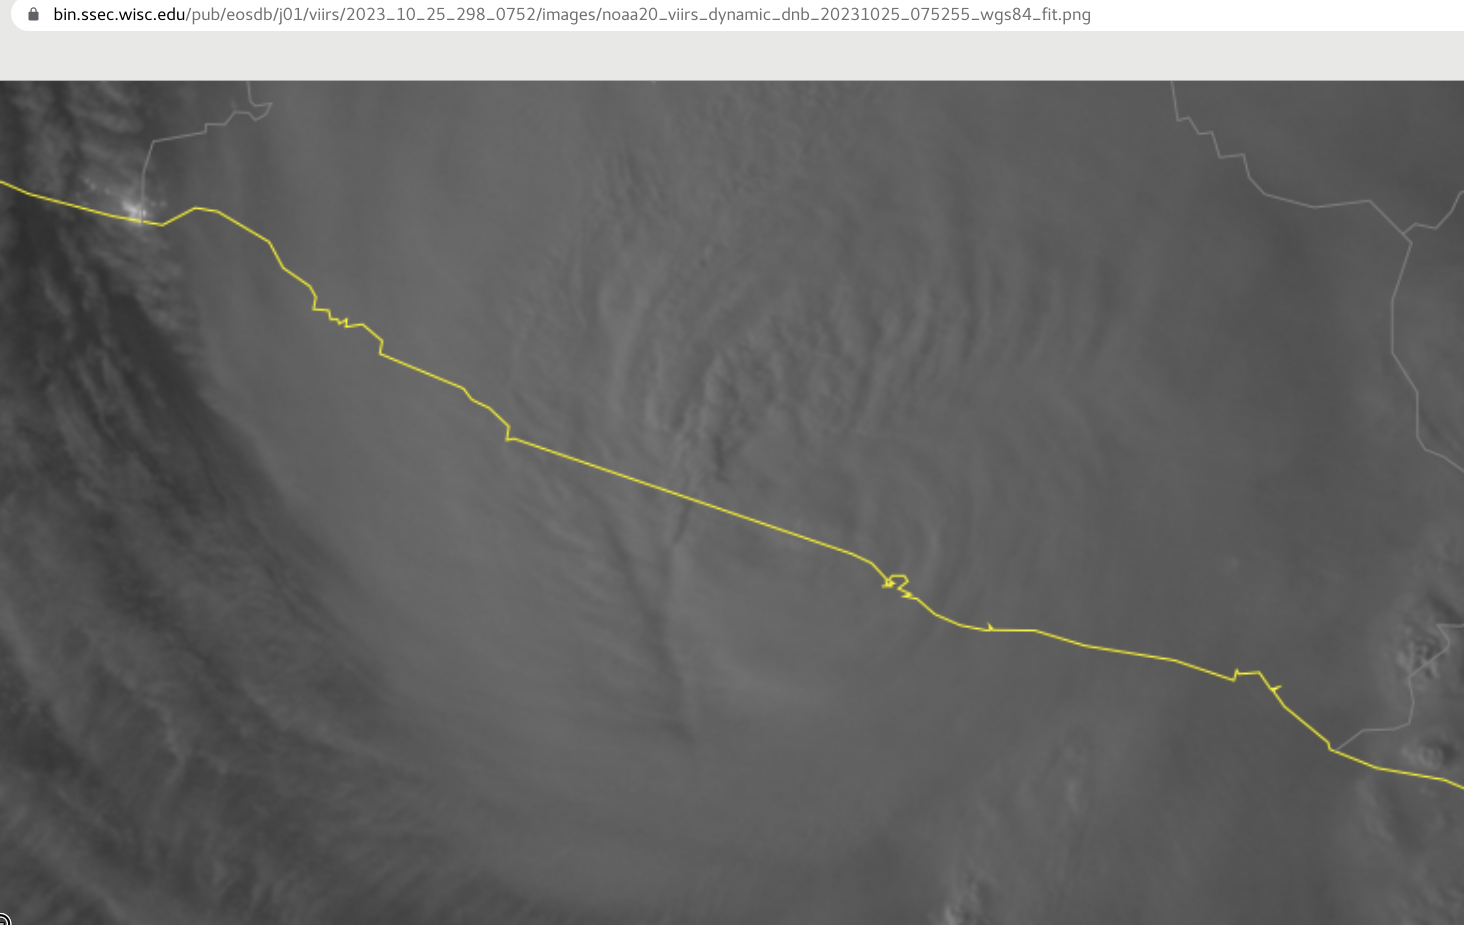
NOAA-20 VIIRS Day/Night Band (0.7 µm) image, valid at 0808 UTC on 25 October [click to enlarge]
View only this post
Read Less


