Hourly GOES-West imagery from the CSPP Geosphere site, above (direct link to animation), shows the development of a broad Kona Low over the Hawai’ian islands. MIMIC Total Precipitable Water (TPW) fields over the eastern Pacific, below, show a very moist airmass moving into the eastern Hawai’ian islands as the Kona low develops to the west. The OSPO Percent of Normal fields at 1200 UTC on the 29th (here), show values >150% of normal throughout the Hawai’ian island chain. The next few days will be wet in Hawai’i — the entire state is under either Flood Watches or Flood Advisories.
Airmass RGB imagery, below, from GOES-18 shows the dark green coloration that is characteristic of deep tropical moisture to the south of Hawai’i. The developing Kona Low, to the west of Kauai, is surrounded by air rich in potential vorticity, as suggested by the orange tint in the RGB. The developing low is also cut off from the main belt of westerlies that are north of 40oN Latitude.
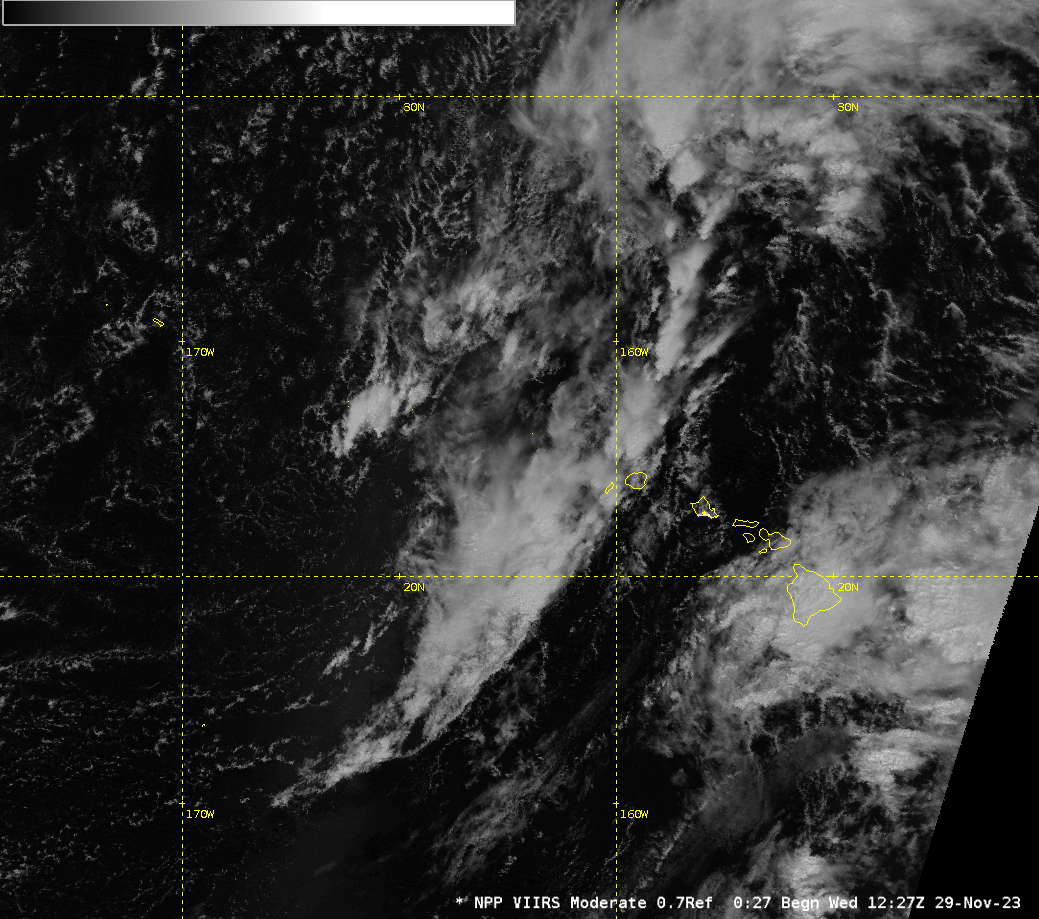
NOAA-20 overflew the Hawai’ian island chain around 0000 and 1200 UTC on 29 November. The near-full Moon on the 29th provided ample illumination for the Day Night Band imagery, shown below. A developing low is obvious to the west of Kauai, and convective clouds associated with rich moisture shown in the MIMIC animation above is apparent over the Hawai’i.

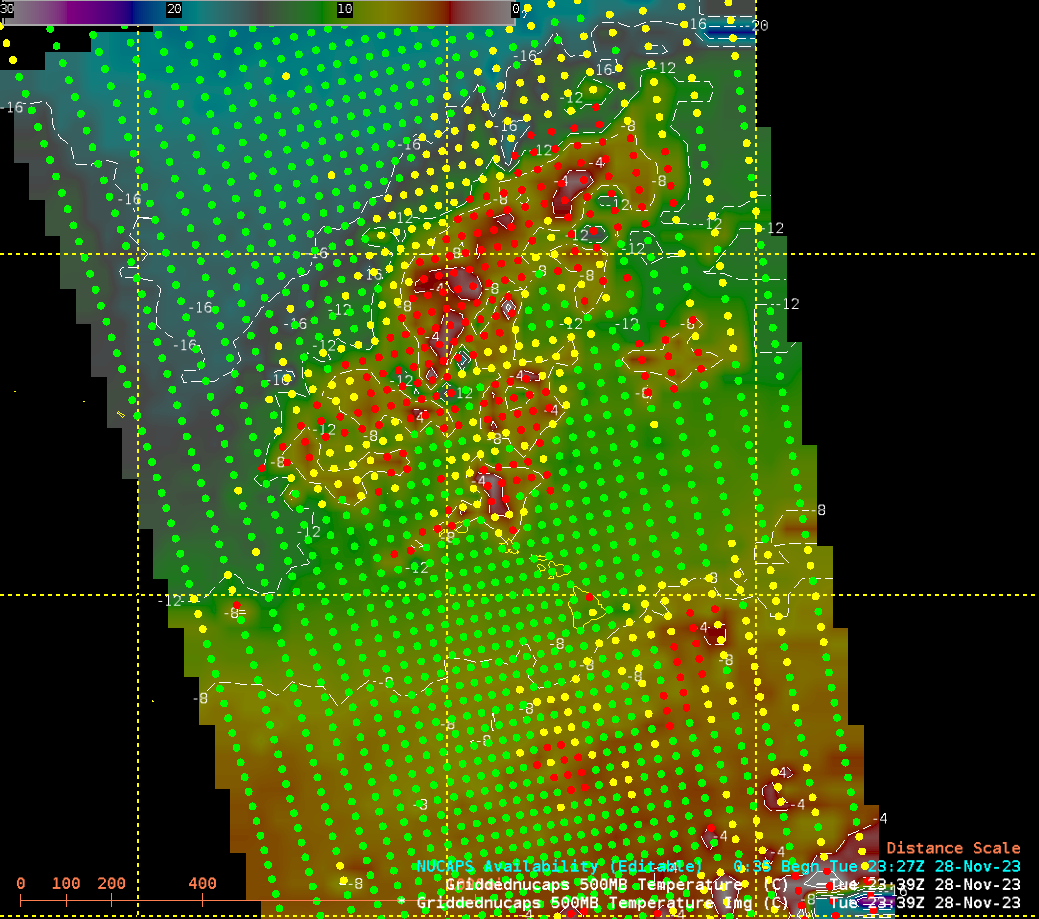
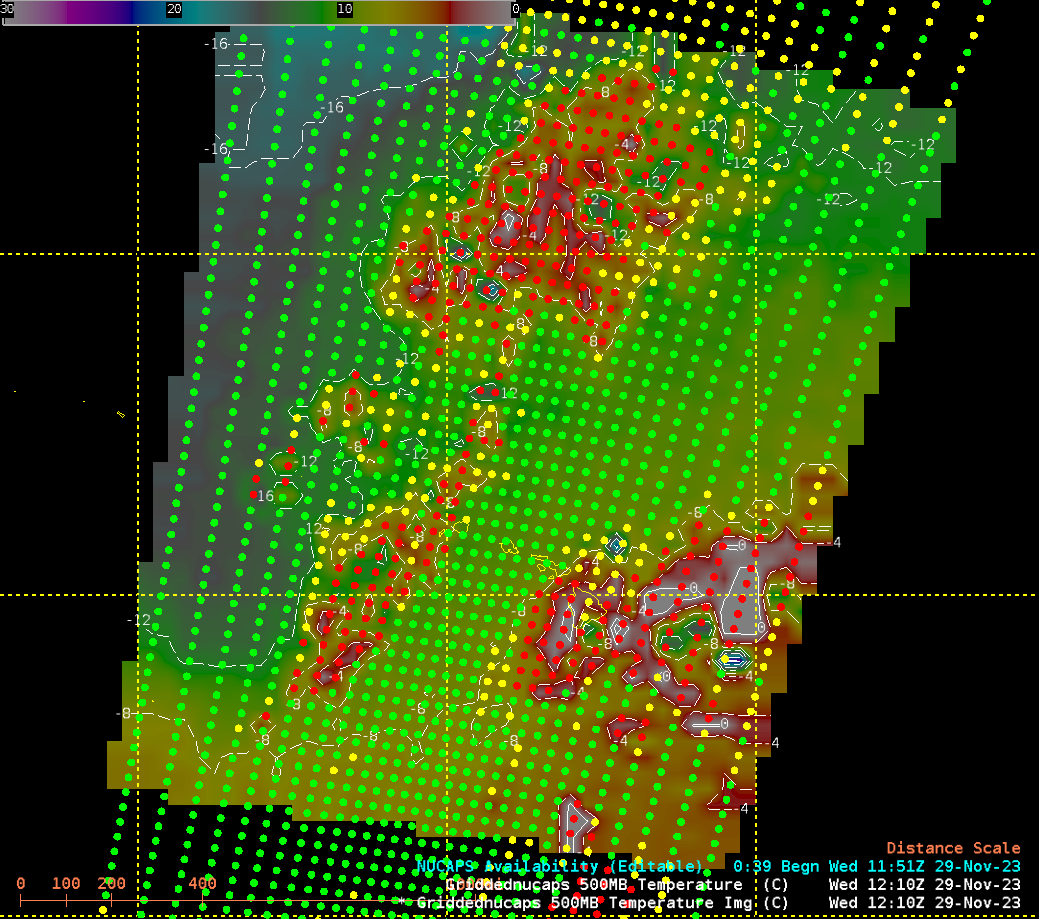
NUCAPS data from two sequential NOAA-20 overpasses can be used to assess how the atmosphere is changing. The toggle below compares NUCAPS’ estimate of 500-mb temperature at 2339 UTC on the 28th and 1210 UTC on the 29th. The -12oC isotherm moves south during these 12 hours although the -16oC isotherm retreats northward.
The toggle below compares NUCAPS profiles near 20 N, 166 W. Significant upper-tropospheric cooling is apparent between 2345 UTC on 28 November and 1214 UTC on 29 November!
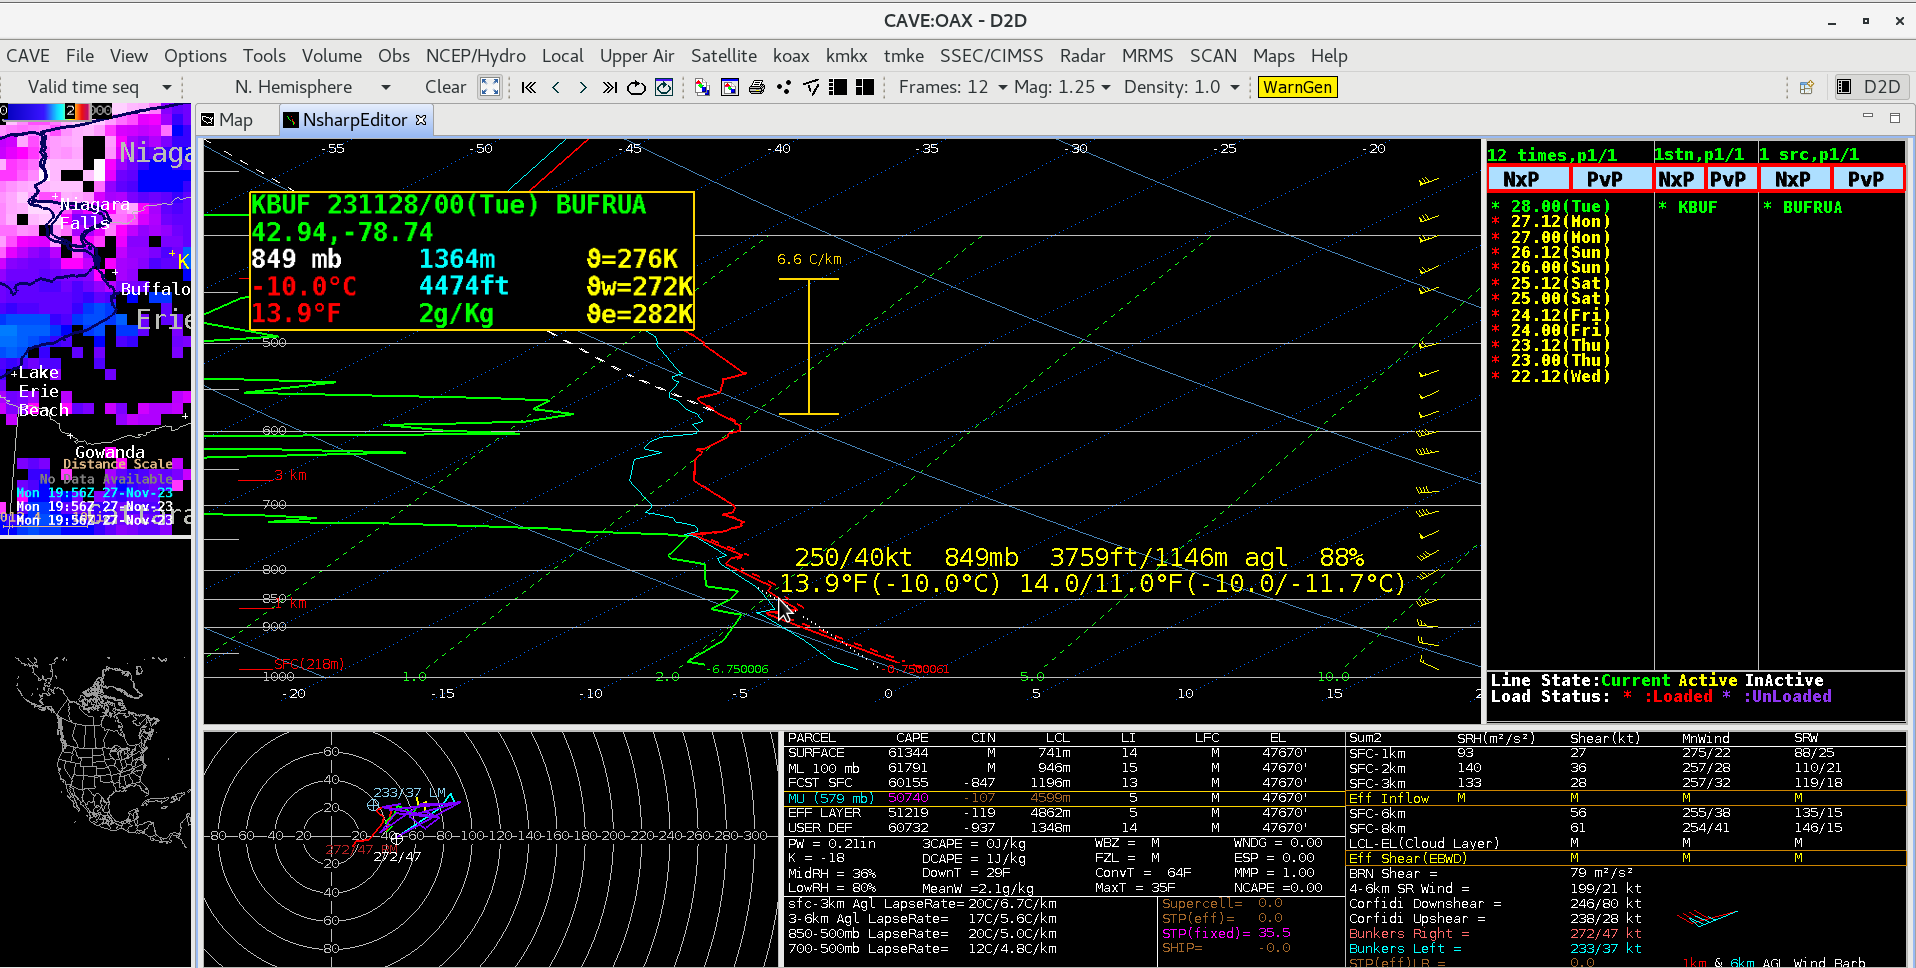
The 0000 and 1200 UTC soundings at Lihue, below, also show cooling in mid-levels during the 12 hours.
The Direct Broadcast antenna in Honolulu (link) is a useful source for microwave estimates for rainrate derived from polar orbiting satellite for systems affecting Hawai’i. The toggle below shows rainrate from MetopC (0744 UTC) and NOAA-20 (1208 UTC); heavy rain has moved onto the Big Island from the southeast, and it is slowly approaching Kauai from the west
For more information on this wet event, refer to the National Weather Service office in Honolulu.
View only this post Read Less

