A selection of several GOES ABI loops during 2022 showcased the diverse range of features observed, which included volcanic ash plumes, hurricanes, convection, fog, smoke, fires, dust and ice.
It’s very hard to choose just one event from every month of the year, but the goal here is to show a variety of phenomena and locations that NOAA‘s GOES ABI routinely monitors, in this case during 2023. Most loops generated are from the University of Wisconsin-Madison CIMSS Satellite Blog, which is linked to in the titles at the top of each monthly entry. Imagery from GOES-16 and -18 is showcased, along with the sectors it scans: Full Disk (10-min intervals), Contiguous U.S. (5-min intervals) and Mesoscale sectors (30-sec to 1-min intervals).
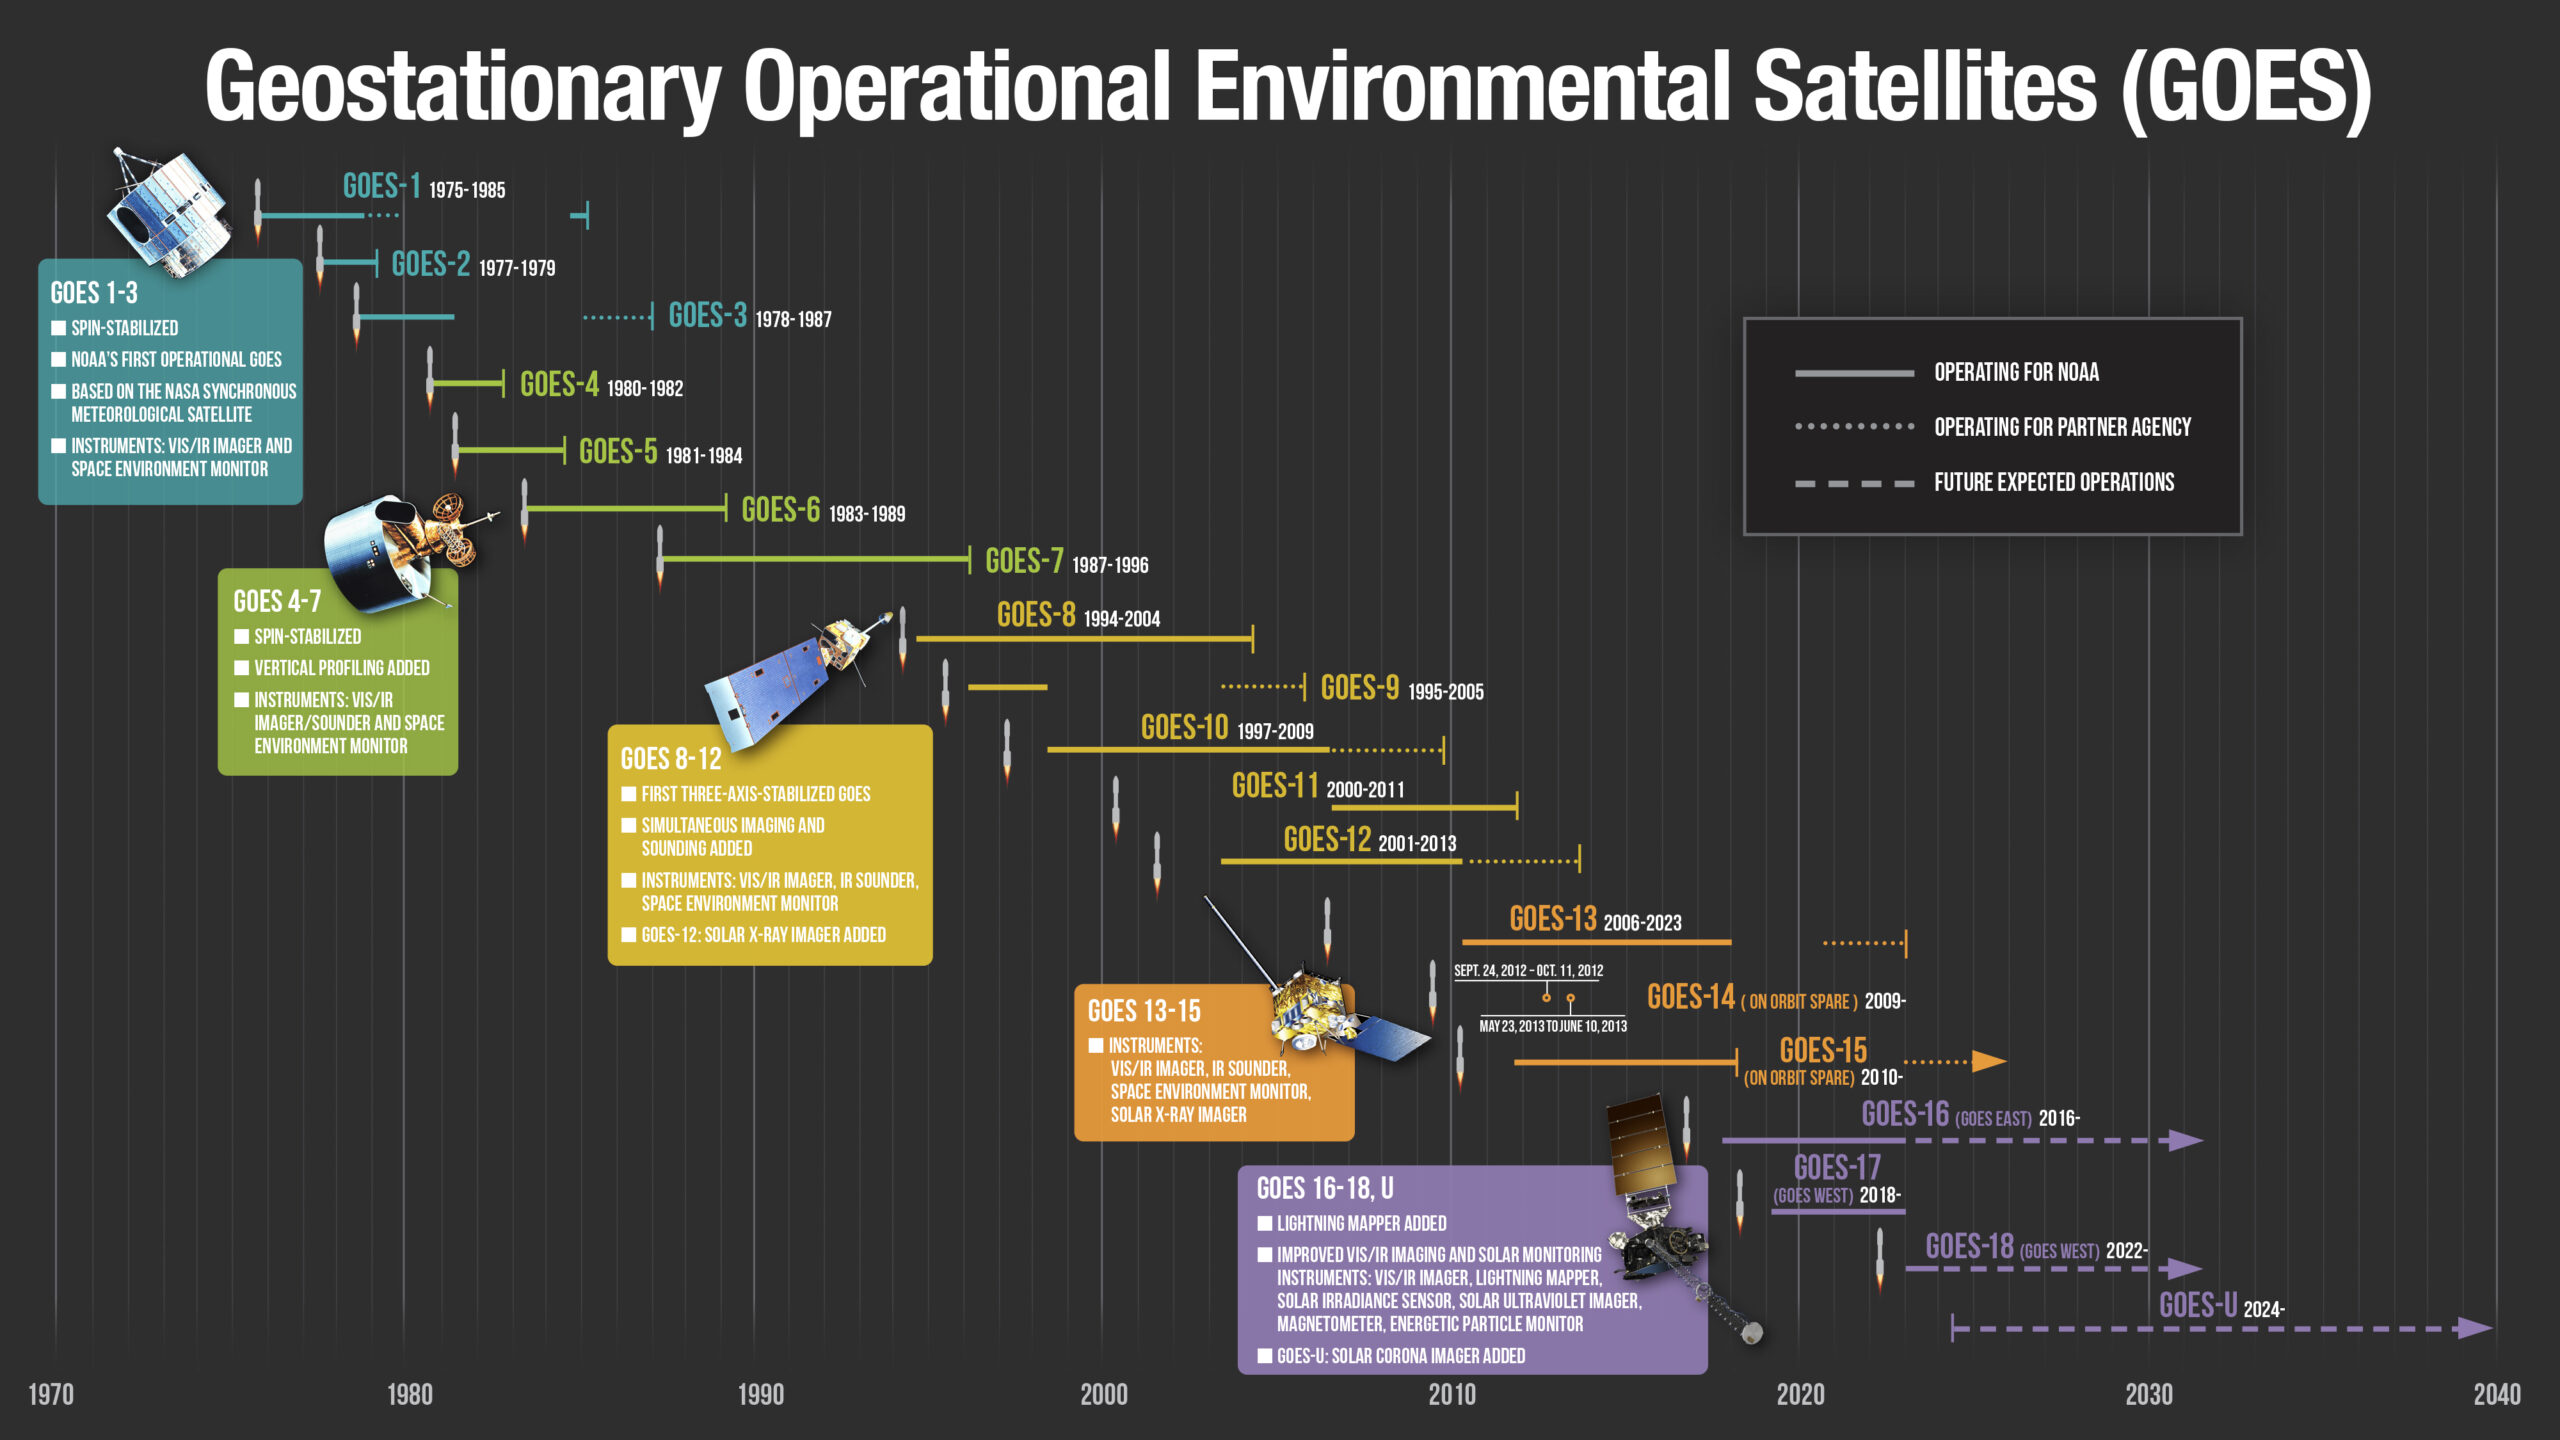
January GOES-18 Operational
While the ABI on GOES-18 was earlier used operationally, it was deemed operational on January 4, 2023.

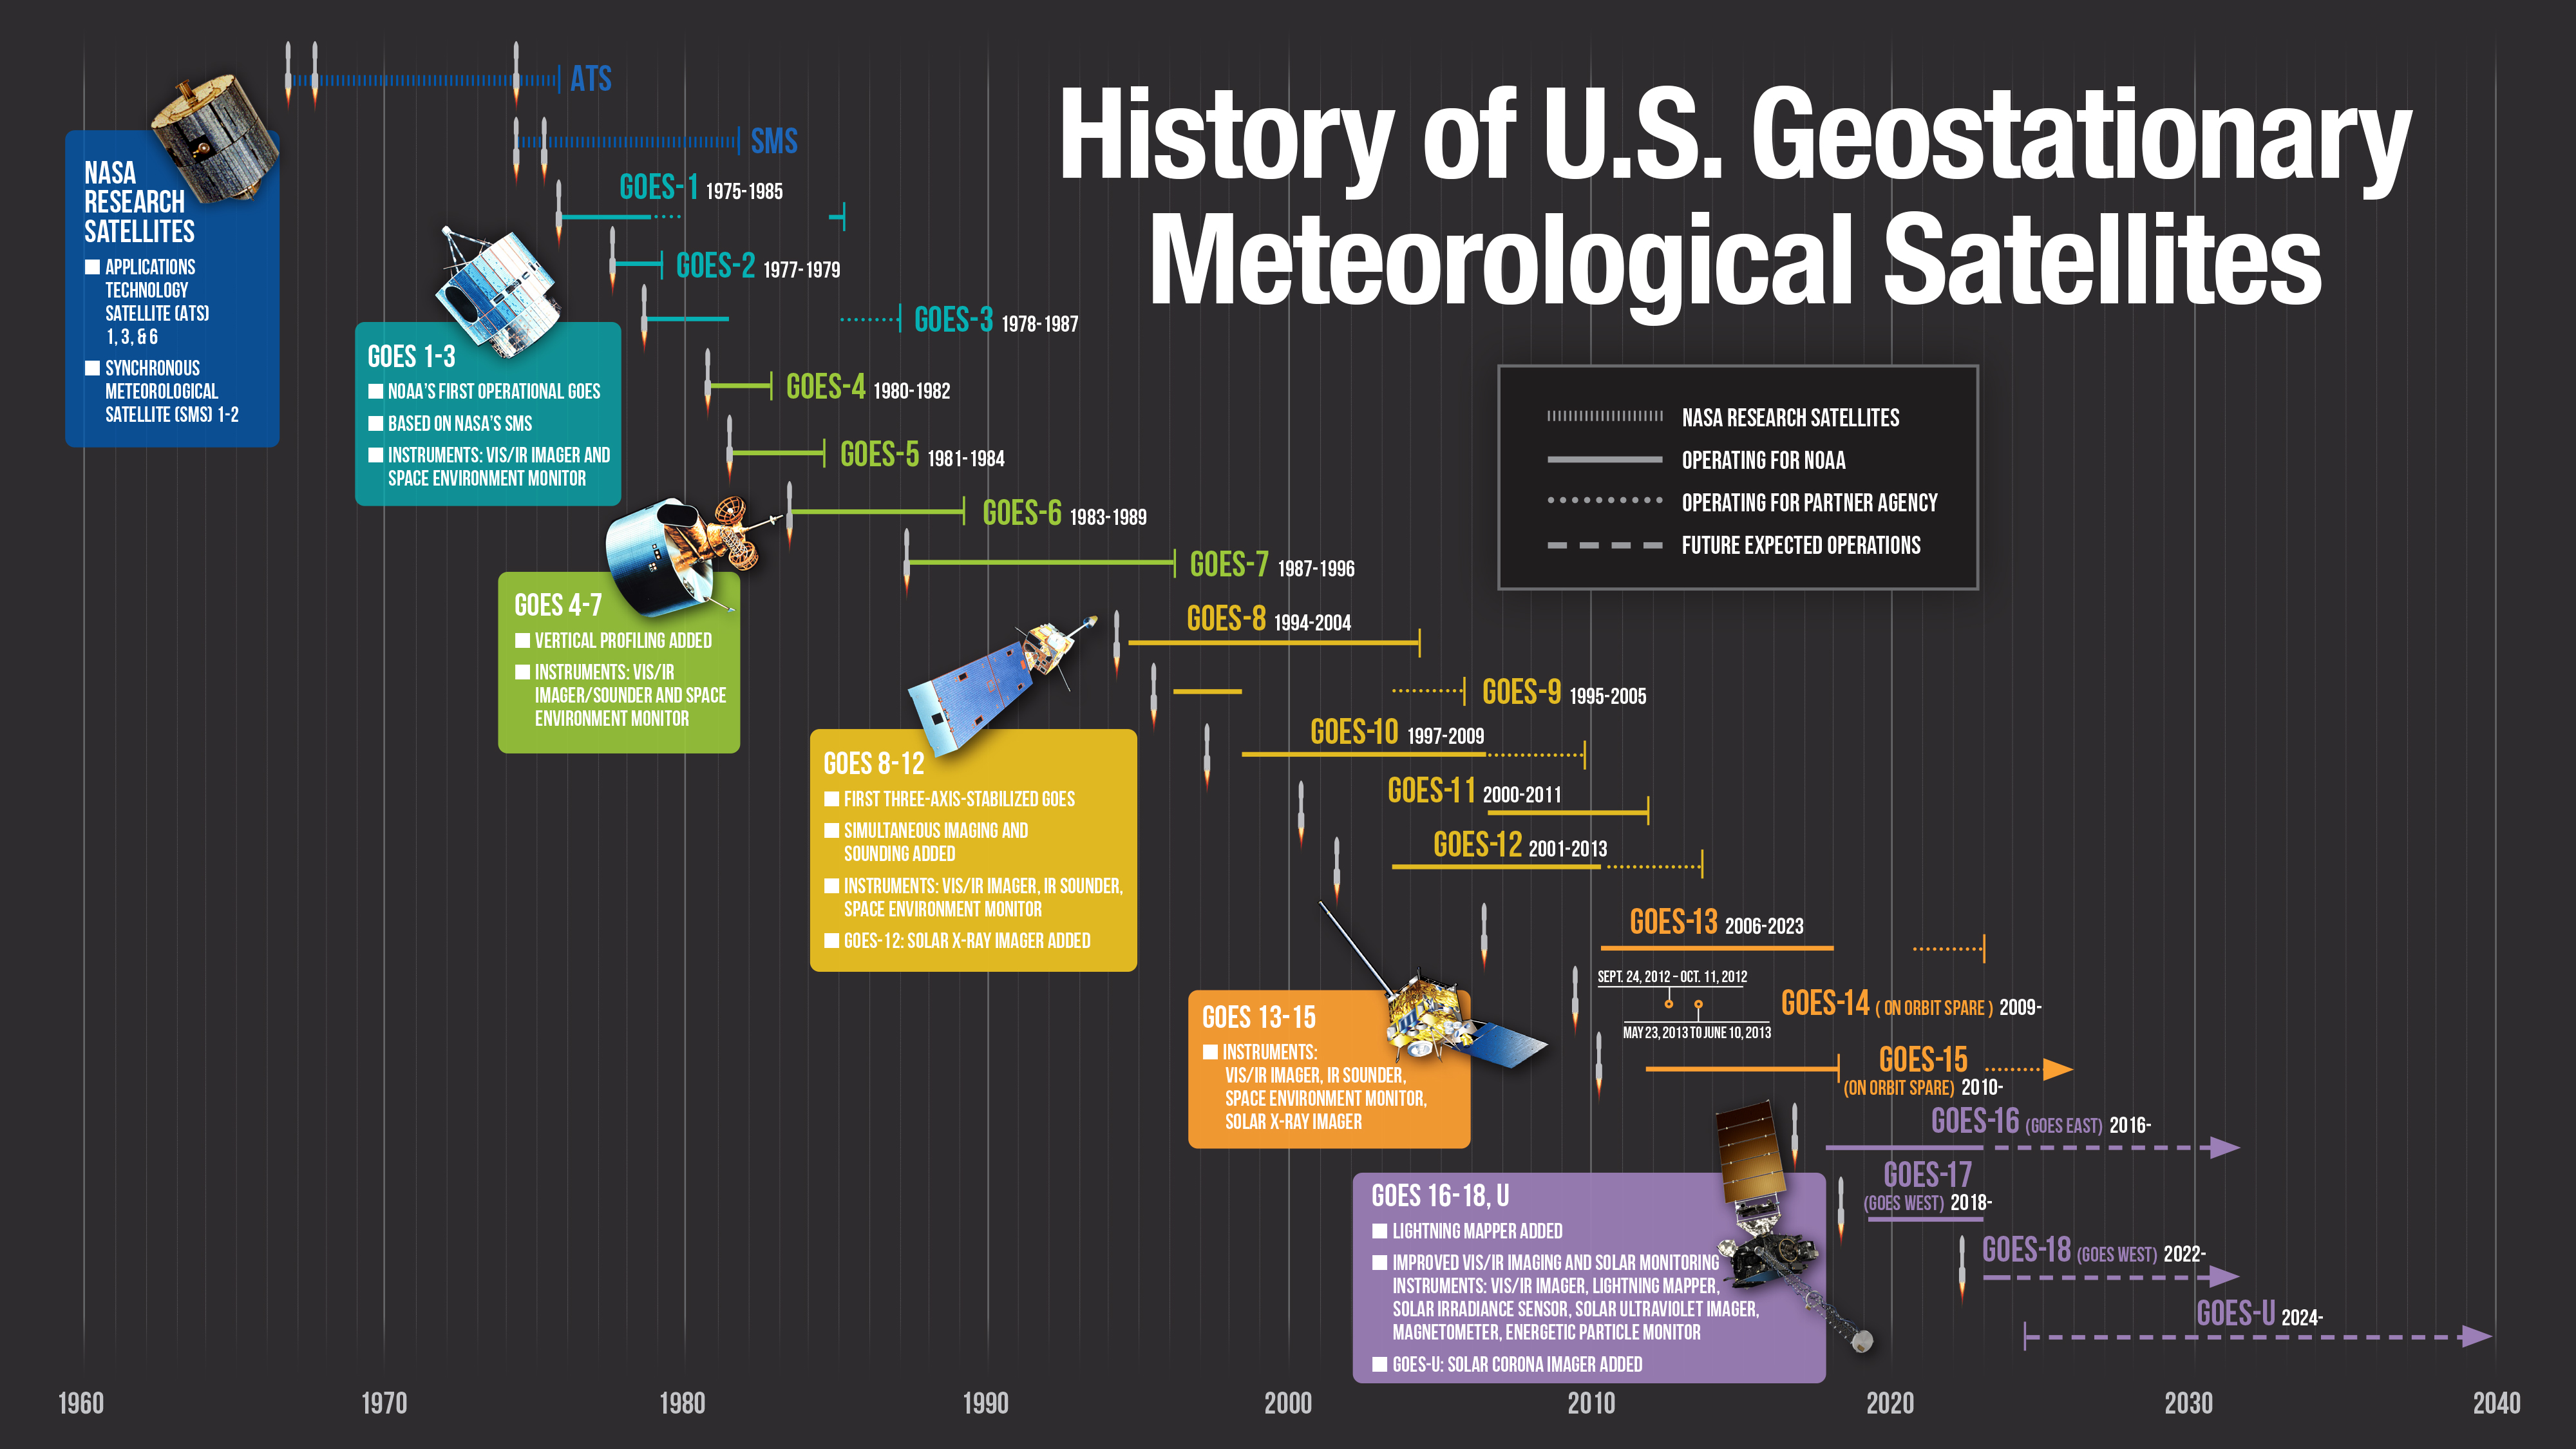
A similar timeline as above, but also including the experimental, pre-GOES, the ATS and SMS series. Note that GOES-15 is now operating as the U.S. Space Forces EWS-G2.
Bonus material: Widespread fog/stratus over snow cover across the Northern Plains
A sequence of GOES-16 (GOES-East) “Red” Visible (0.64 µm), Day Cloud Phase Distinction RGB and Day Snow-Fog RGB images (above) showed widespread fog/stratus across parts of Montana, North/South Dakota and Minnesota during the day on 06 January 2023.
February Blowing dust
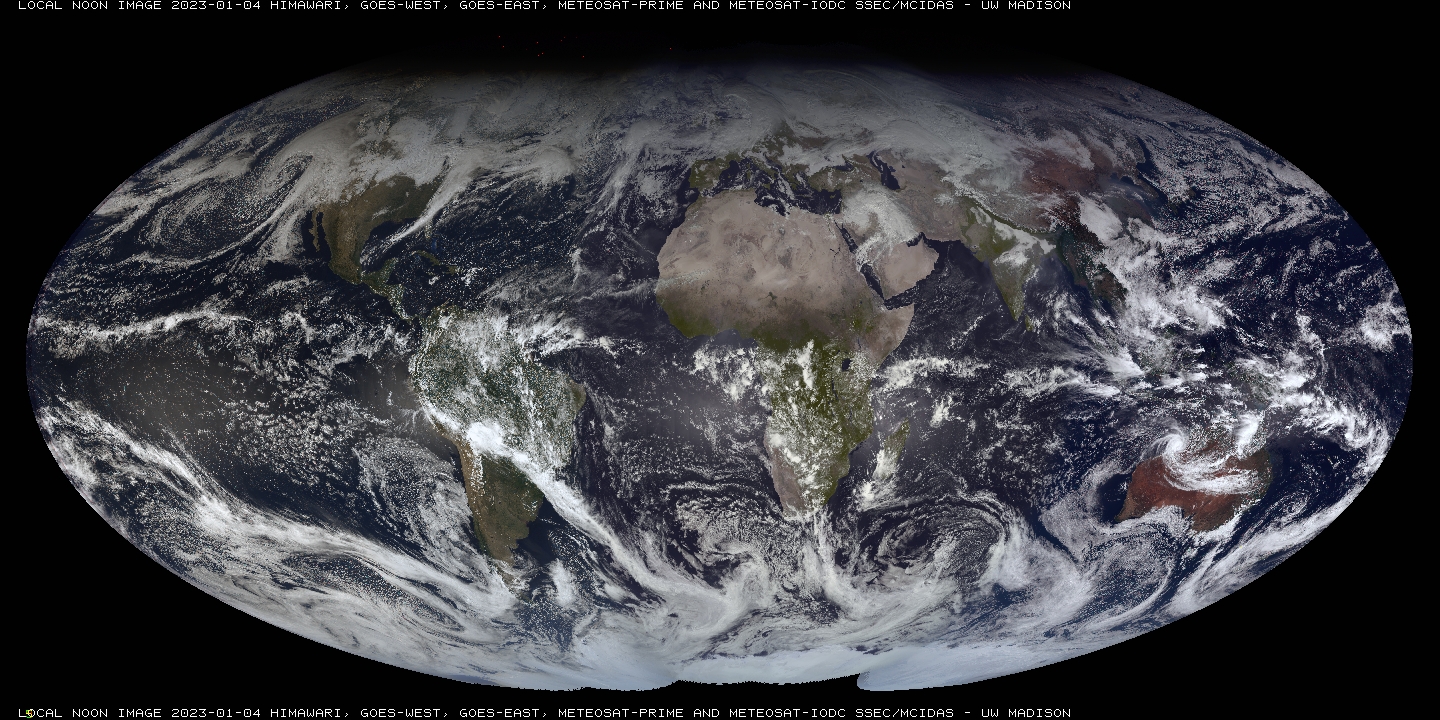
March Equinox: Fall 2022 to Spring 2023 as seen by GOES
11 UTC loops from the (northern hemisphere) fall Equinox to the Spring Equinox. These posted GOES ABI Full Disk imagery are only showing a small number of the pixels, for a fuller resolution image at one time (20-March-2023).
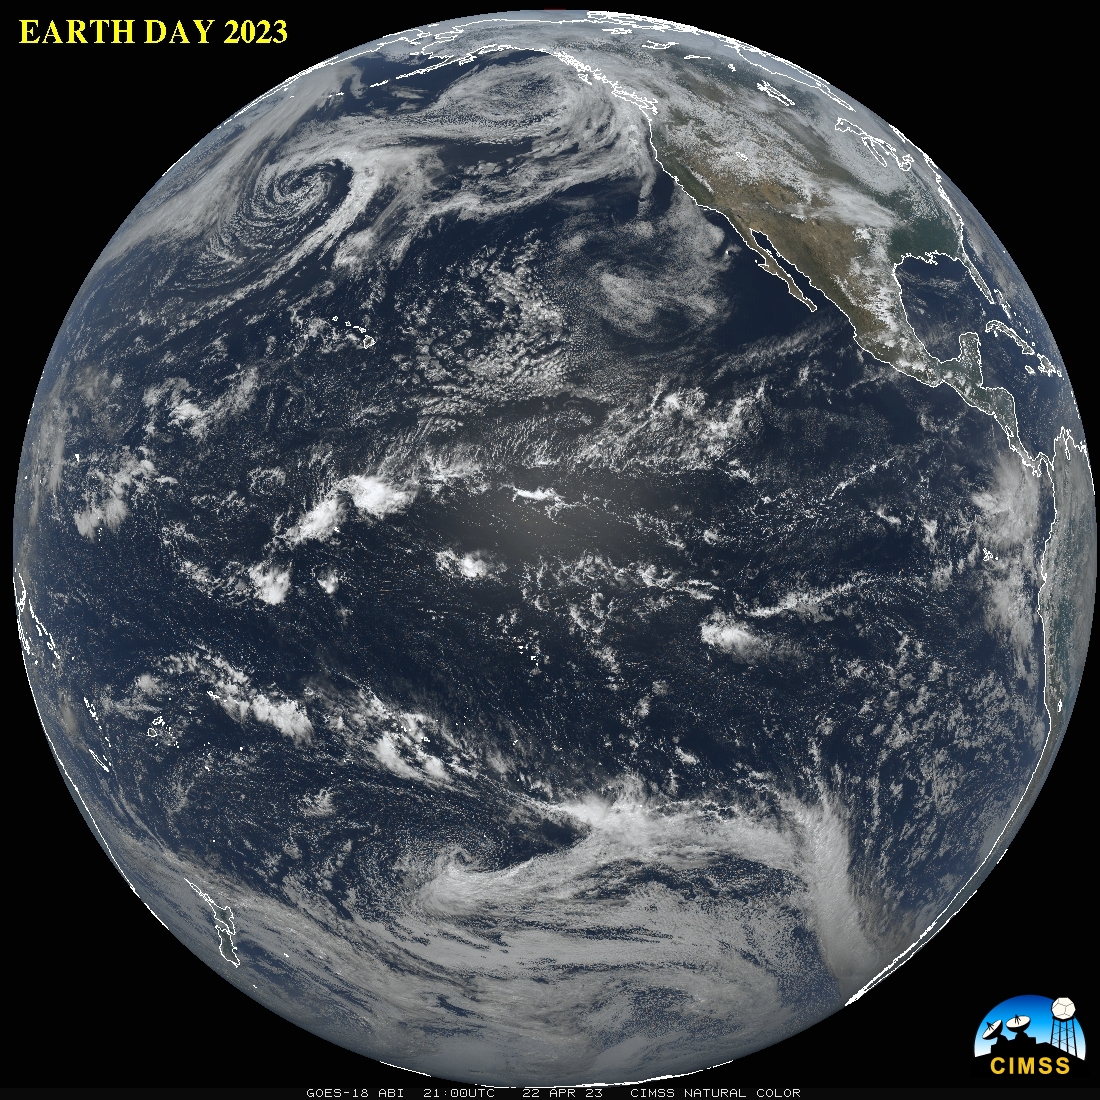
April Earth Day
Bonus material: Will it be Cloudy on April 8th (2024)?
Bonus material: ProbSevere in the Oklahoma severe-weather outbreak
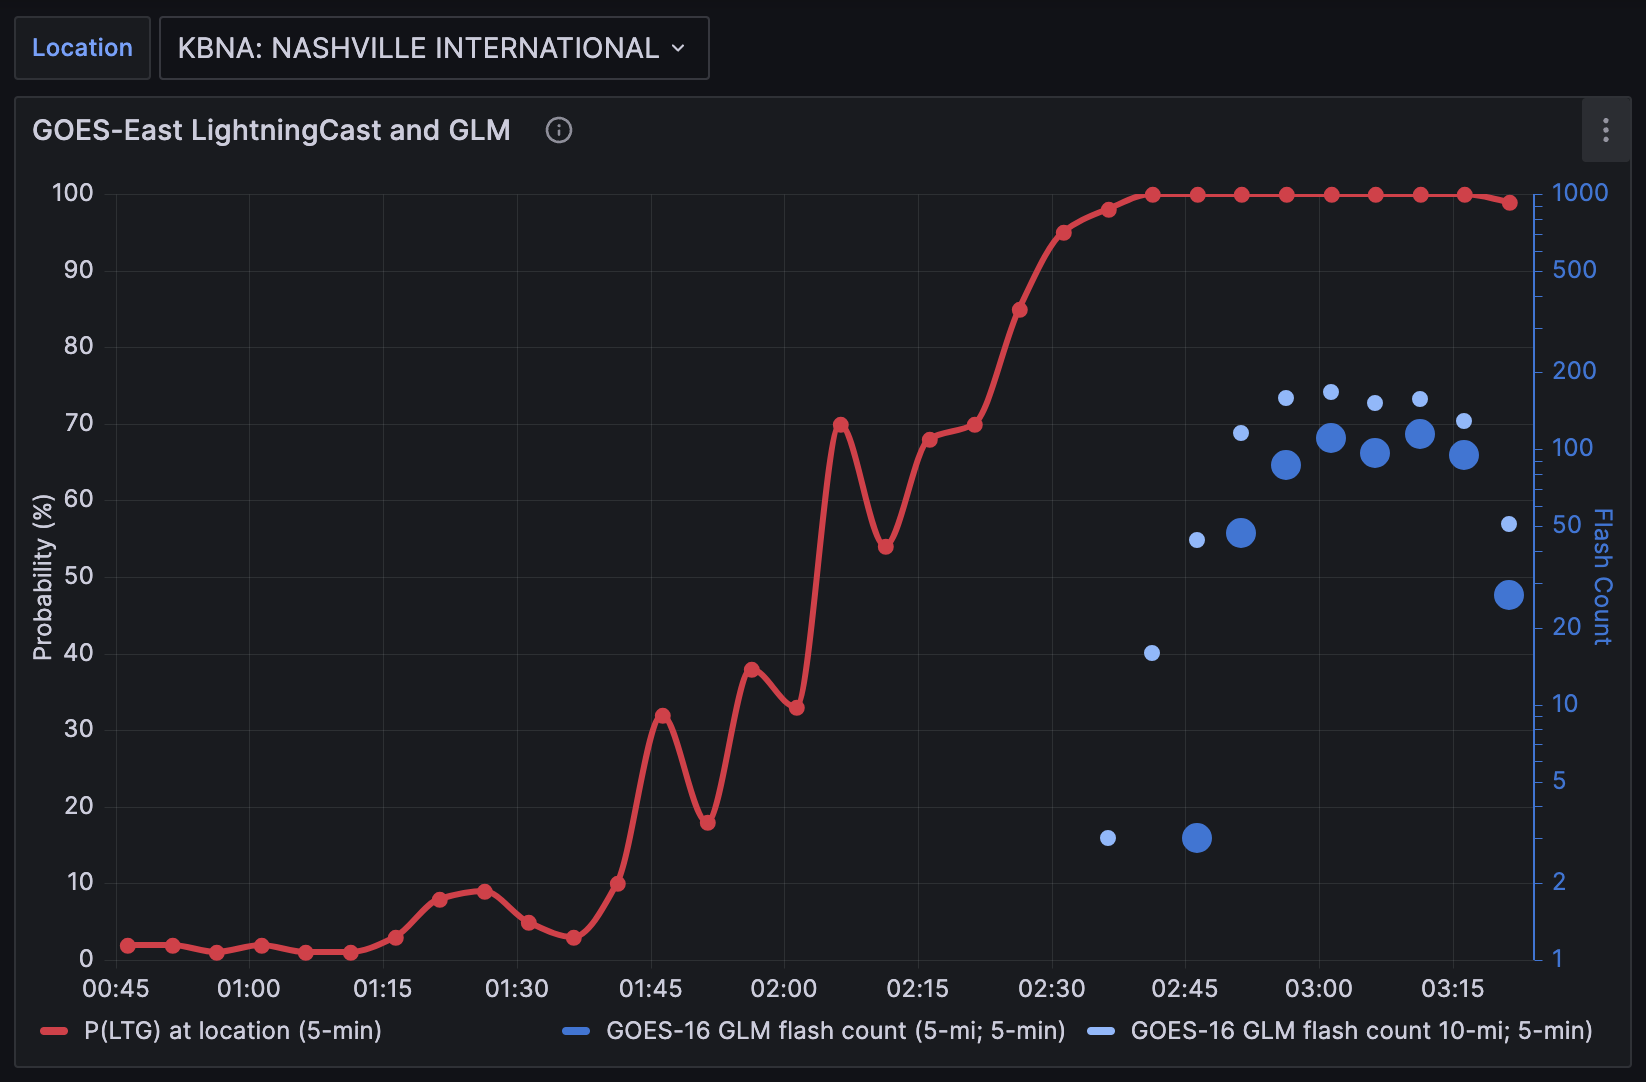
May LightningCast lead time
Bonus material: Eruptive period of Popocatépetl in Mexico
June Wildfires in Quebec
July Thunderstorms force the evacuation of an outdoor concert in Nashville
August Wildfires on the island of Maui in Hawai`i
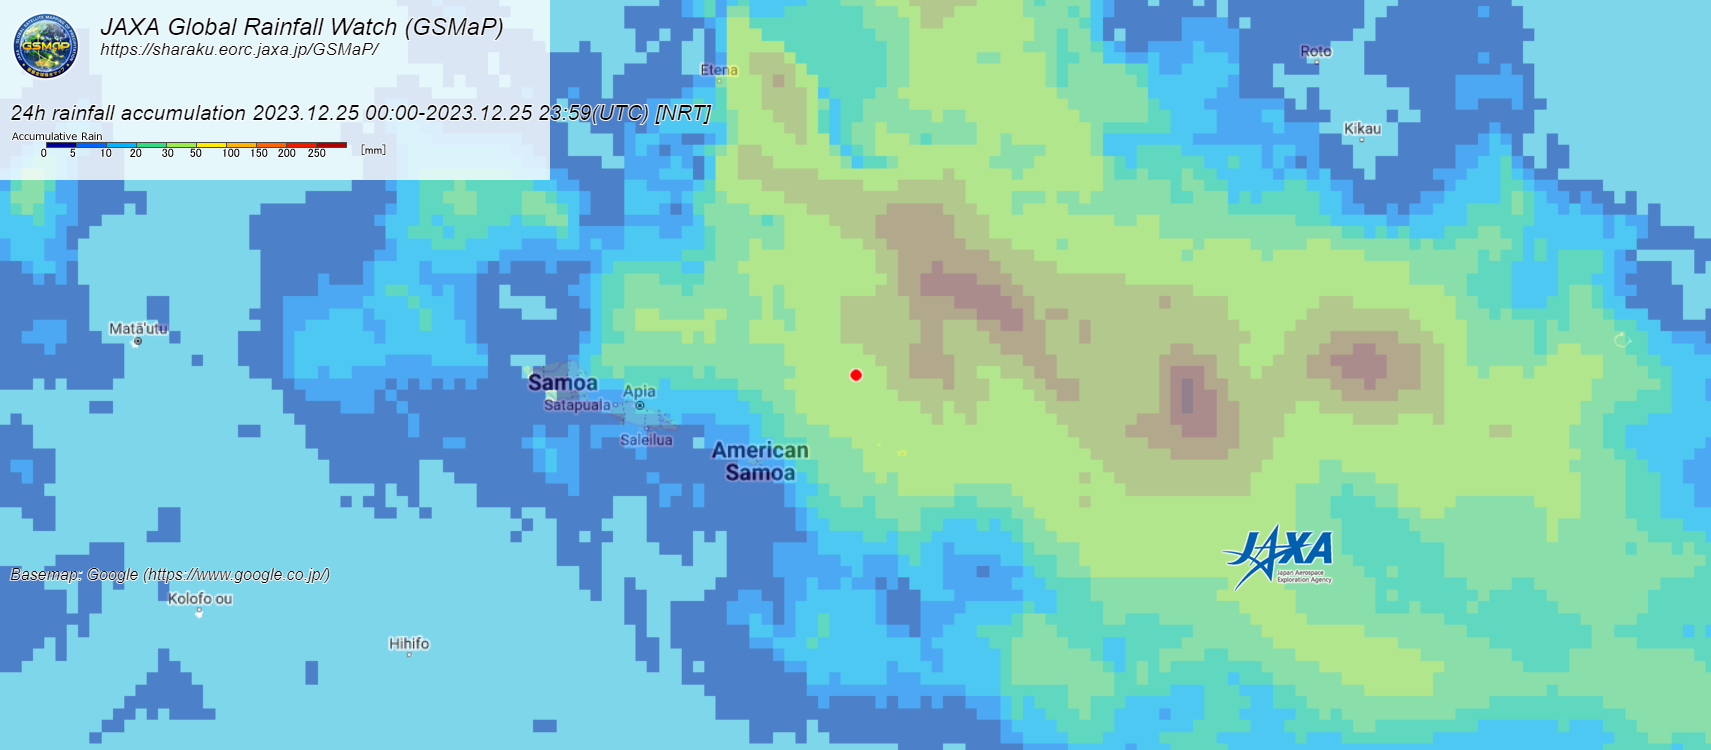
September Heavy Rain over New York City
Bonus material: Wildfires in British Columbia and Alberta
October Hurricane Otis
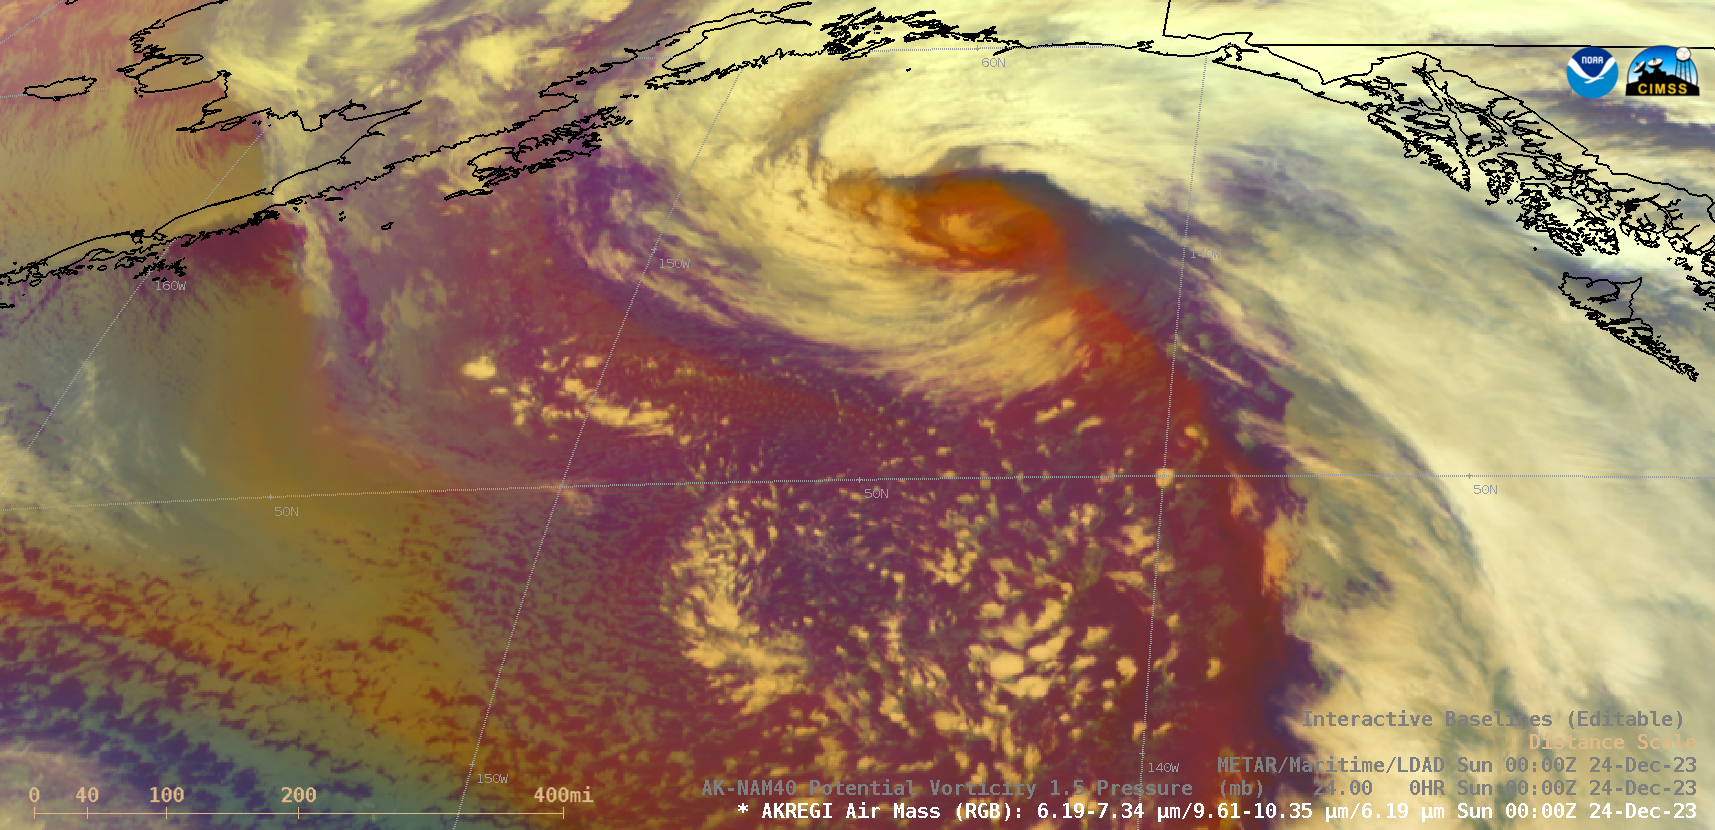
Bonus material: Plume of airborne glacial silt from the Copper River Valley
Bonus material: Annular solar eclipse shadow
November GOES-N to GOES-13, EWS-G1 and the Graveyard (Orbit)
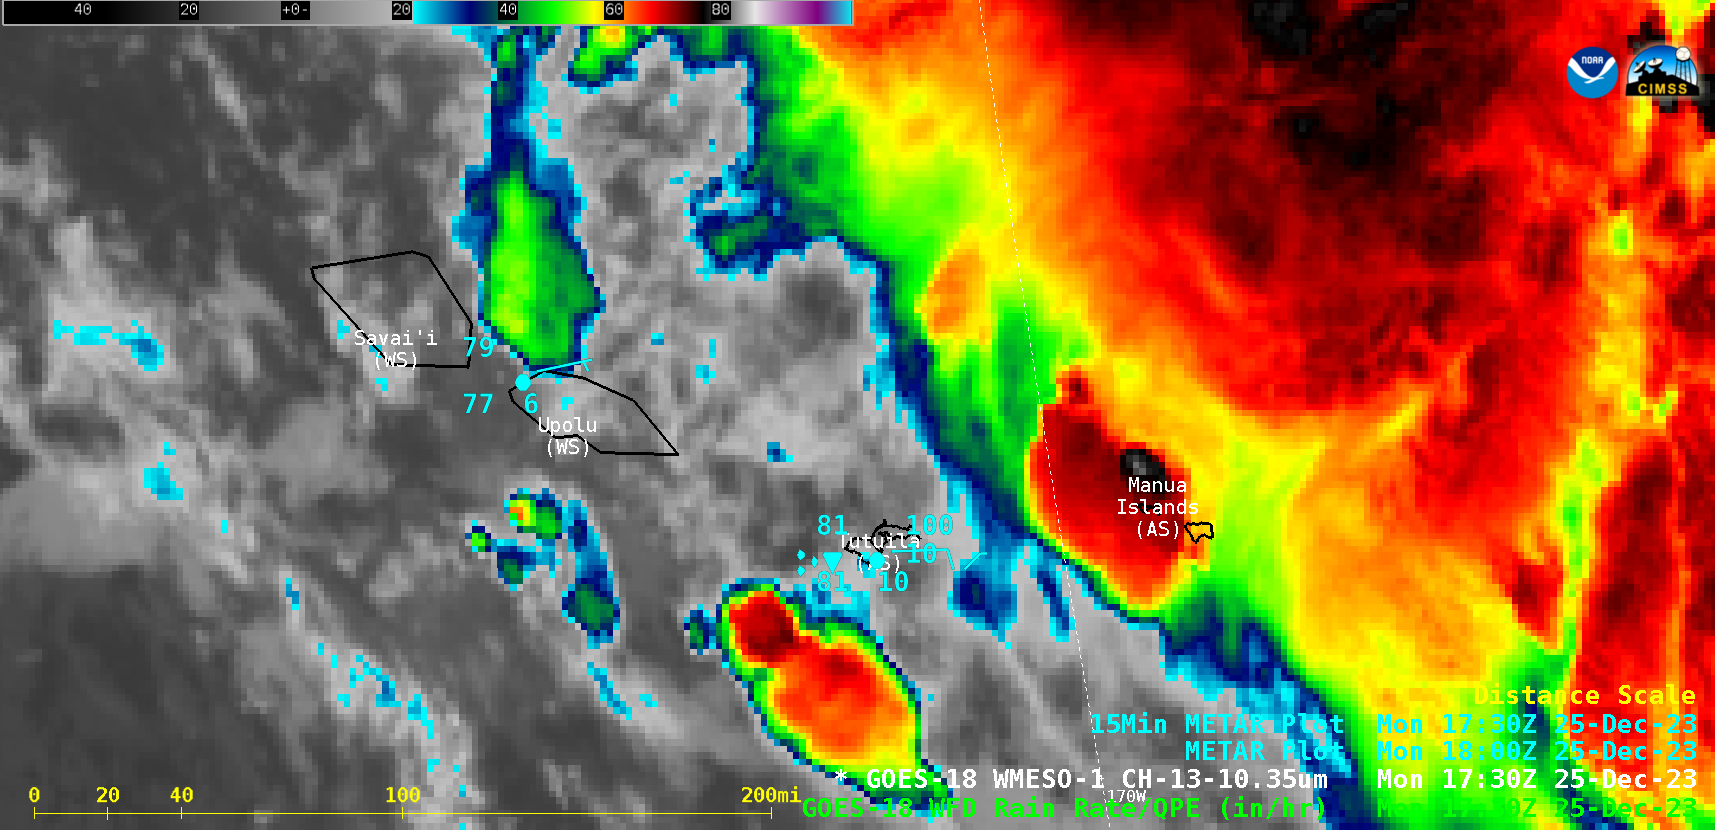
December 30-second imagery of severe thunderstorms
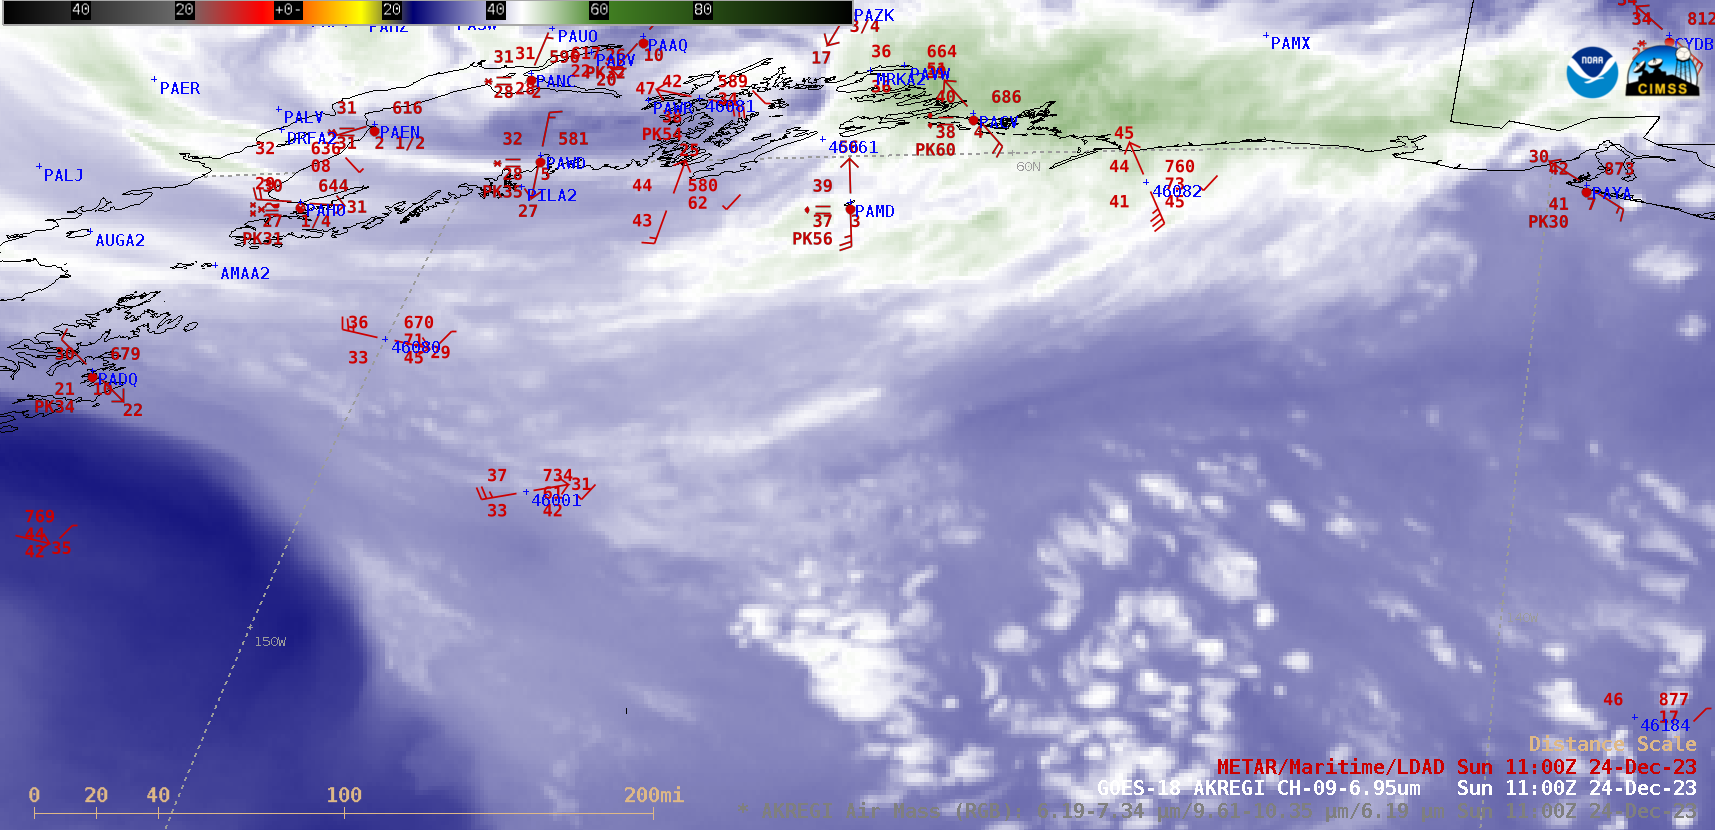
Bonus material: 2023 as seen in the water vapor ABI Band
H/T
Thanks to all who make the satellite imagery possible, the ingest and software to display the imagery (including, but not limited to McIDAS-X, geo2grid, geosphere, Real Earth and AWIPS) and all who generated CIMSS Satellite Blog entries, especially Scott Bachmeier and Scott Lindstrom. Special thanks to Mat Gunshor and Jim Nelson of UW/CIMSS.
A similar ‘Year in Review’ for 2021; 2022 by NOAA Satellites.
Also, some “top 25” GOES-16 and GOES-17 ABI loops. Also see the Satellite Liaison Blog.
Categories: Air quality, Aviation, AWIPS II, Cryosphere, Fire detection, Fog detection, General interpretation, Geo2Grid, GOES-16, GOES-17, GOES-18, GOES-R, Lightning, Marine weather, Red-Green-Blue (RGB) images, Rocket signatures, Severe convection, Tropical cyclones, Volcanic activity, Winter weather
View only this post Read Less


