GOES-16 (GOES-East) “Clean” Infrared Window (10.3 µm) images that included an overlay of GLM Flash Extent Density (above) revealed intermittent clusters of lightning activity across parts of north-central Illinois — many of which occurred in the general vicinity of METAR sites that were reporting moderate to heavy snow — during the hours prior to... Read More
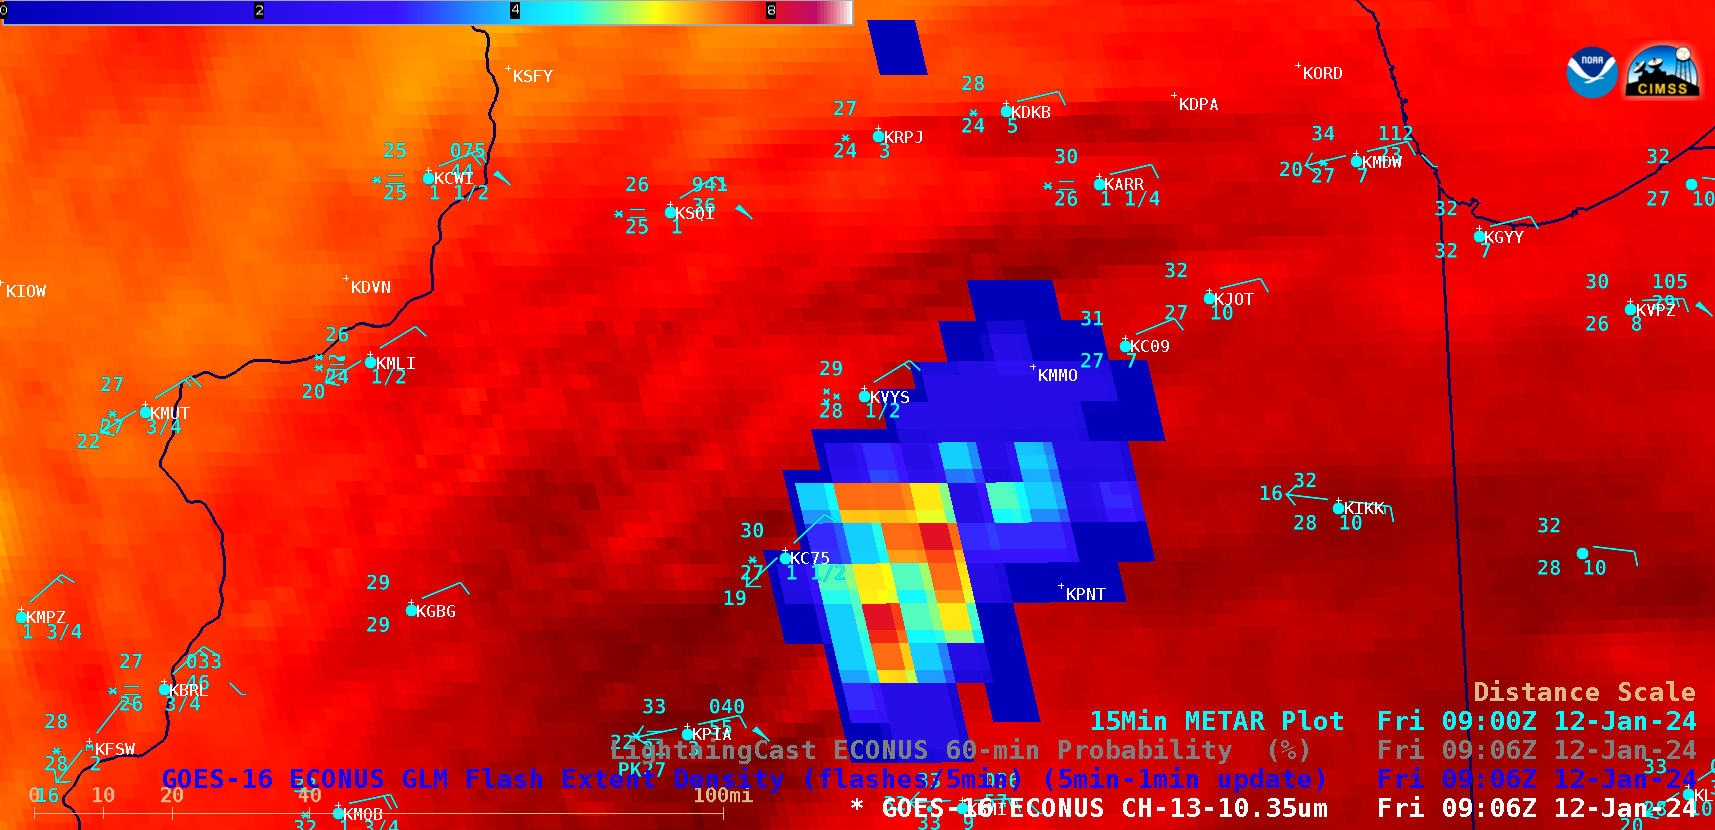
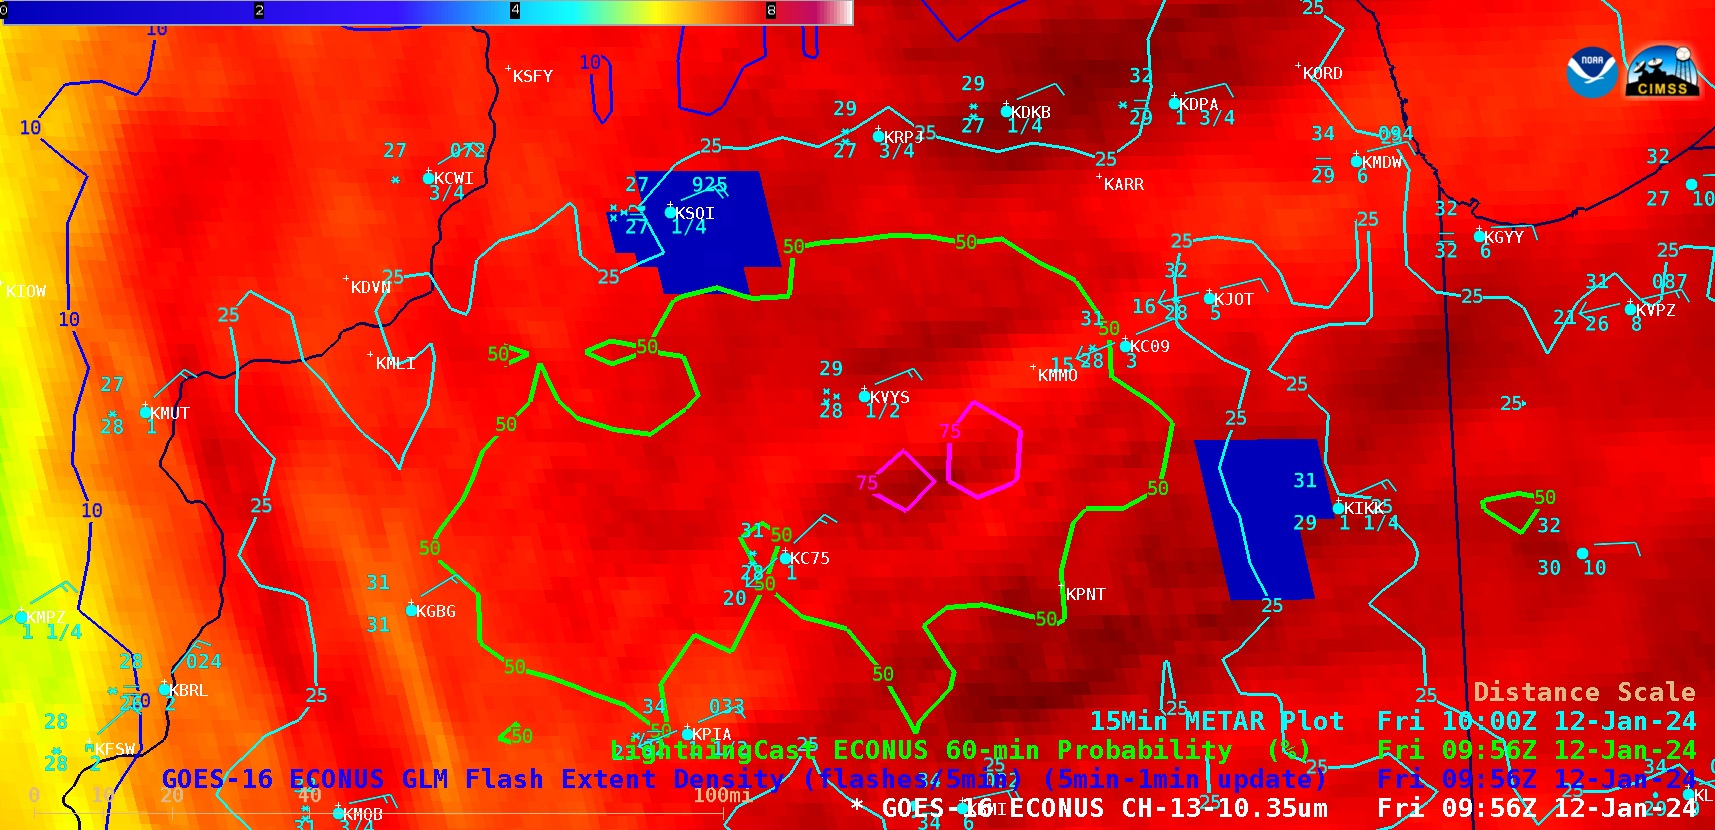
GOES-16 “Clean” Infrared Window (10.3 µm) images centered over north-central Illinois, with an overlay of GLM Flash Extent Density and plots of 15-minute METAR surface reports from 0701 UTC to 1316 UTC [click to play animated GIF | MP4]
GOES-16
(GOES-East) “Clean” Infrared Window (
10.3 µm) images that included an overlay of
GLM Flash Extent Density (above) revealed intermittent clusters of lightning activity across parts of north-central Illinois — many of which occurred in the general vicinity of METAR sites that were reporting moderate to heavy snow — during the hours prior to and around sunrise on
12 January 2024. Near the end of the animation period, isolated lightning signatures were also seen along the Iowa/Illinois border and in the Chicago area. Although a few METAR sites occasionally reported lightning in the distance, none of the sites explicitly reported thundersnow.
GOES-16 Infrared + Flash Extent Density images that also included contours of LightningCast Probability (below) showed that the LightningCast tool generally performed fairly well, with probability values frequently in the 25-50% range in advance of many of the larger Flash Extent Density episodes across Illinois.
GOES-16 “Clean” Infrared Window (10.3 µm) images centered over north-central Illinois, with an overlay of GLM Flash Extent Density, contours of LightningCast Probability and plots of 15-minute METAR surface reports [click to play animated GIF | MP4]
A closer view of GOES-16 “Red” Visible (
0.64 µm) and Infrared images centered over the Chicago area
(below) showed the isolated GLM Flash Extent Density event that occurred around 1311 UTC (just before sunrise). Again, no nearby METAR sites explicitly reported thundersnow.
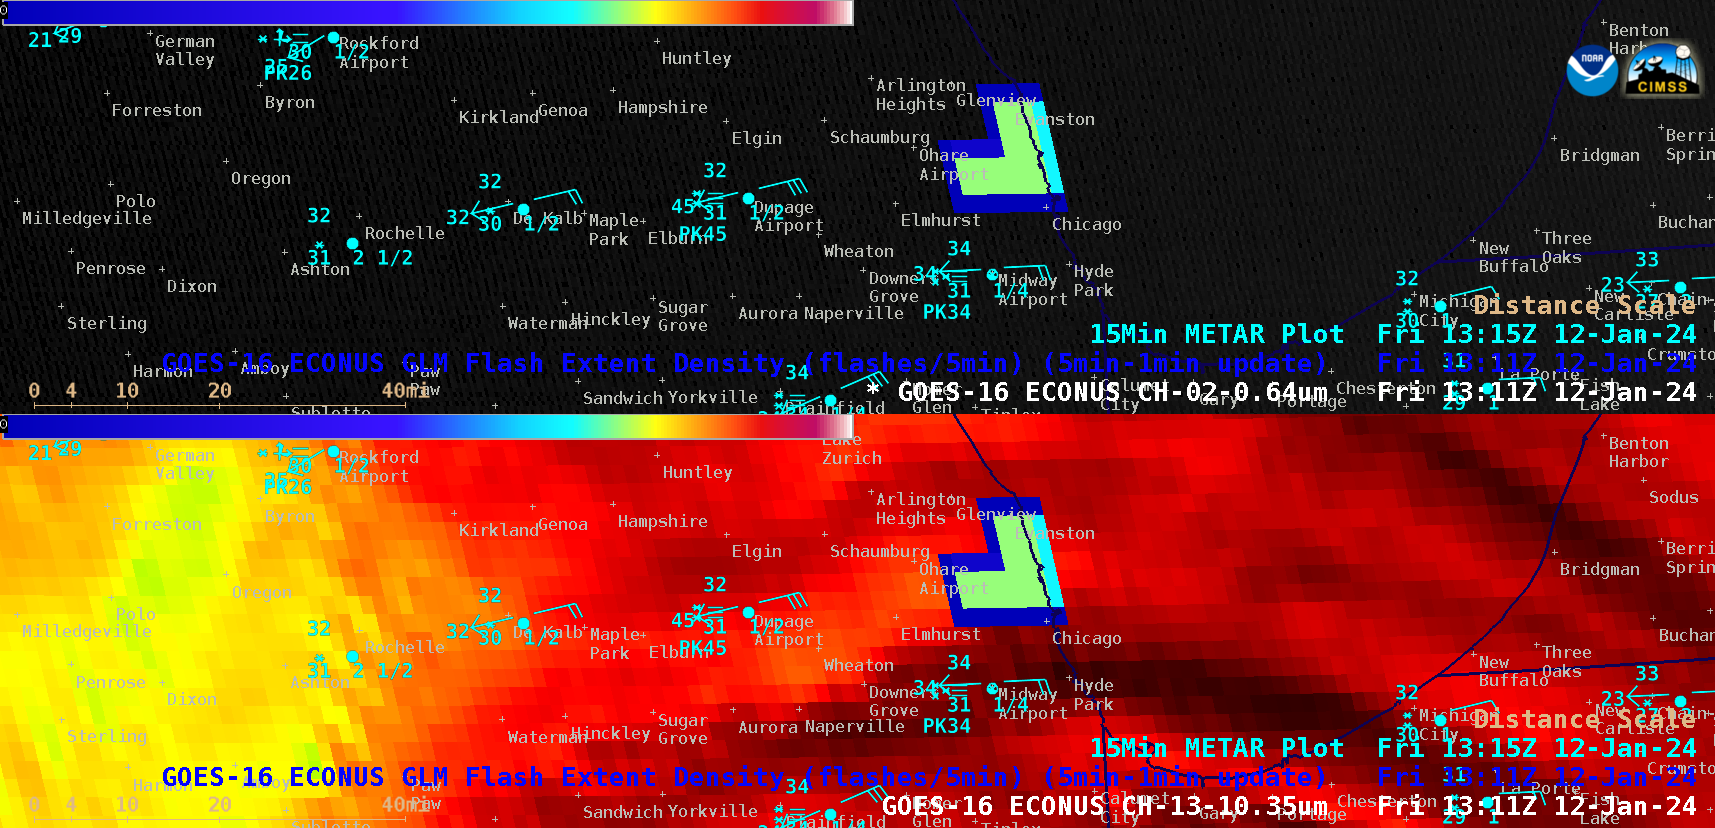
GOES-16 “Red” Visible (0.64 µm, top) and “Clean” Infrared Window (10.3 µm, bottom) images centered over the Chicago area, with an overlay of GLM Flash Extent Density and plots of 15-minute METAR surface reports [click to play animated GIF | MP4]
LightningCast Probability values in the Chicago area rose to around 50% at 1241 UTC
(below), 15 minutes prior to the observed GOES-16 GLM Flash Extent Density event.
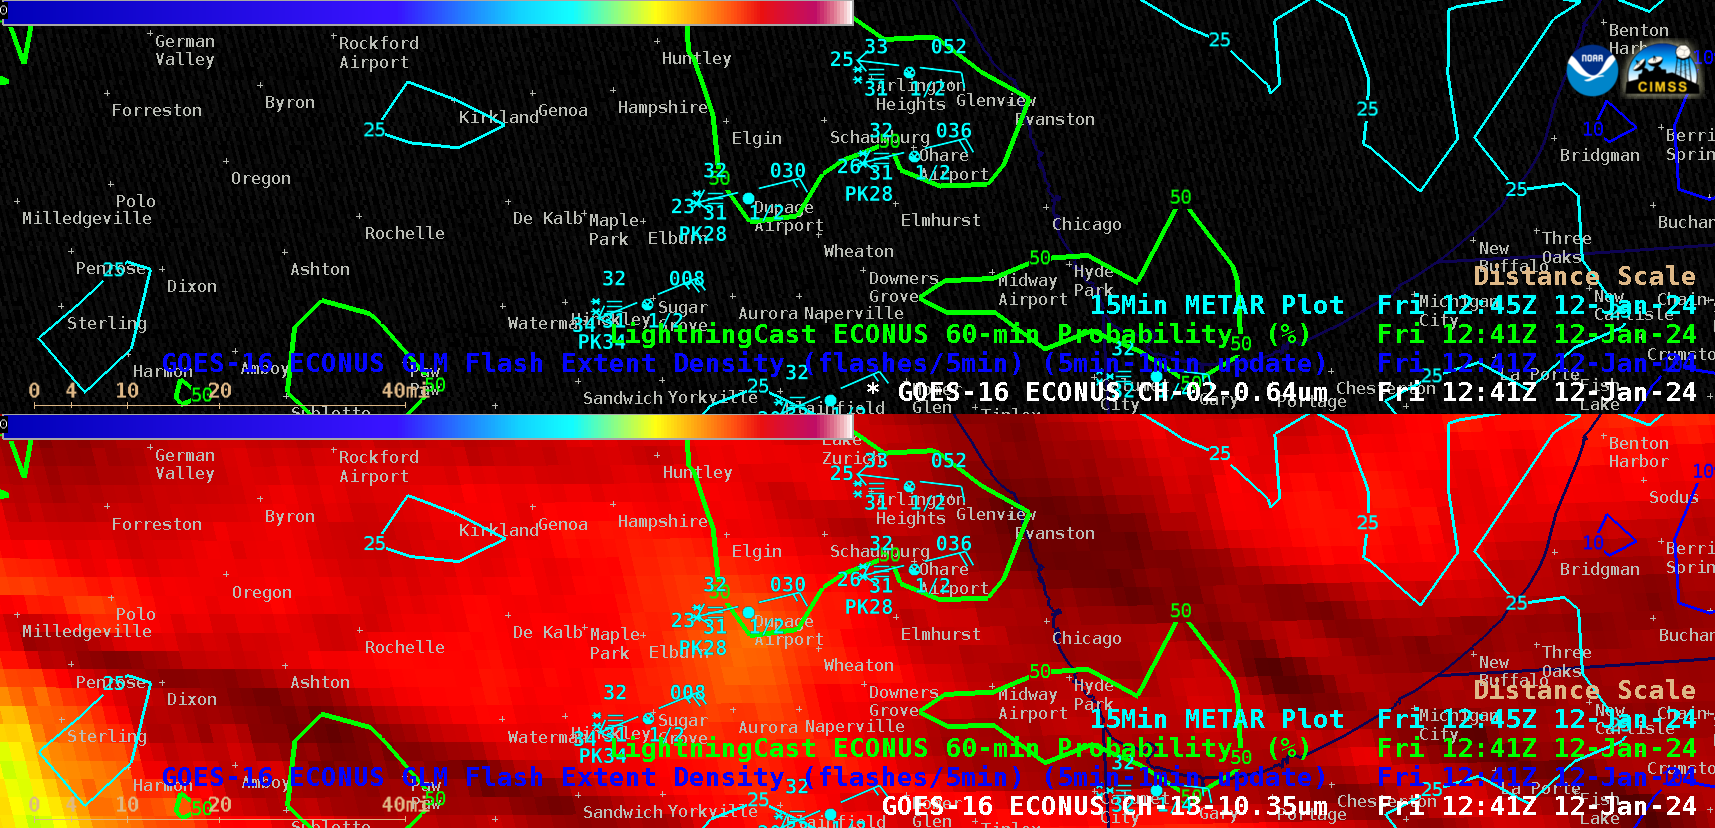
GOES-16 “Red” Visible (0.64 µm, top) and “Clean” Infrared Window (10.3 µm, bottom) images centered over the Chicago area, with an overlay of GLM Flash Extent Density, contours of LightningCast Probability and plots of 15-minute METAR surface reports [click to play animated GIF | MP4]
Toward the end of the day, a few bursts of GLM Flash Extent Density were observed over the Detroit, Michigan area
(below).
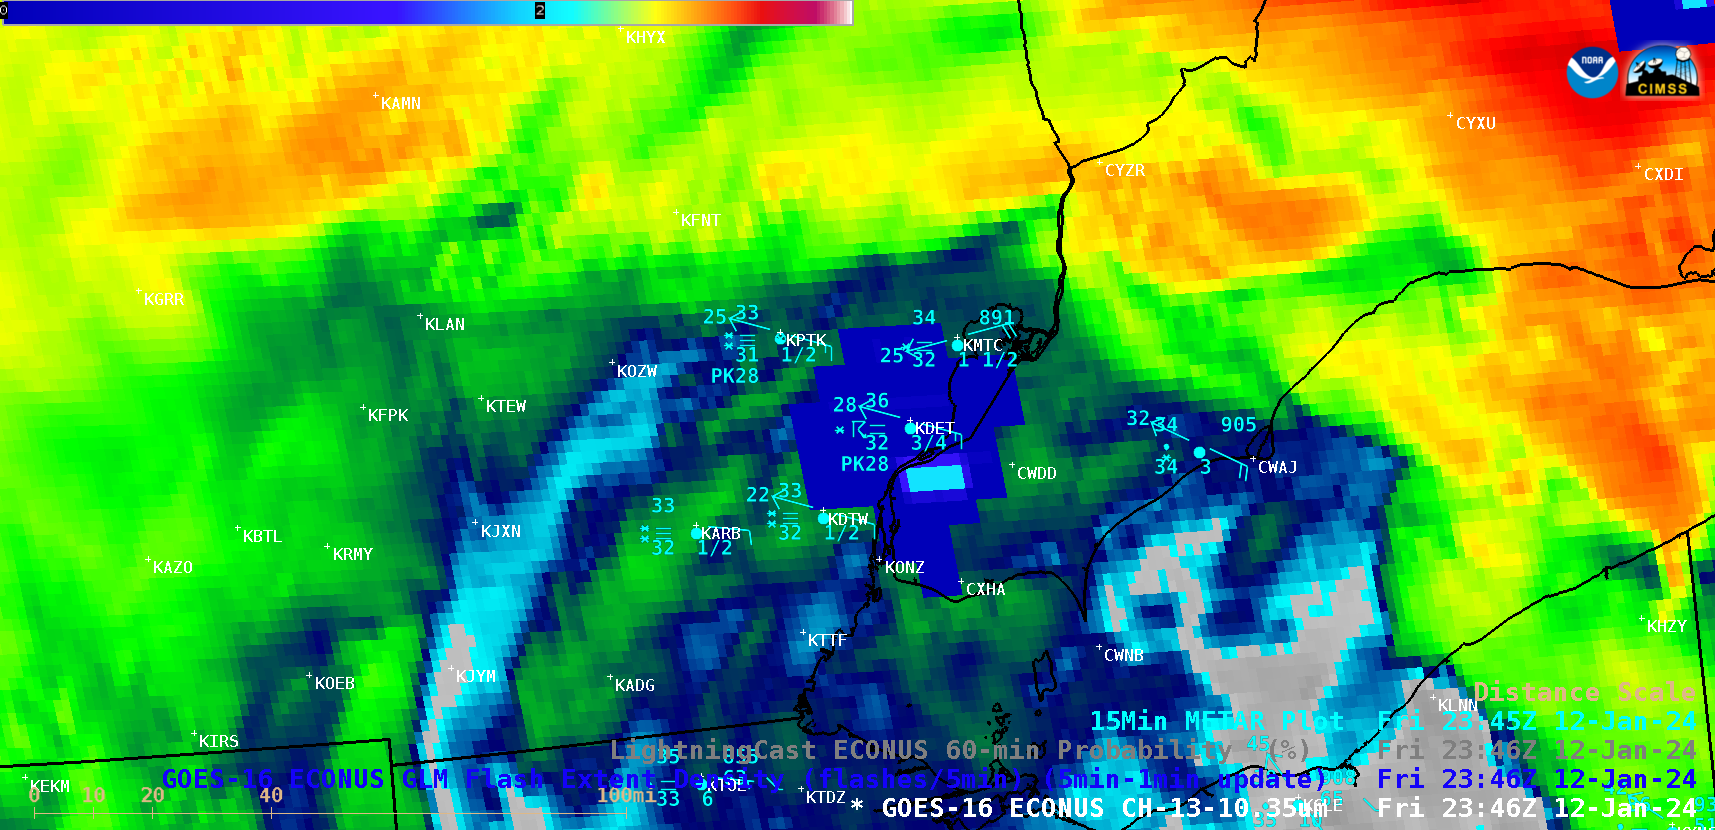
GOES-16 “Clean” Infrared Window (10.3 µm) images centered over southeastern Lower Michigan, with an overlay of GLM Flash Extent Density and plots of 15-minute METAR surface reports [click to play animated GIF | MP4]
In this case, thundersnow (TSSN) actually was reported at one METAR site: KDET (Coleman A. Young International Airport, located 6 miles northeast of downtown Detroit), as shown below.
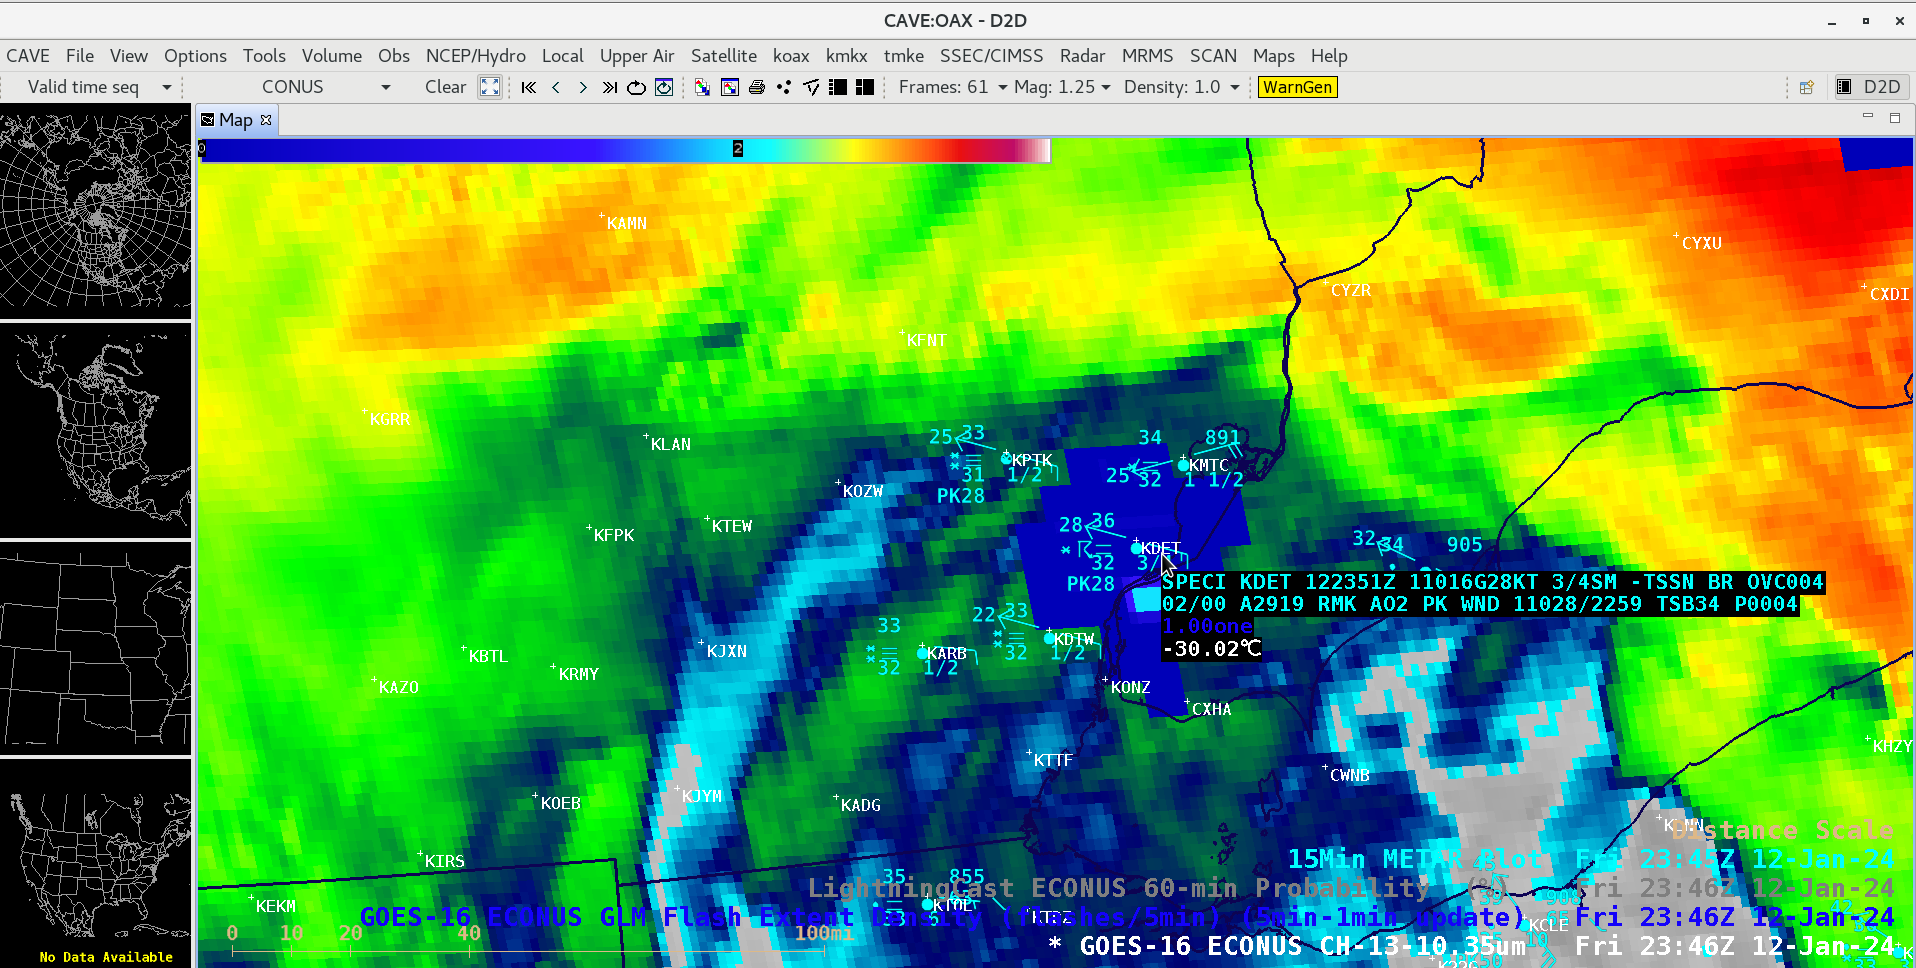
GOES-16 “Clean” Infrared Window (10.3 µm) image centered over southeastern Lower Michigan at 2346 UTC, with an overlay of GLM Flash Extent Density and a cursor sample of the KDET METAR surface report at 2351 UTC [click to enlarge]
However, LightningCast Probability values were lower for these Flash Extent Density events over the Detroit area — generally remaining at or below 10-25%.
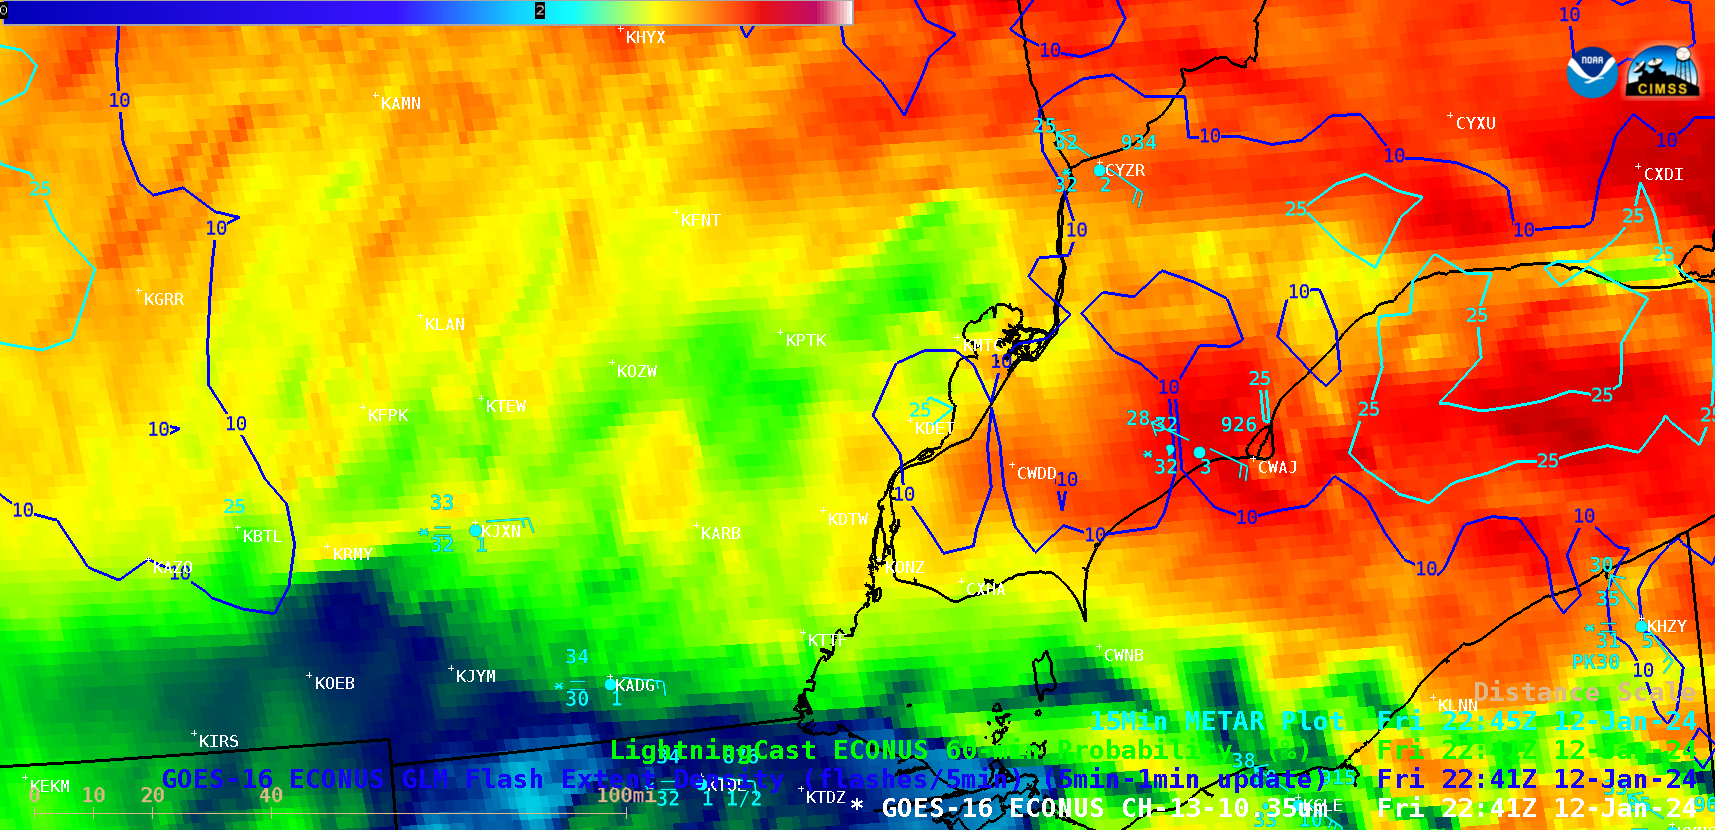
GOES-16 “Clean” Infrared Window (10.3 µm) images centered over southeastern Lower Michigan, with an overlay of GLM Flash Extent Density, contours of LightningCast Probability and plots of 15-minute METAR surface reports [click to play animated GIF | MP4]
View only this post
Read Less