Within 24 hours, a volcano on the Indonesian island of Flores erupted three times, with reports of an ash plume penetrating 18 km into the atmosphere. Mount Lewotobi is a twin volcano consisting of a pair of peaks, Perempuam and Laki-laki. It is this later peak that has been active lately, with numerous eruptions since November. On July 7 and 8, 2025, some of the most intense eruptions yet took place, with ash clouds being reported up to 18 km high and debris ejected up to 8 km away. Flights were cancelled out of Bali.
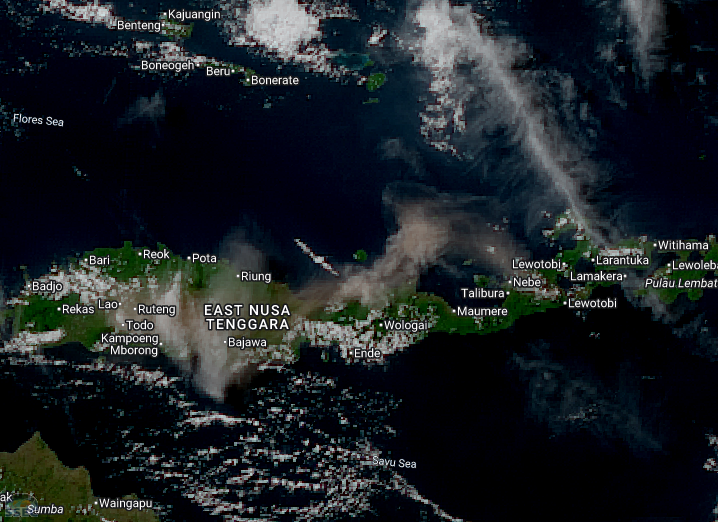
The first eruption was at 11:05 AM local time (0305 UTC), and produced the tallest ash plume. This was well-captured by the Advanced Himawari Imager, as it shows the brown-gray ash plume being transported west by the predominant easterly winds at that latitude.
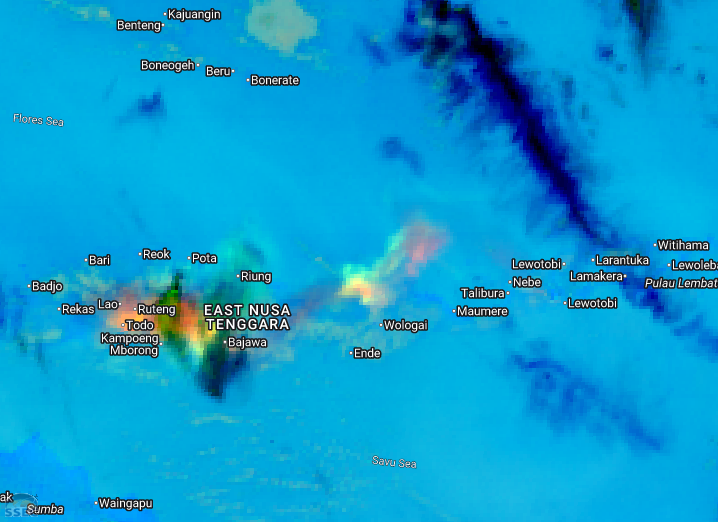
The Ash RGB provides some interesting insights into the makeup of the plume. The plume is clearly multicolored, indicating that it is far from homogeneous. An animation of the plume is seen here:
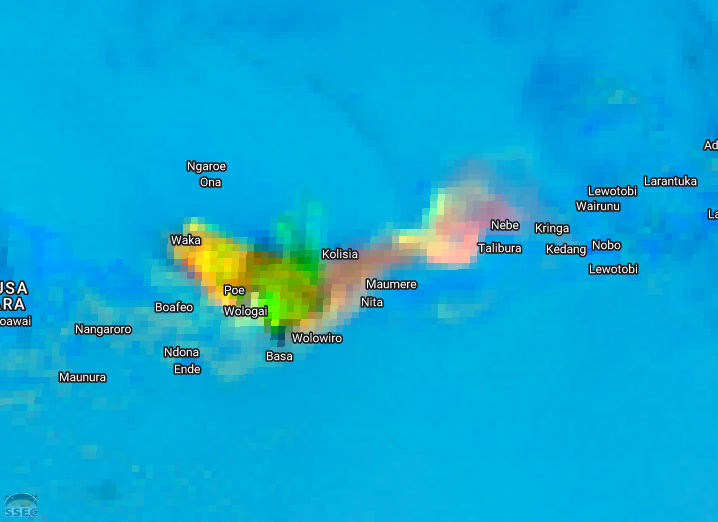
To better analyze the makeup of the plume, here is a single still frame of the plume at 0420 UTC (12:20 PM local time). Here, it is possible to take a closer look at the components of the plume as observed by satellite. The Ash RGB recipe can be seen in the quick guide for this product. When this recipe is applied to the Laki-laki plume, notable features pop out. The eastern edge of the plume, closest to the volcano itself, is pink to red in color, indicating thinner quantities of ash. Further west, the plume is brown which is indicative of thicker ash. The bright green area represents a region of high SO2 concentration. At the western tip of the plume the predominant color is yellow; since yellow is a mixture of both red and blue, this represents a region of high concentrations of both ash and SO2.
Of course, volcanoes represent regions of extreme heat, and so they are well observed by satellite fire detection algorithms. Here, teh Fire RGB clearly indicates the eruption with a bright red spot on the eastern edge of the island.

Geostationary satellites serve a very important role for volcano monitoring as their consistent temporal resolution ensures a ready view of the environment in which the eruption is taking place. Sometimes, however, you get lucky with a polar orbiting satellite that passes overhead when something interesting is going on, allowing one to investigate the plume in higher spatial and/or spectral detail. Here is the view of the SO2 cloud as captured by TROPOMI aboard Sentinel-5P on 7 July. This overpass was at approximately 0550 UTC, nearly three hours after the initial eruption) and shows extraordinarily high SO2 concentrations with the highest regions in the center possibly obscured by the optically thick ash.
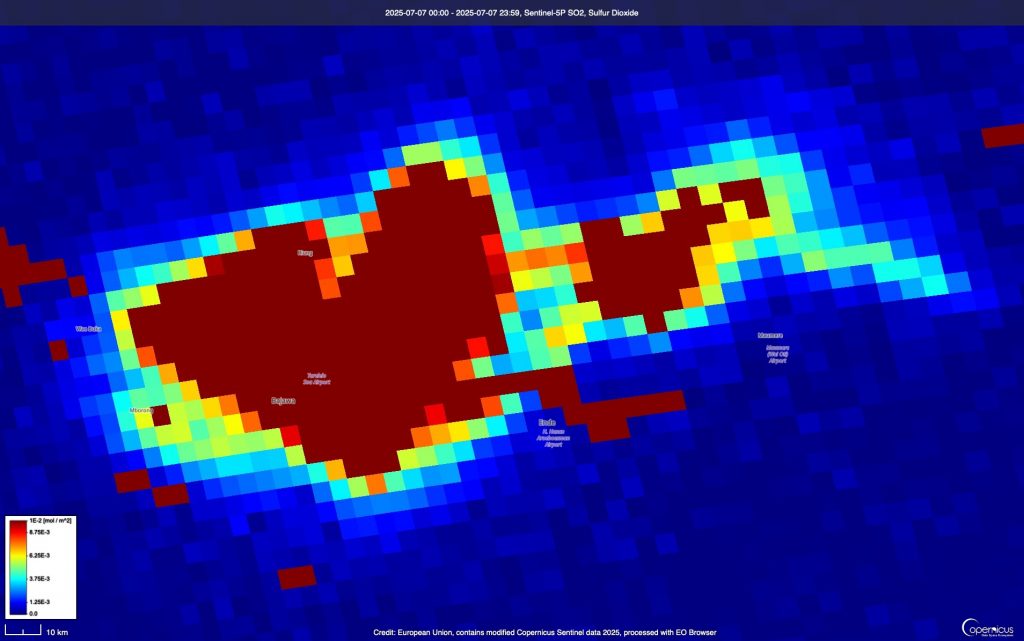
Note how this compares to the true color and Ash RGB views from the AHI for roughly the same time. The AHI views are plotted independently from the TROPOMI image, so the projection and scale are not identical. Still, it is clear that the different methods of viewing SO2 concentration each has some benefits. The TROPOMI view offers quantitative SO2 retrievals, and appears to identify regions in the center of the plume where SO2 is still high but largely absent from the RGB. By contrast, the large regions of green and yellow in the Ash RGB show that SO2 is present where TROPOMI’s quantitative retrievals are limited by the thick ash cloud.
This was just the first eruption of Laki-laki during this cycle. A second eruption took place at 1130 UTC, and can be seen in the Ash RGB animation as a pulse of pink (indicating ash) moving to the northwest beneath the high cirrus.
A third, less intense eruption occurred at 2153 UTC. Overall, 4000 people have been evacuated. Fortunately, no fatalities have been reported and injuries appear to be minor.
A major eruption of Lewotobi Laki-laki also occurred 3 weeks earlier, as discussed in this blog post.
View only this post Read Less


