Dust plume on the coast of China as viewed by a sounder
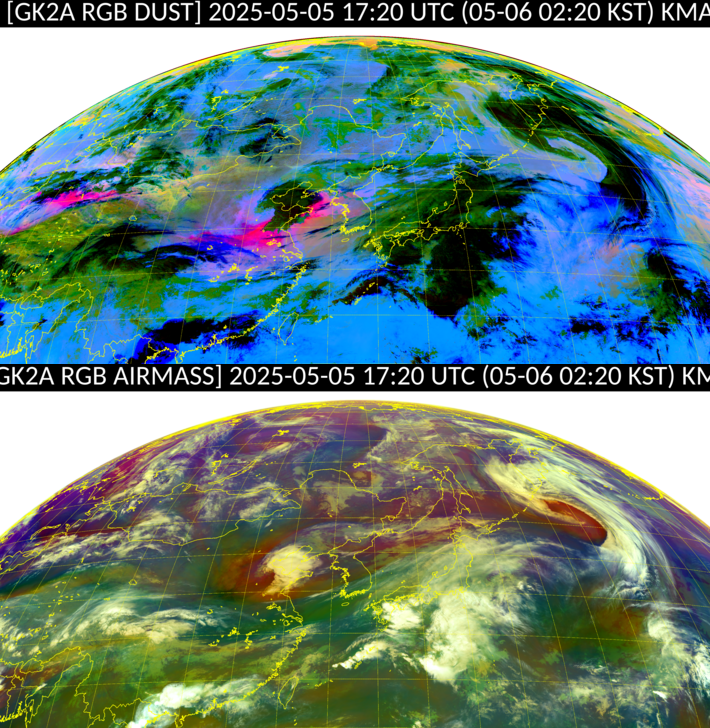
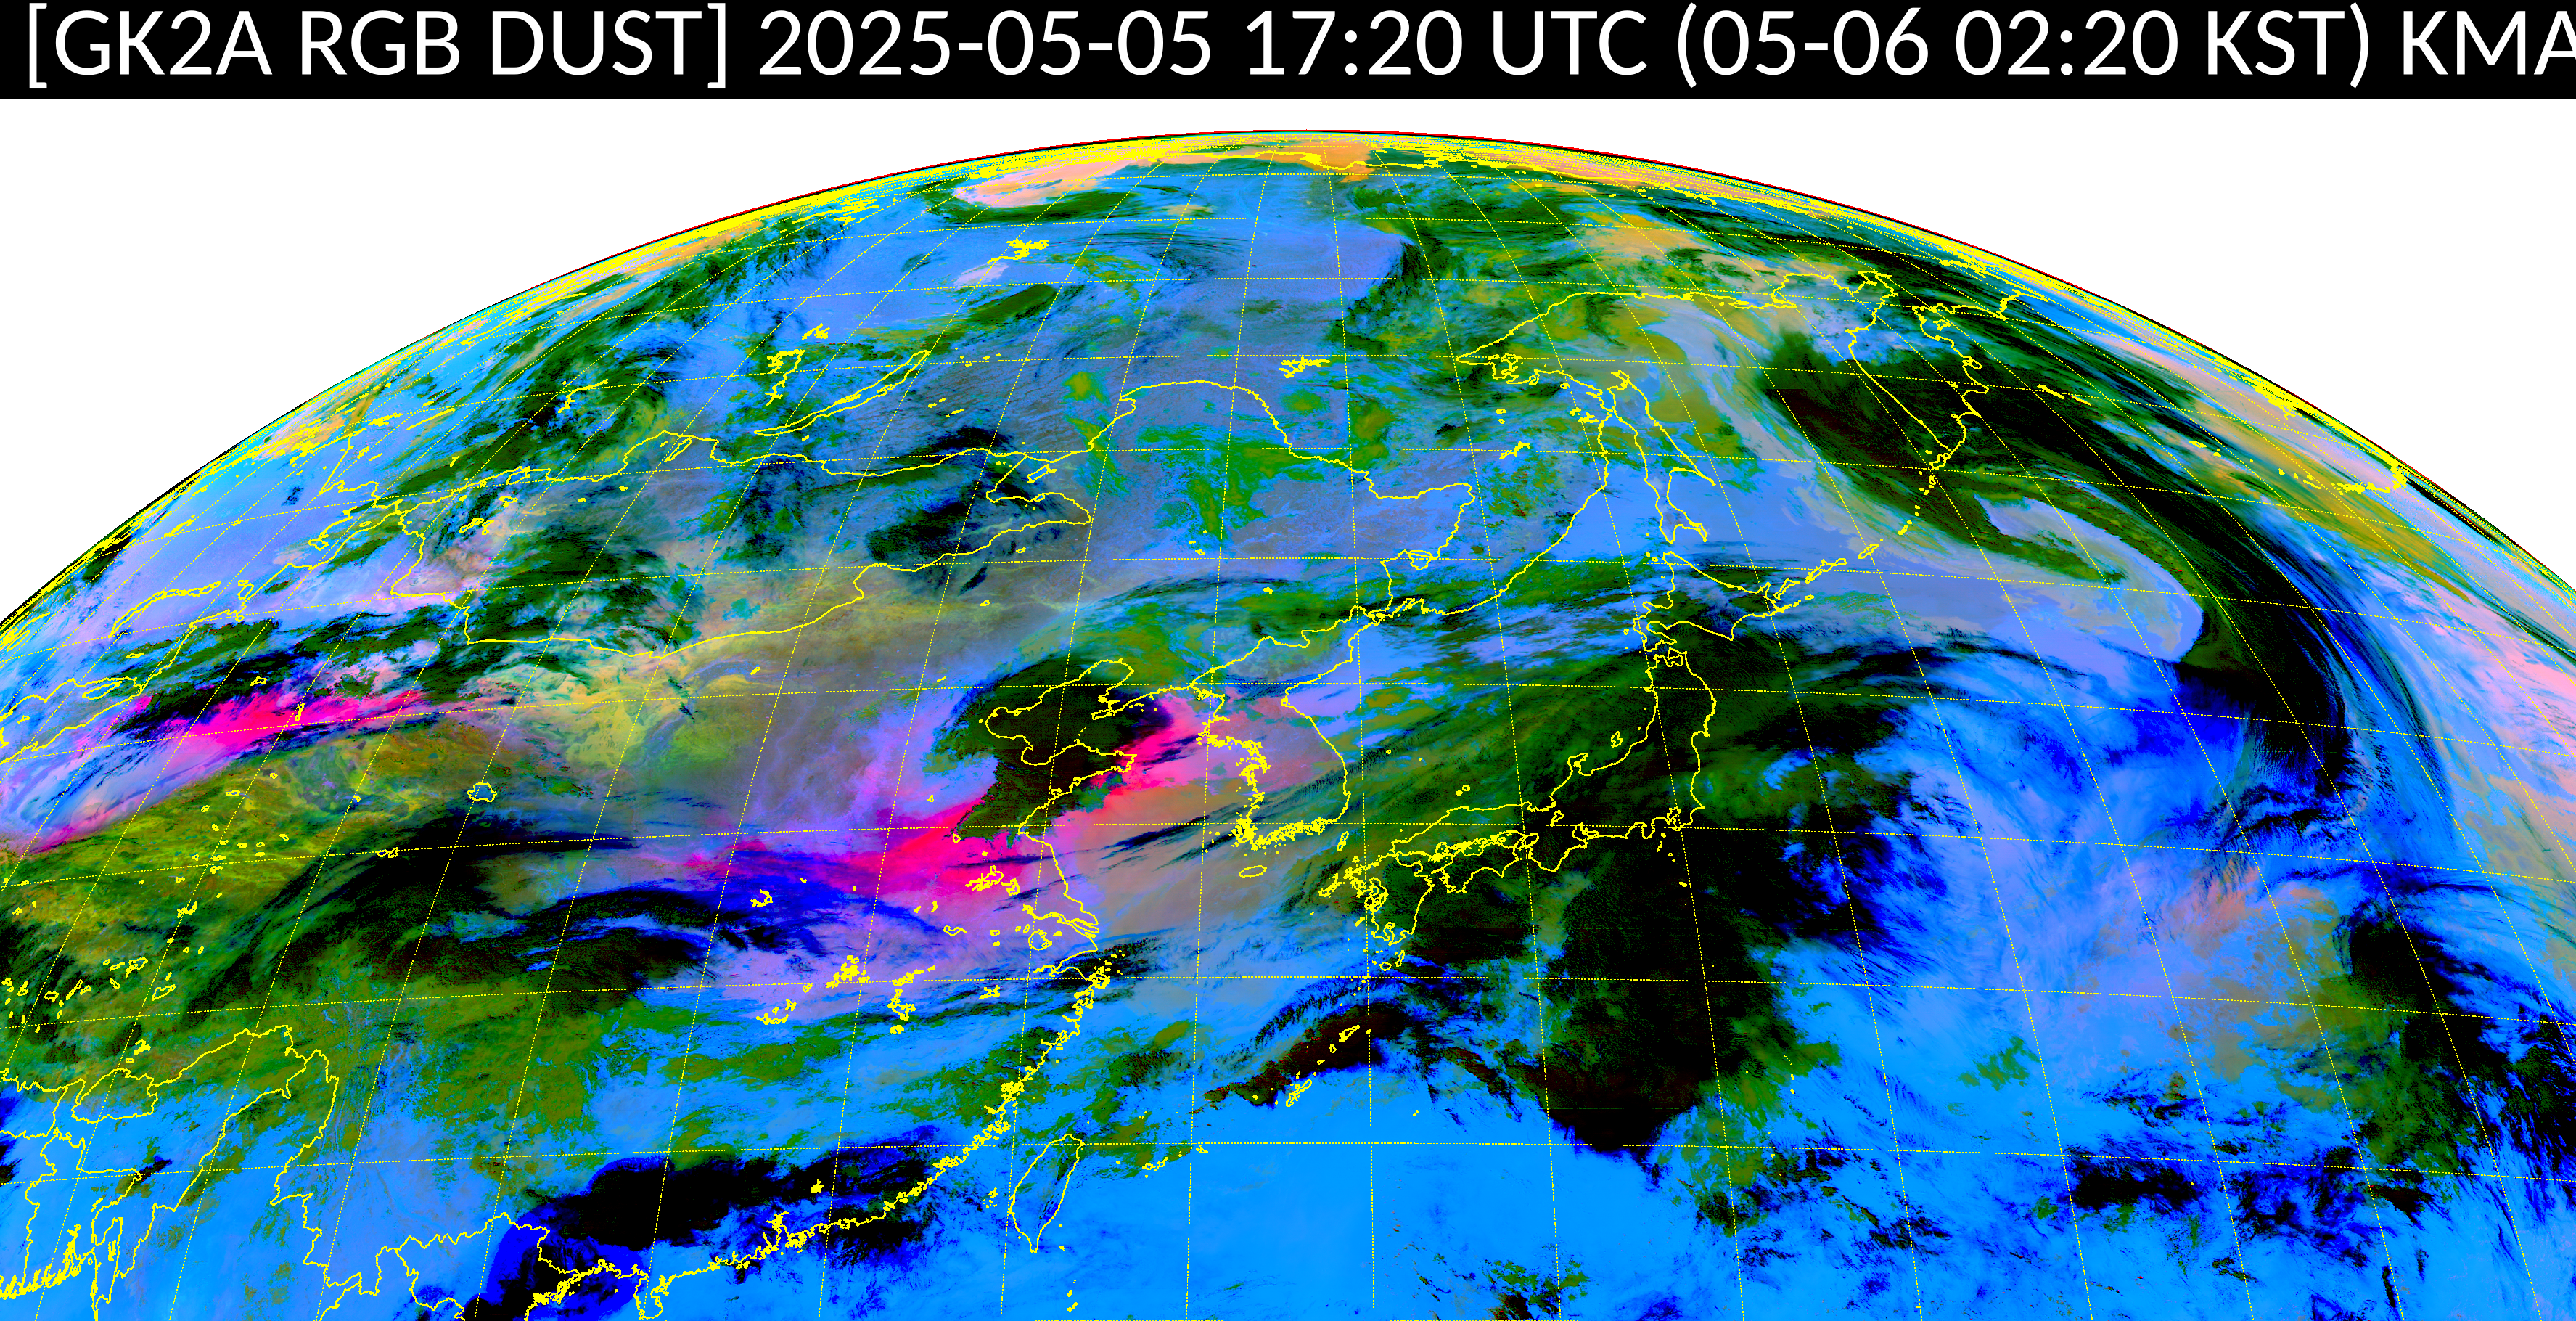
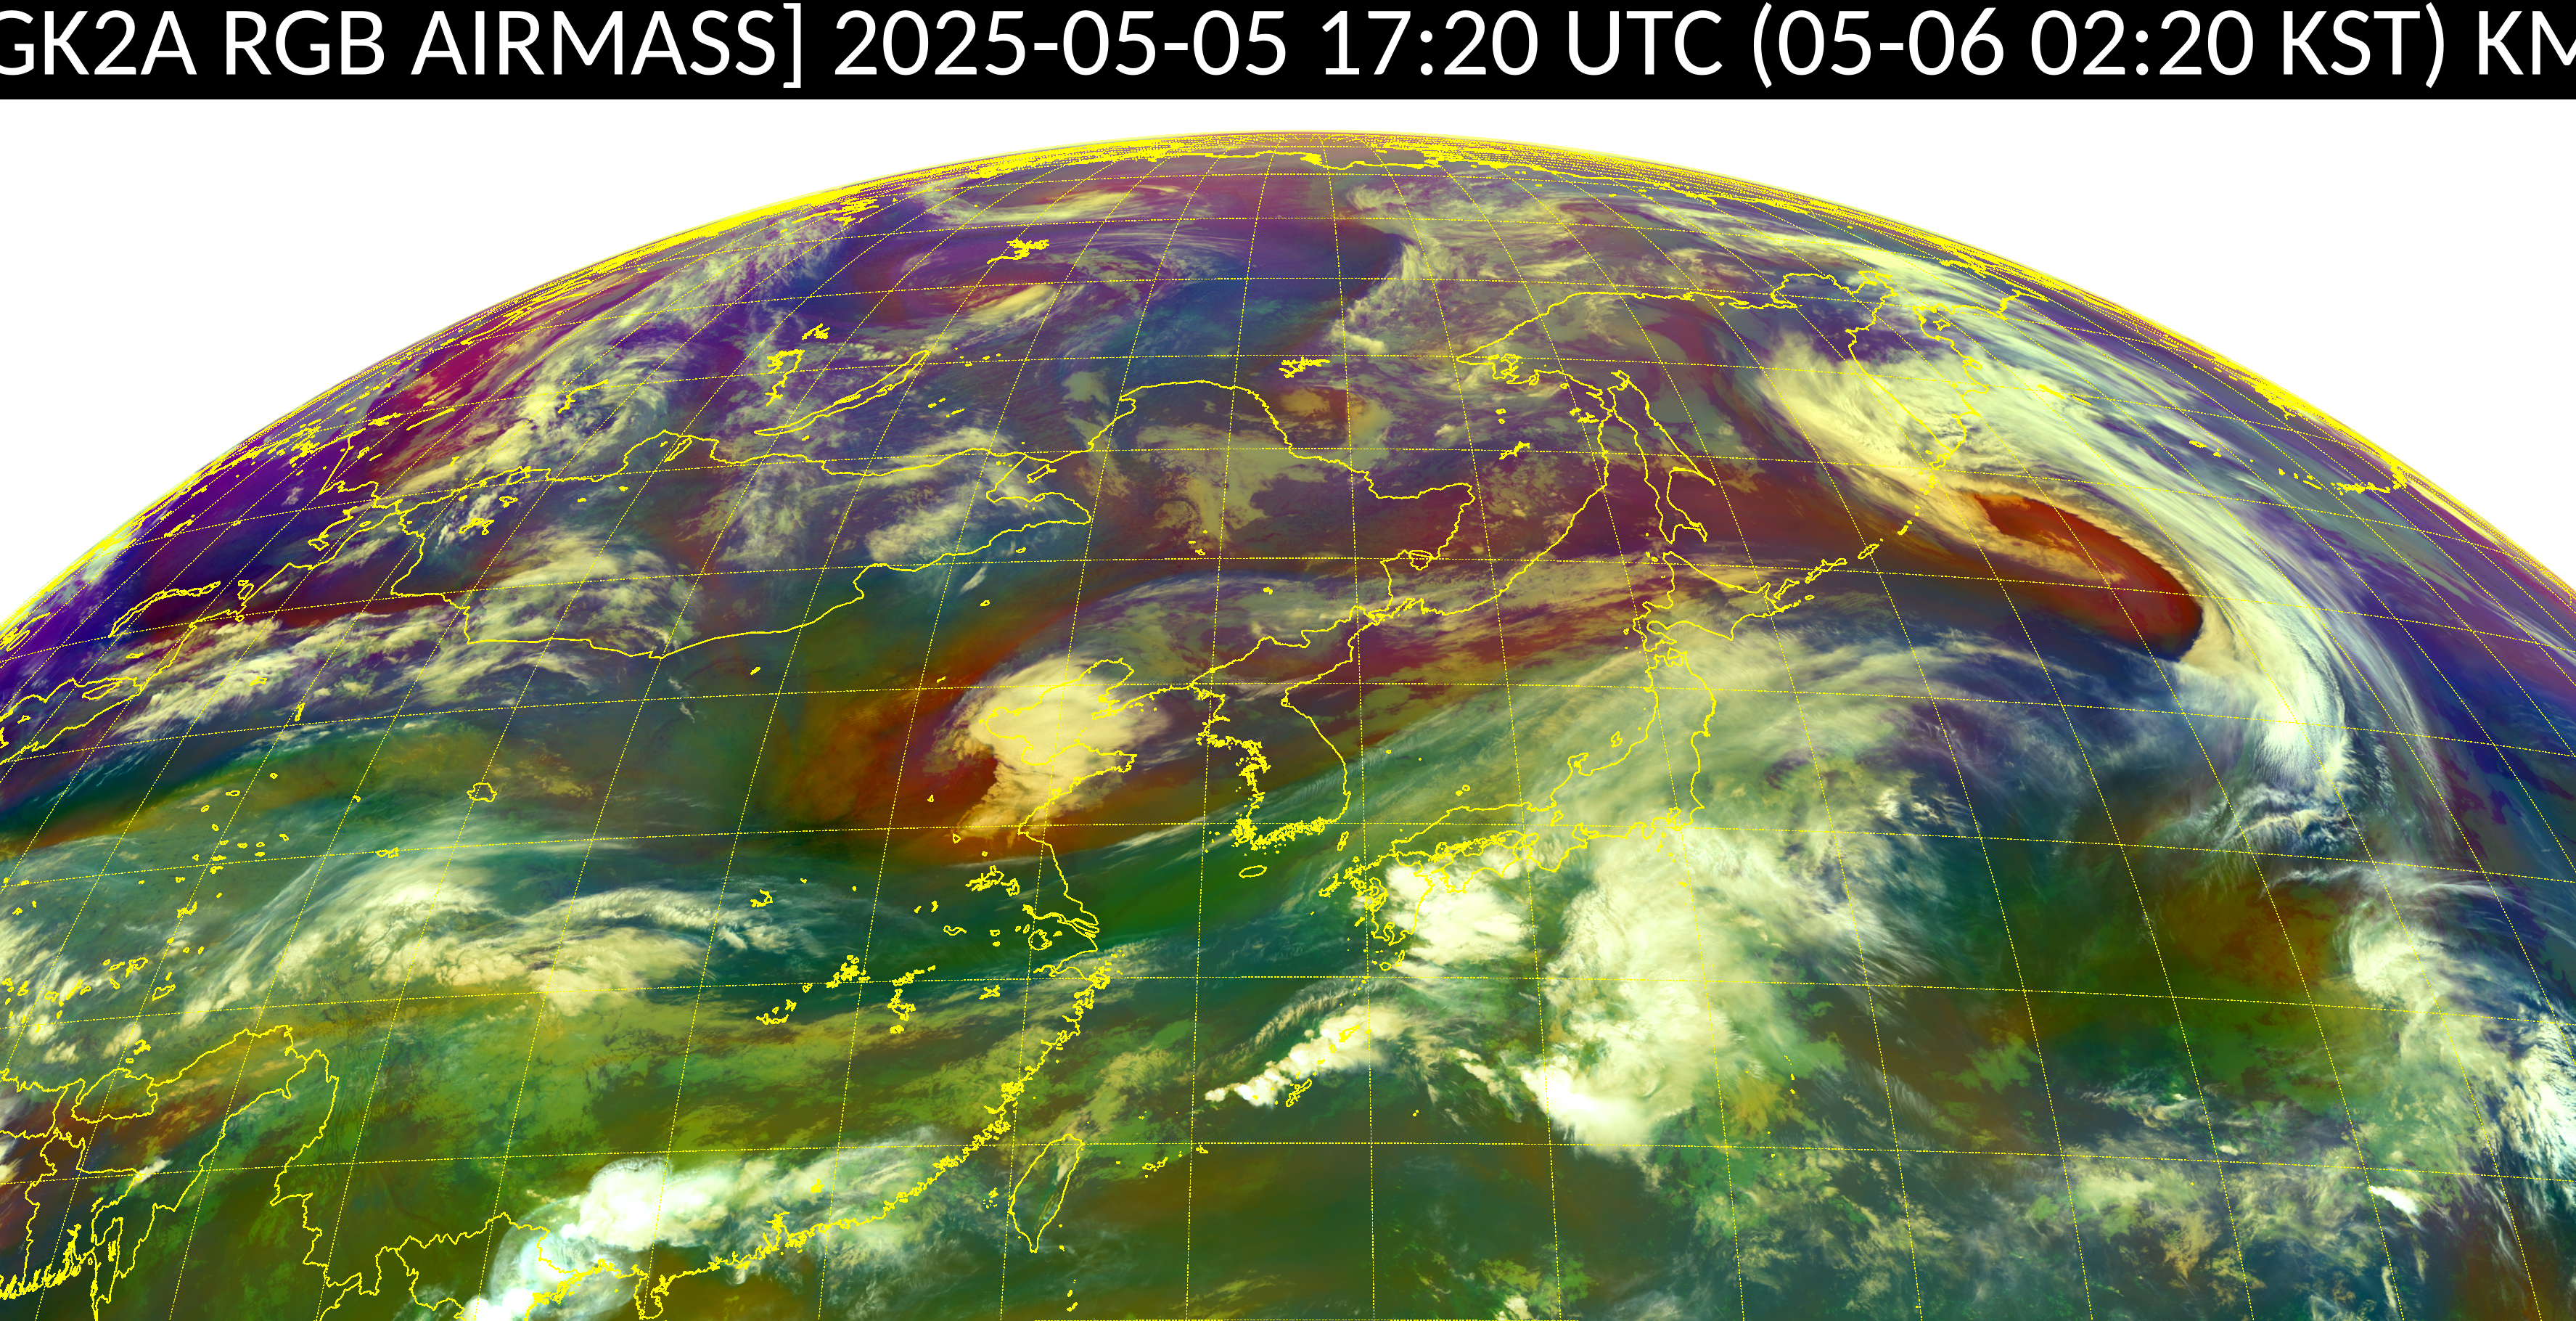
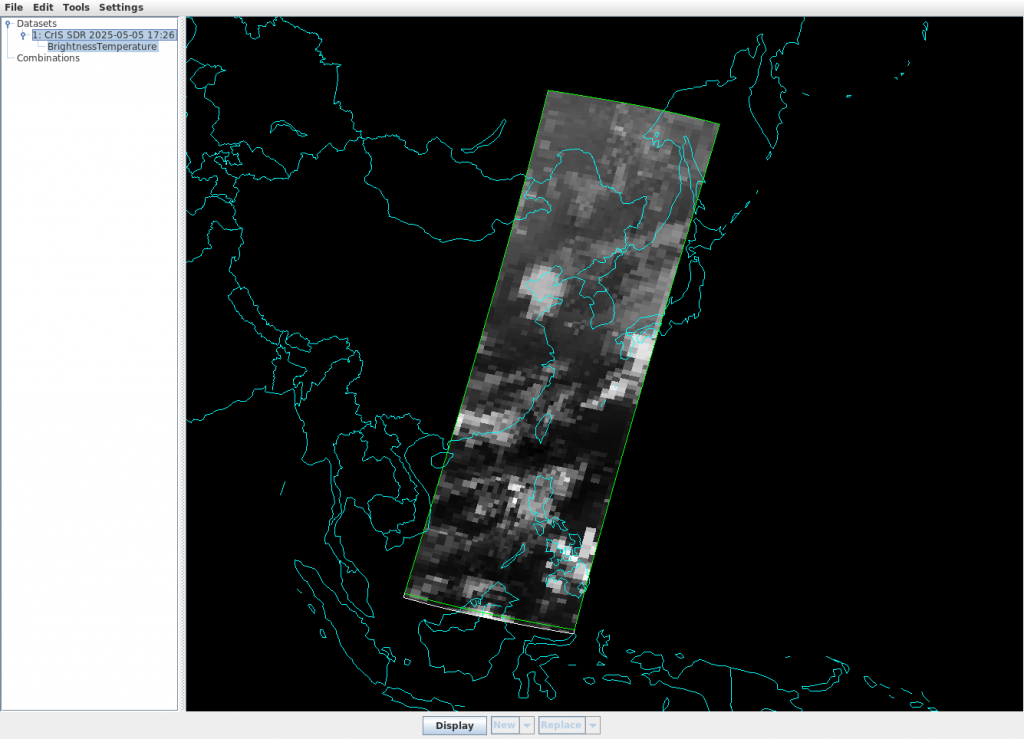
Dust RGB imagery (here is a larger version) from GK2A at 1720 UTC on 5 May 2025, above, show the distinct bright pink signature of dust along the east coast of China. Airmass RGB imagery (larger version) at the same time shows a rust/orange color as might be expected from a potential vorticity anomaly (GK2A imagery is from this KMA website). NOAA-21 overflew eastern China just after the imagery above. What did the atmospheric spectra from the CrIS instrument on NOAA-21 show? As discussed here and here, Hydra software within McIDAS-V can be used to display CrIS spectra. The partial NOAA-21 data swath is shown below within Hydra.
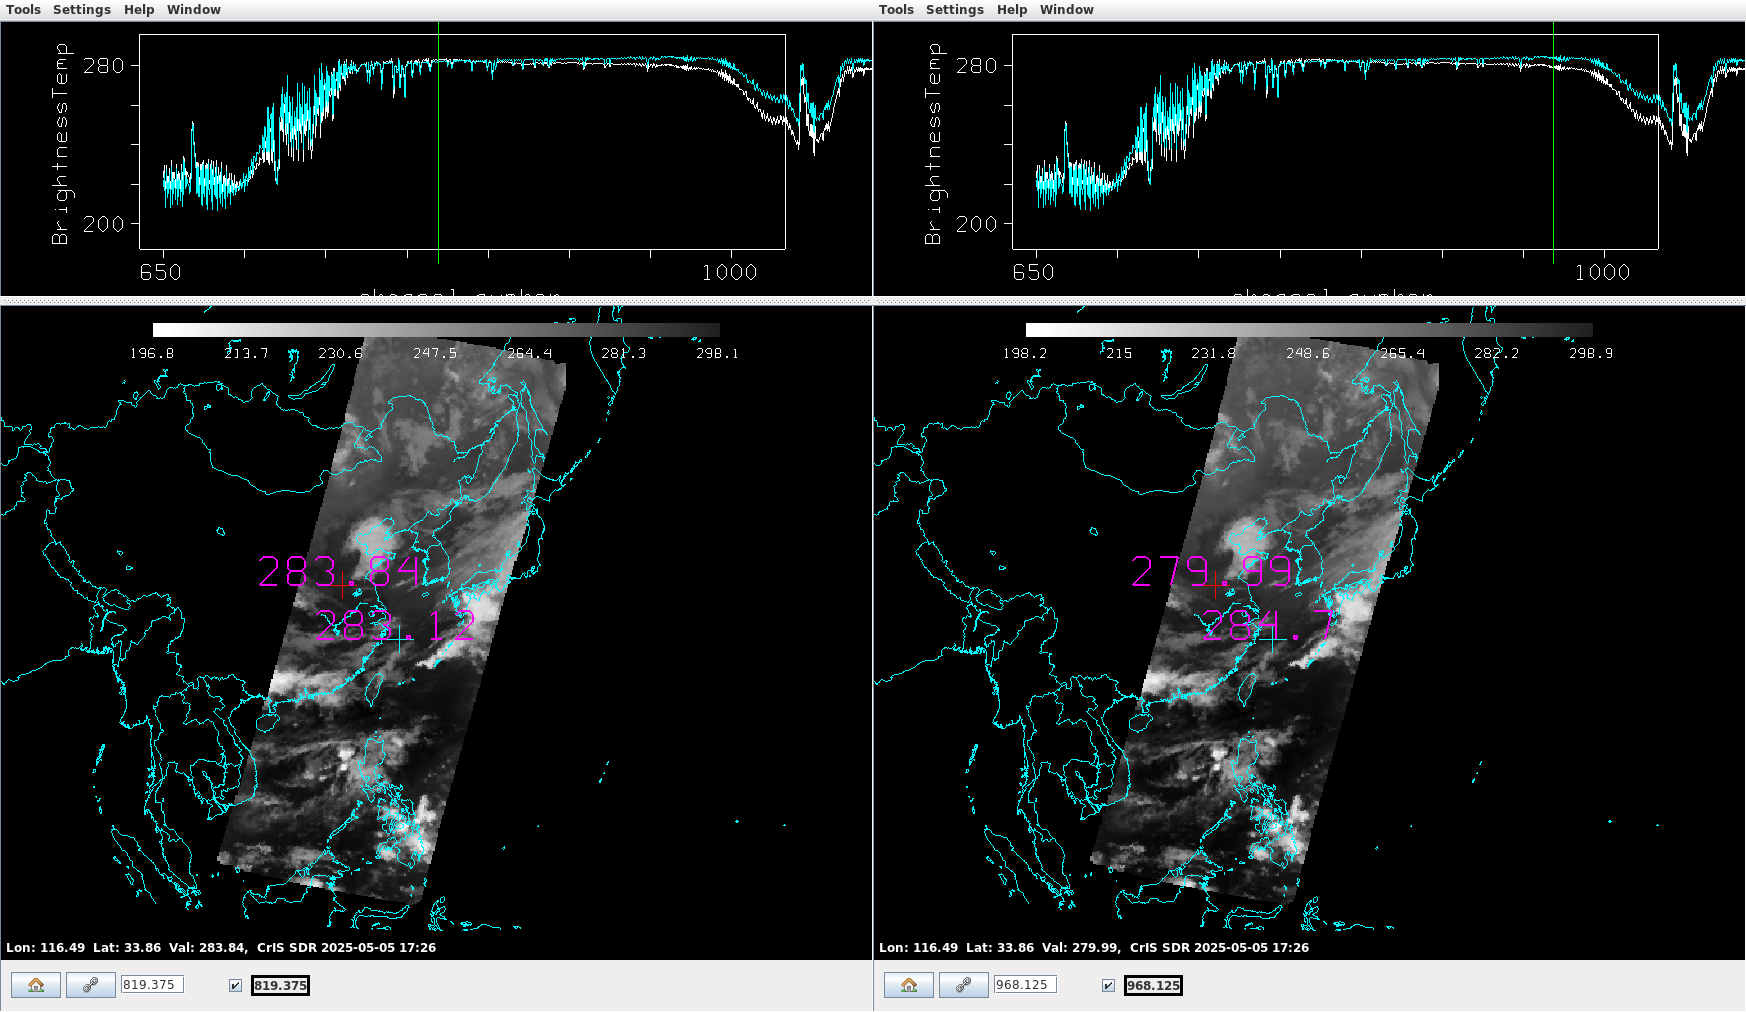
The plots below show two (identical) longwave infrared spectra (in white and in cyan) as a function of wavenumber at the two points that are plotted on the two different greyscale plots at the bottom of the figure. One point, depicted by a red cross-hatch, corresponds to the white line in the spectral plots; the second, depicted by the cyan cross-hatch, corresponds to the cyan line in the spectral plots. The probed brightness temperature near the region of the bright pink dust RGB signature is warmer at 12.2 µm (283.84 K) than at 10.3 µm (279.99 K); the brightness temperature over the western Pacific at some distance from that pink dust RGB signature is colder at 12.2 µm (283.12 K) than at 10.3 µm (284.7 K). This difference in the differences reflects more absorption by dust of 10.3 µm radiation at the red cross-hatch, and more absorption by water vapor of 12.2 µm radiation at the cyan cross-hatch. Note in the spectral plot how the spectra that has the warmed brightness temperatures is a function of wavenumber. If you had a geostationary sounder viewing this event, the spectrum you see as dust starts to move over will be affected in noticeable ways, just as in this case.