Strong thunderstorms along a cold front moving across Argentina and Uruguay
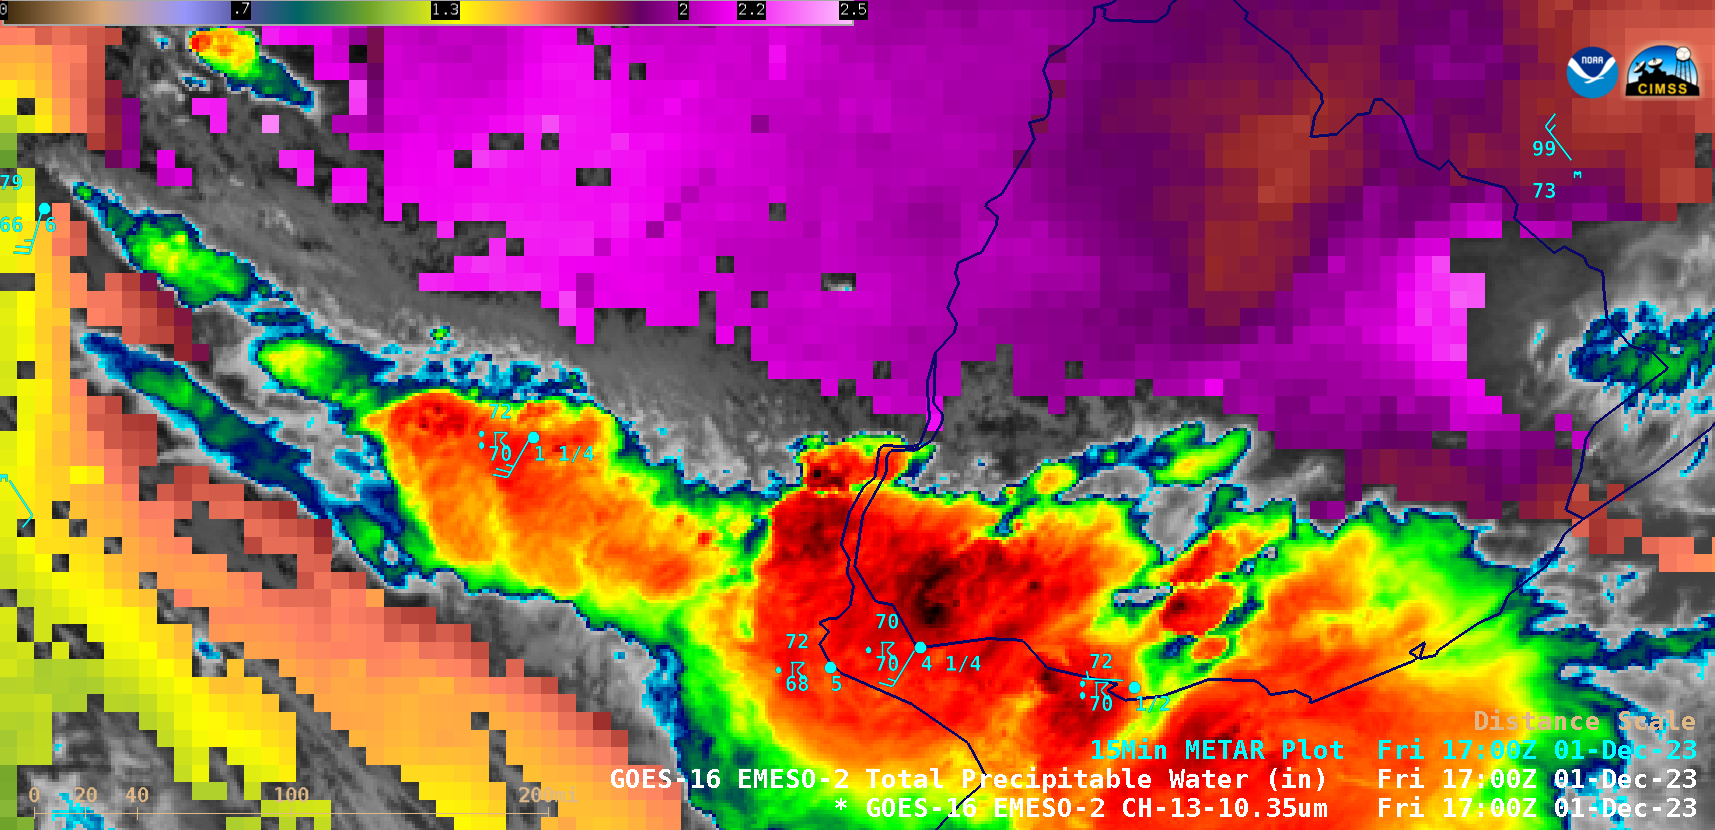
1-minute GOES-16 “Clean” Infrared Window (10.3 µm) images combined with the Total Precipitable Water derived product (in cloud-free areas), from 0900 UTC on 01 December to 1200 UTC on 02 December [click to play MP4 animation]
At Montevideo (METAR site SUAA, located along the southern coast of Uruguay), thunderstorms produced a peak wind gust of 54 knots (62 mph) at 1615 UTC on 01 December (below) — along with rainfall of 80 mm (3.15 in) in a 6-hour period, resulting in significant flooding.
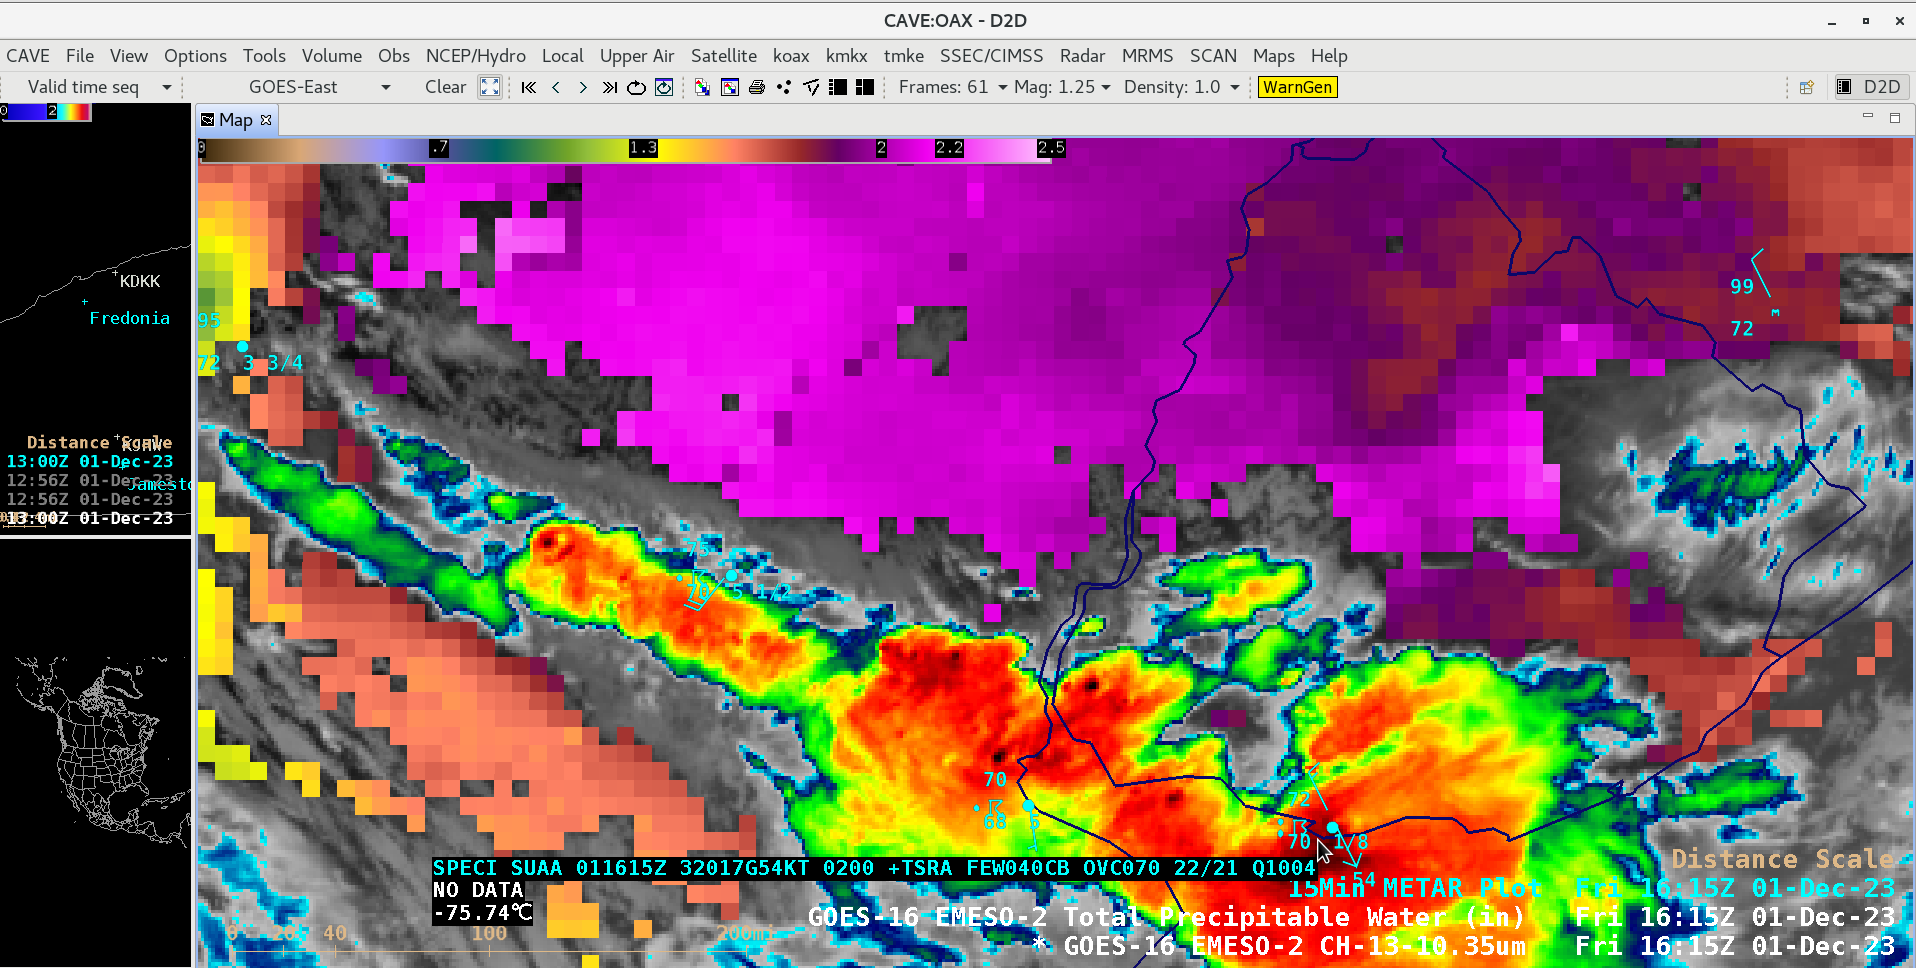
GOES-16 “Clean” Infrared Window (10.3 µm) + Total Precipitable Water derived product at 1615 UTC on 01 December, with cursor sampling of the METAR at SUAA [click to enlarge]
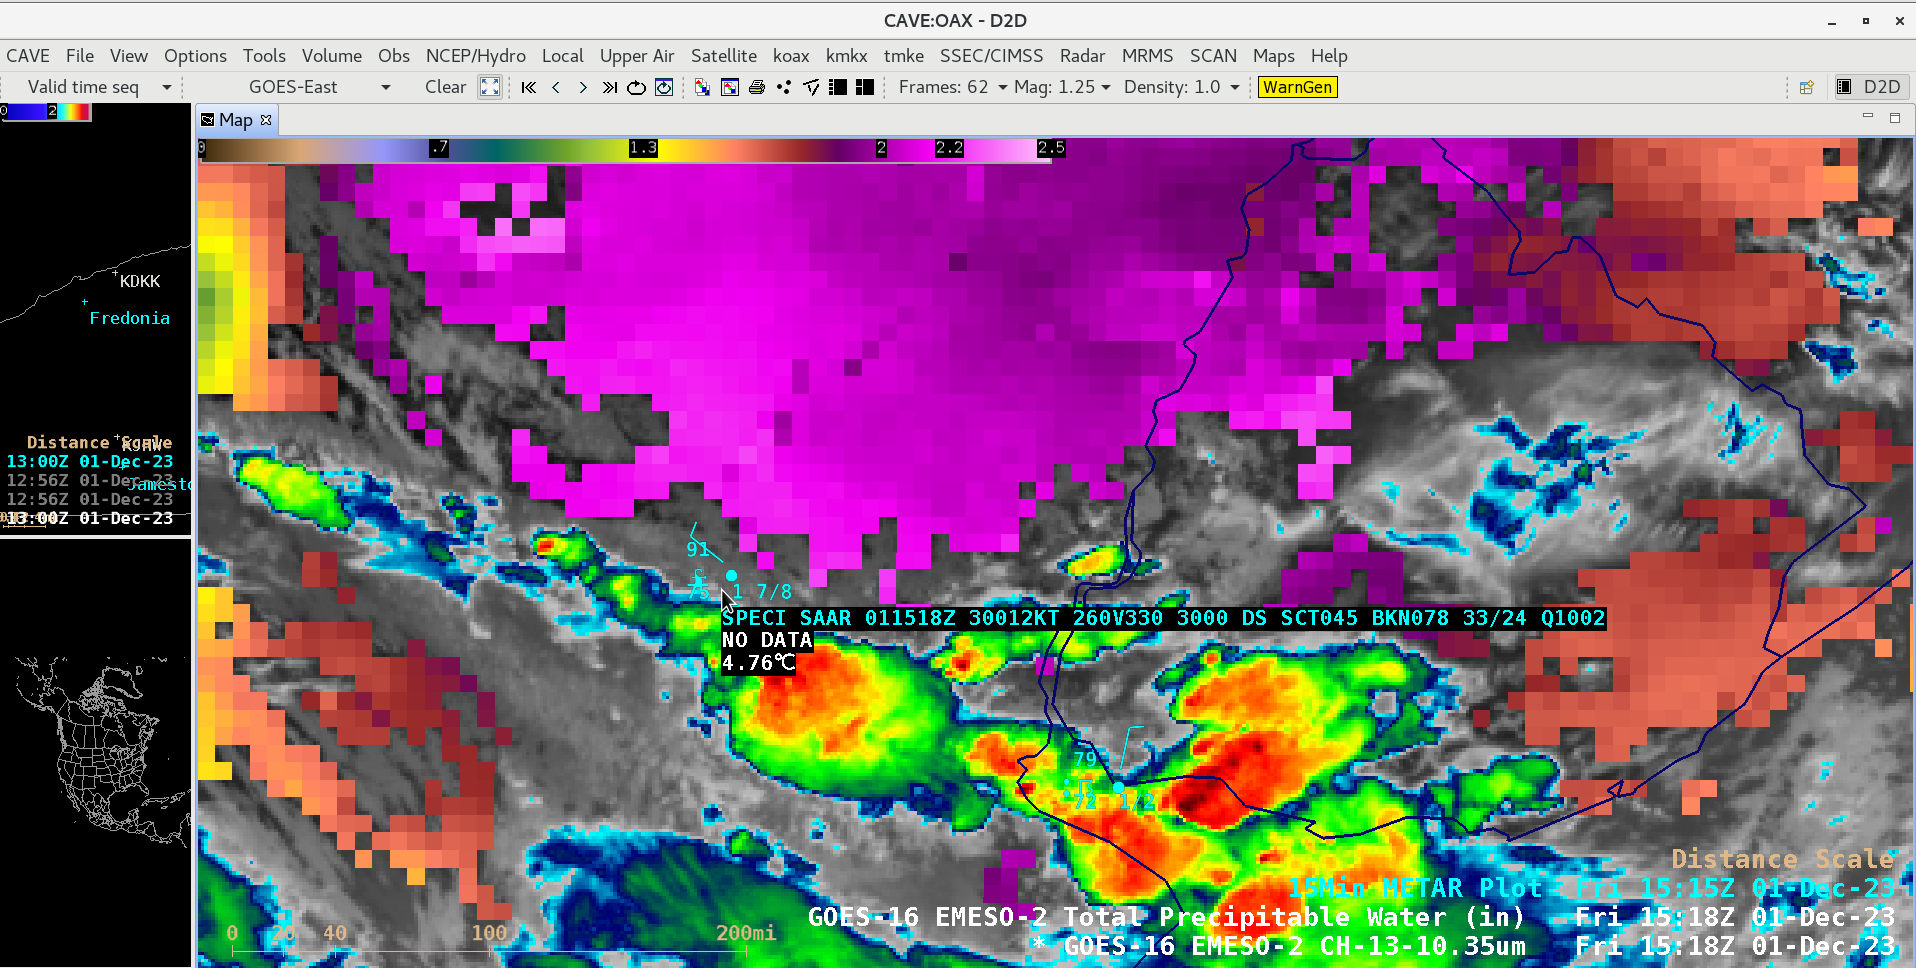
GOES-16 “Clean” Infrared Window (10.3 µm) + Total Precipitable Water derived product at 1518 UTC on 01 December, with cursor sampling of the METAR at SAAR [click to enlarge]
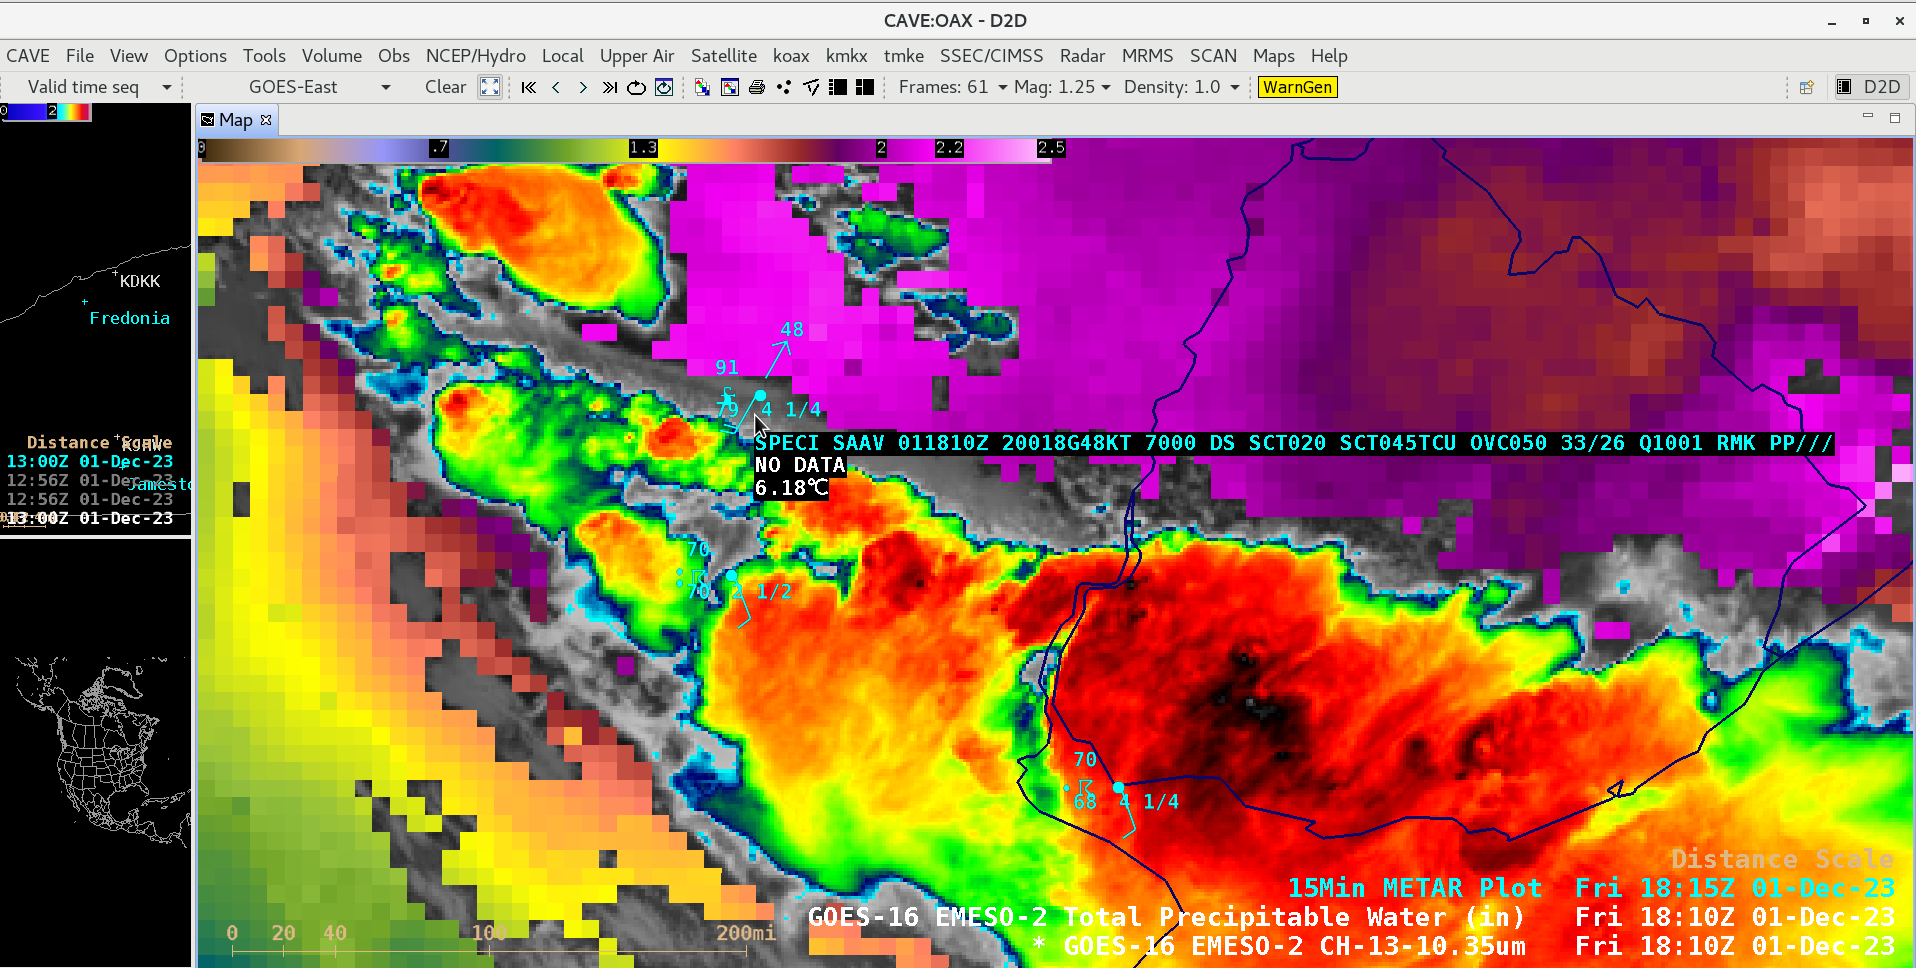
GOES-16 “Clean” Infrared Window (10.3 µm) + Total Precipitable Water derived product at 1810 UTC on 01 December, with cursor sampling of the METAR at SAAV [click to enlarge]
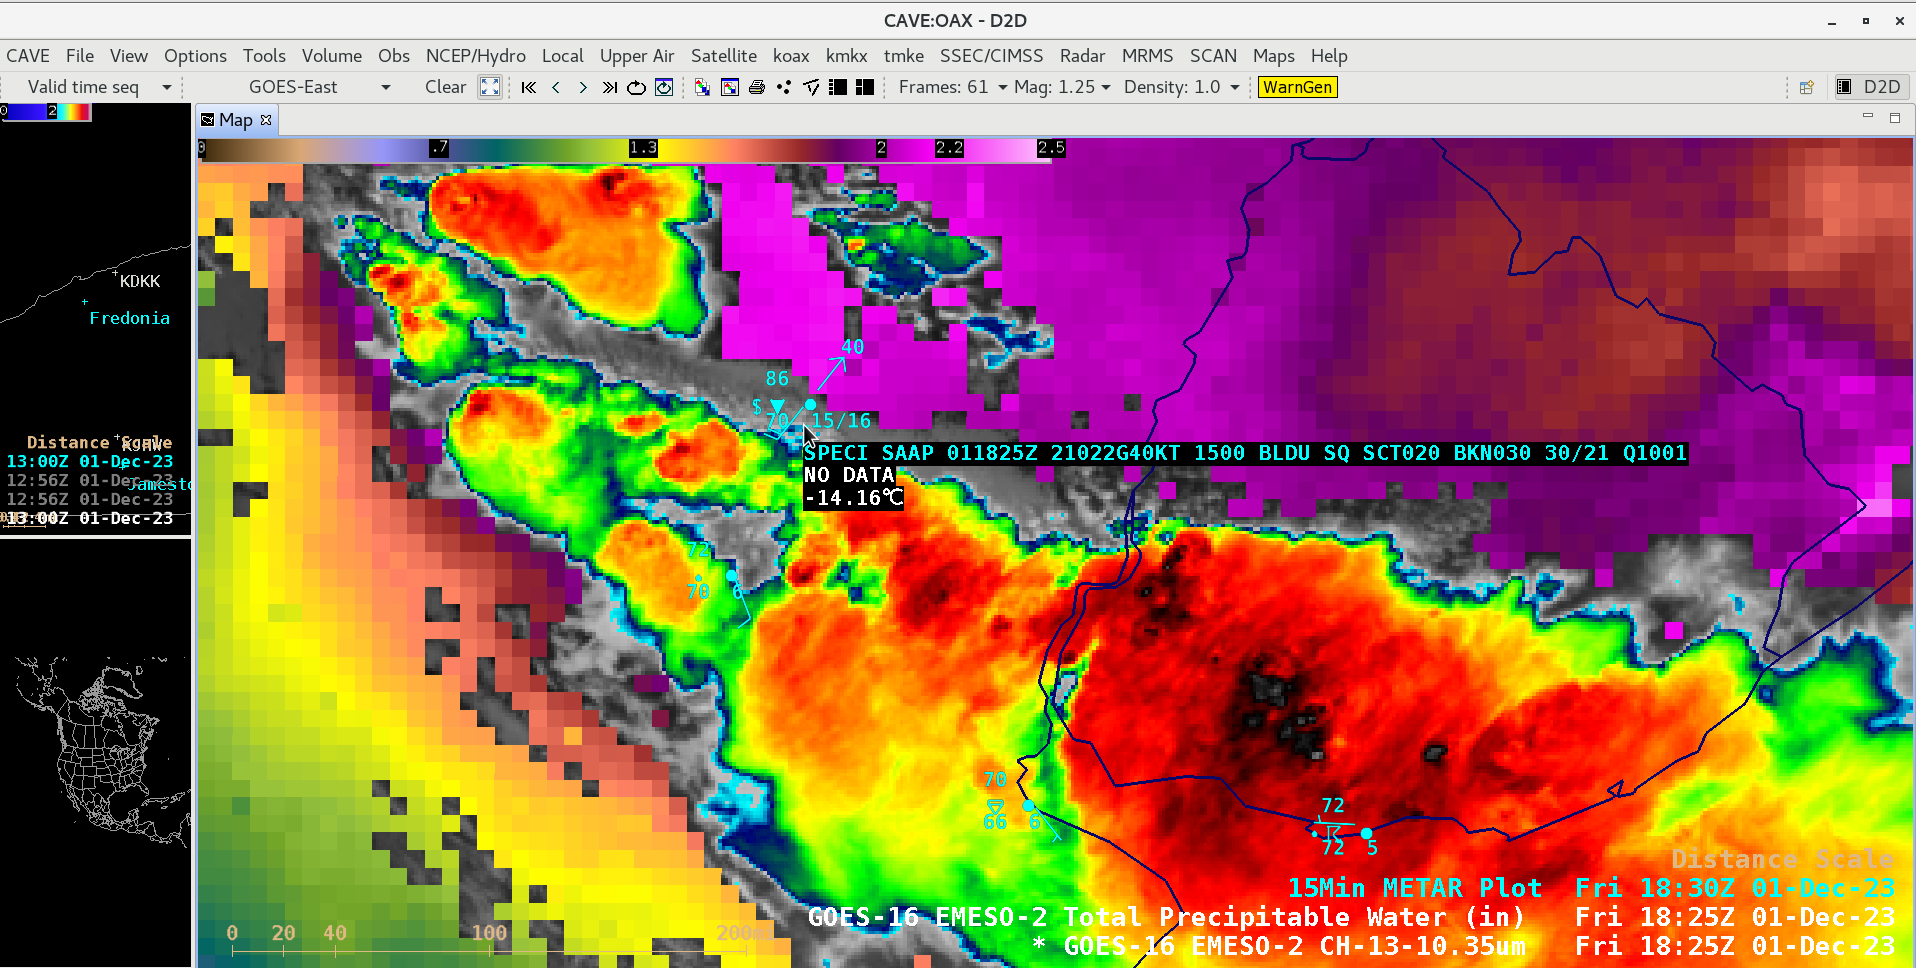
GOES-16 “Clean” Infrared Window (10.3 µm) + Total Precipitable Water derived product at 1825 UTC on 01 December, with cursor sampling of the METAR at SAAP [click to enlarge]
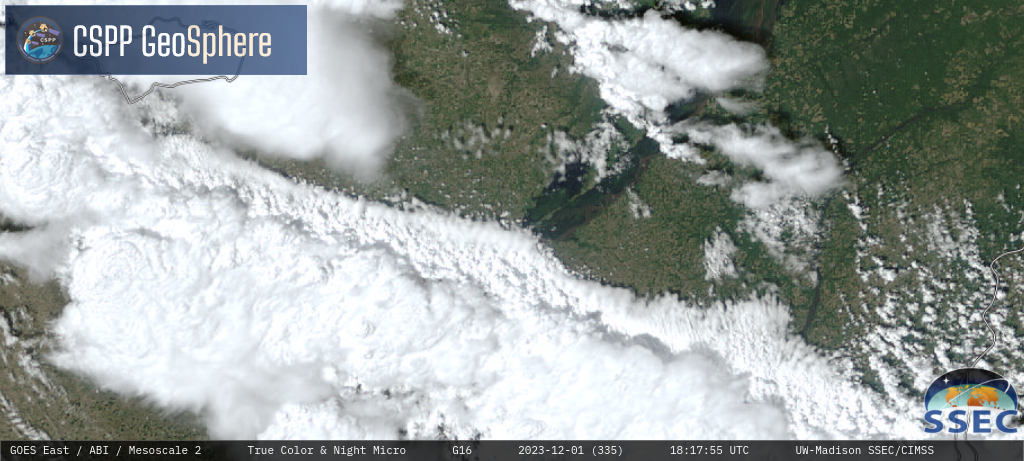
1-minute GOES-16 True Color RGB images, from 1700 UTC to 1900 UTC on 01 December [click to play MP4 animation]