This website works best with a newer web browser such as Chrome, Firefox, Safari or Microsoft
Edge. Internet Explorer is not supported by this website.
10-minute JMA Himawari-9 AHI “Red” Visible (0.64 µm), Shortwave Infrared (3.9 µm) and “Clean” Infrared Window (10.4 µm) images (above) showed the formation of 2 pyrocumulonimbus (pyroCb) clouds spawned by a wildfire in Sichuan Province, China on 16 March 2024. The initial (smaller, shorter-lived) pyroCb developed at 0820 UTC —... Read More
Himawari-9 “Red” Visible (0.64 µm, top), Shortwave Infrared (3.9 µm, middle) and “Clean” Infrared Window (10.4 µm, bottom) images, from 0600-1100 UTC on 16 March [click to play animation | MP4]
10-minute JMA Himawari-9 AHI “Red” Visible (0.64 µm), Shortwave Infrared (3.9 µm) and “Clean” Infrared Window (10.4 µm) images (above) showed the formation of 2 pyrocumulonimbus (pyroCb) clouds spawned by a wildfire in Sichuan Province, China on 16 March 2024. The initial (smaller, shorter-lived) pyroCb developed at 0820 UTC — exhibiting cloud-top 10.4 µm infrared brightness temperatures of -40ºC and colder, denoted by the shades of blue — with the second (larger, somewhat longer-lived) pyroCb developing at 0910 UTC. The wildfire began to make a rapid northeastward run during the ~5 hour period shown in the animation. The fire environment across that region became more favorable as wind speeds increased with the approach of a deepening surface cyclone, as shown in surface analyses (the pyroCb-producing wildfire was located near 30º N latitude, 131º E longitude).
Himawari-9 True Color RGB images created using Geo2Grid(below) showed the east-northeast transport of the wildfire smoke plume, with its embedded pyroCb cloud.
JMA Himawari-9 True Color RGB images, from 0610-1050 UTC on 16 March [click to play animated GIF | MP4]
It’s spring time on the Great Plains, which means strong dynamical systems that often bring blizzards as well as severe thunderstorms. A long-wave trough with an embedded 850-500mb jet streak created cyclogenesis in western Oklahoma and southwest Kansas on March 13, with associated low-level moisture return into eastern Kansas.The strong... Read More
It’s spring time on the Great Plains, which means strong dynamical systems that often bring blizzards as well as severe thunderstorms. A long-wave trough with an embedded 850-500mb jet streak created cyclogenesis in western Oklahoma and southwest Kansas on March 13, with associated low-level moisture return into eastern Kansas.
The strong instability and excellent wind shear spawned rapidly growing thunderstorms (some of which are highlighted in this blog post). ProbSevere LightningCast, which is a deep-learning model that uses GOES ABI to predict next-hour lightning, showed high probabilities on this convection 20-30 minutes before the first flashes.
LightningCast probability of lightning (contours), GOES-16 Natural Color imagery, and GOES-16 GLM flash-extent density (blue-to-yellow foreground pixels) over eastern Kansas.
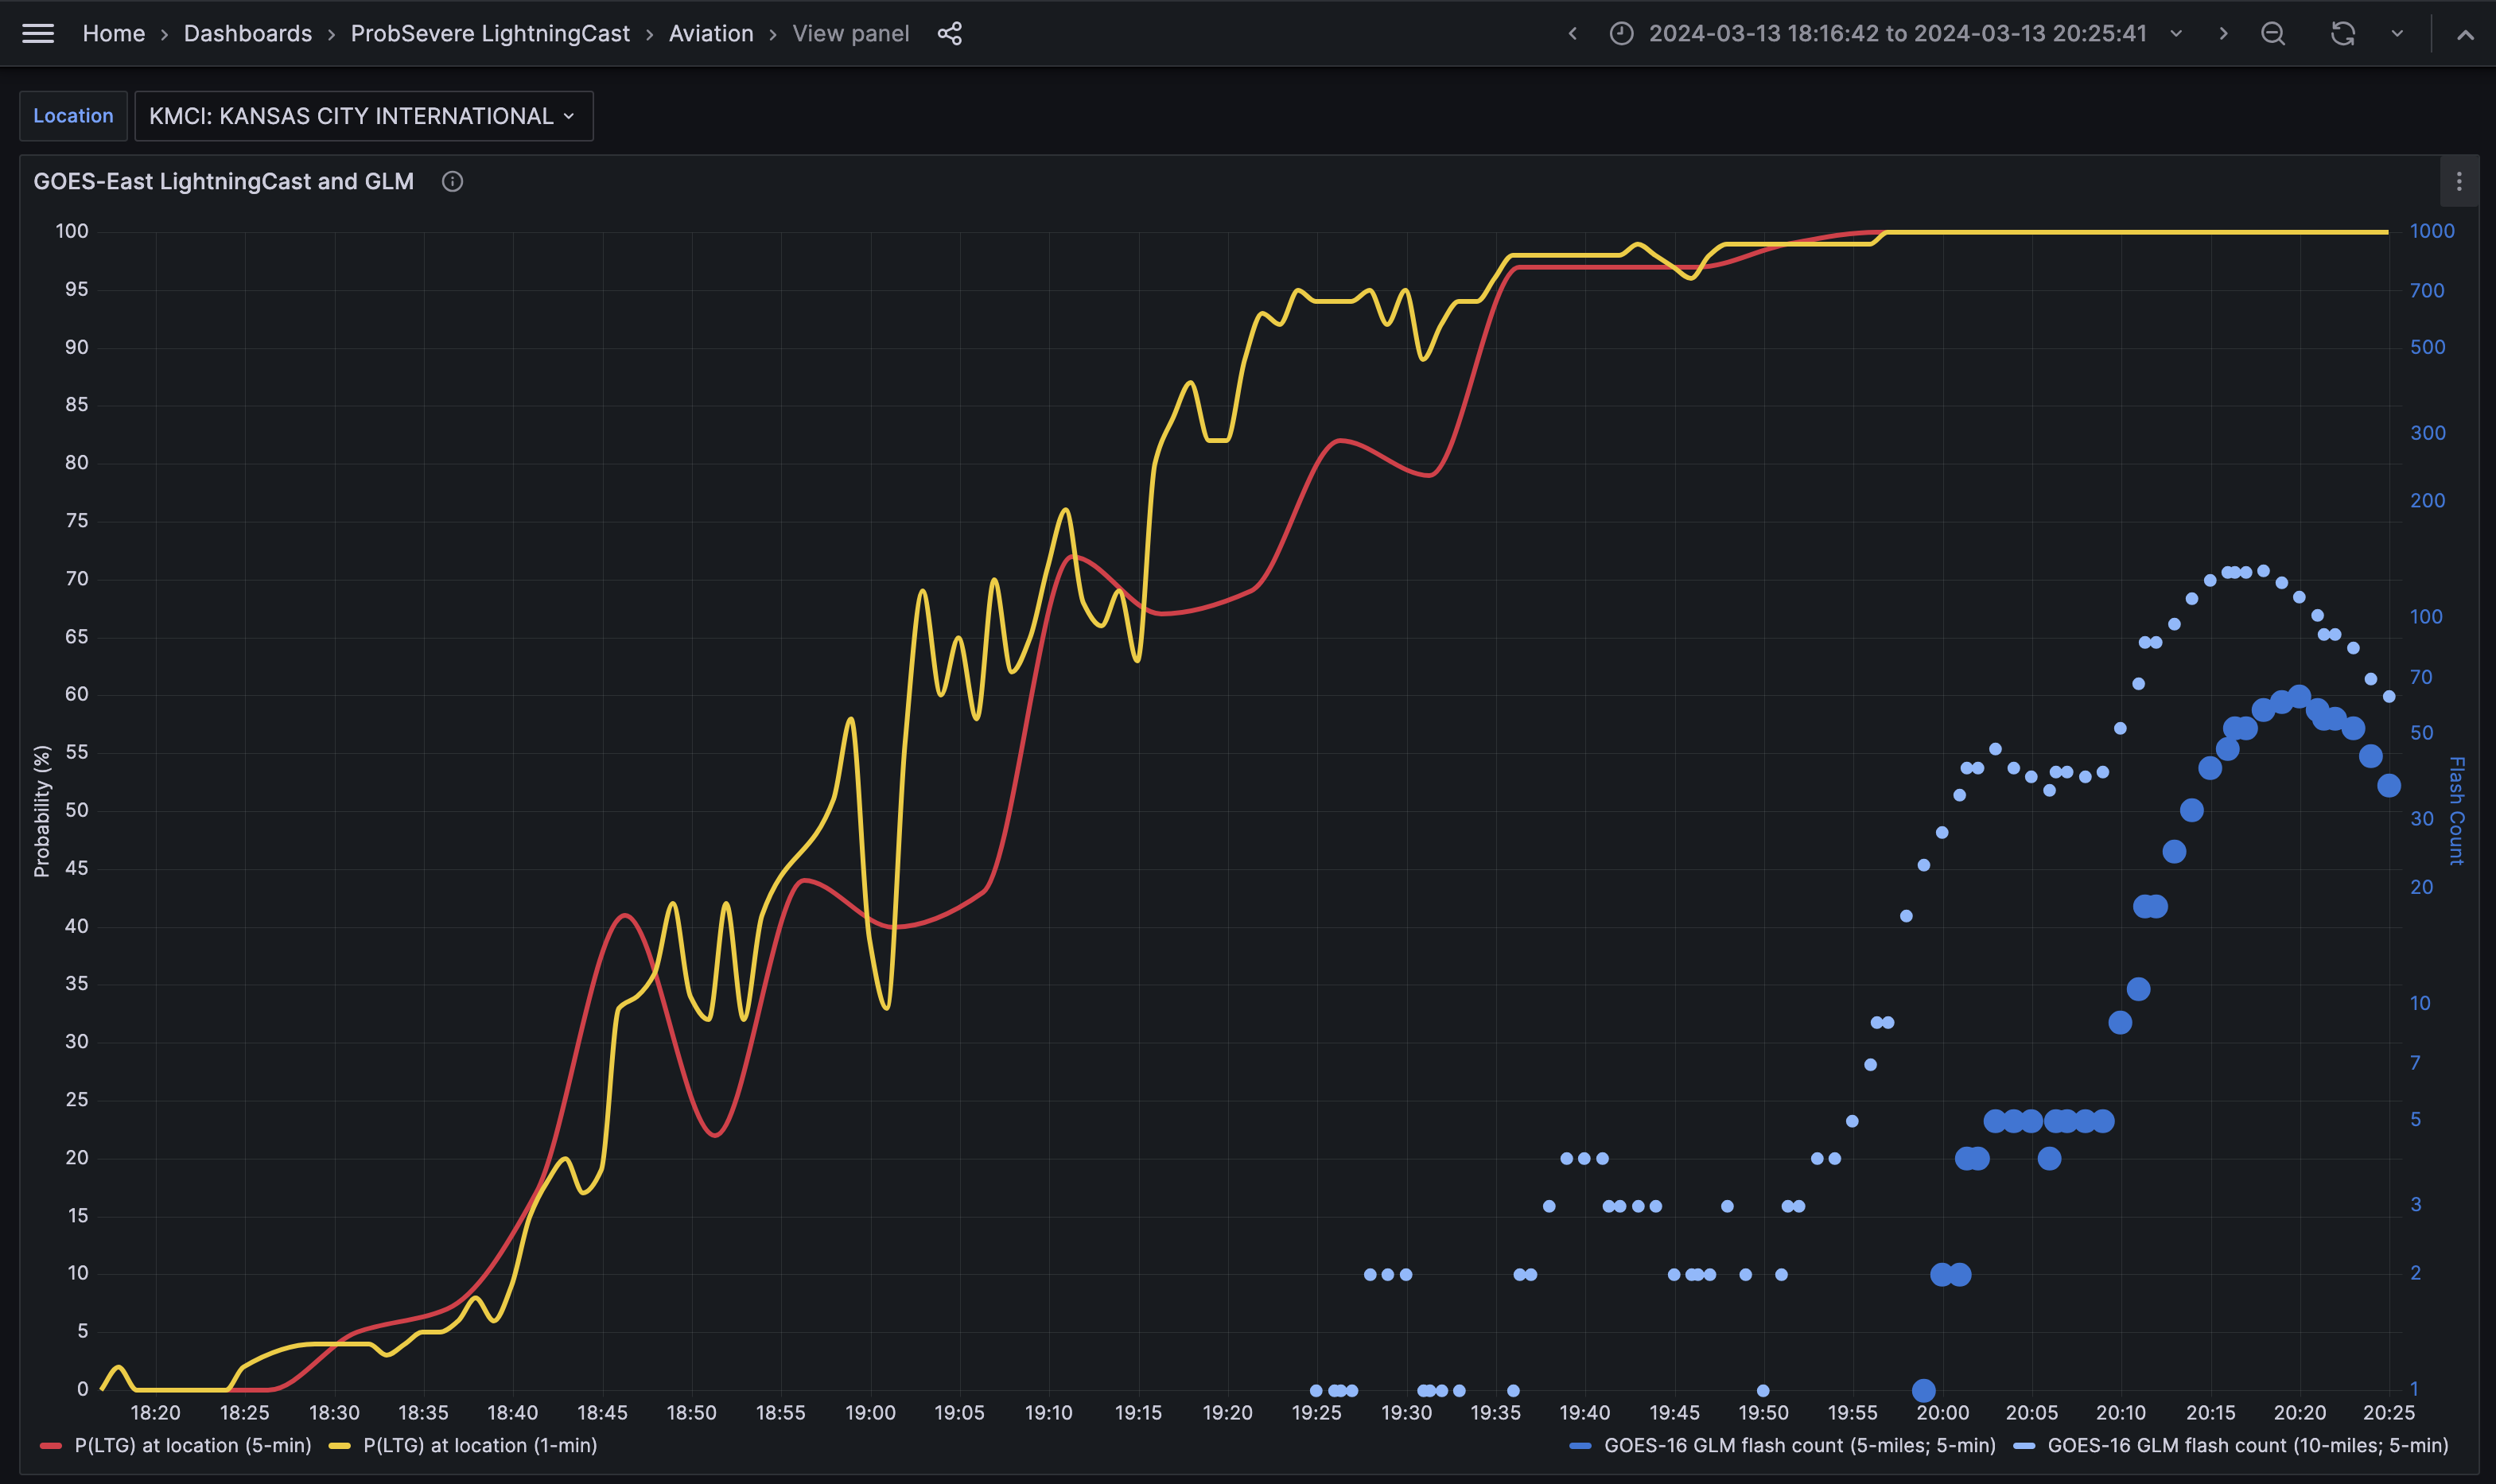
While LightningCast is scheduled to become operational in NOAA in later 2024, new enhancements will be evaluated in NOAA’s Hazardous Weather Testbed in 2024, including the probability of >=10 flashes in the next 60 min, and a GOES-West-only model (trained on GOES-18 data). One important aspect that will be evaluated are lightning dashboards. These time series of the probability of lightning and observed GLM flashes can serve meteorologists providing impacts-based decision support for large venues like stadiums, concerts, fairs, and amusement parks. The dashboard below shows the progression of LightningCast probabilities and GOES-16 Geostationary Lightning Mapper (GLM) flashes near Kansas City International Airport as storms approached.
Time series of LightningCast 1-min (yellow) and 5-min (red) probabilities of lightning in 60 min, and GLM observed flash counts within 10 miles (small blue points) and 5 miles (large blue points) of Kansas City International Airport.
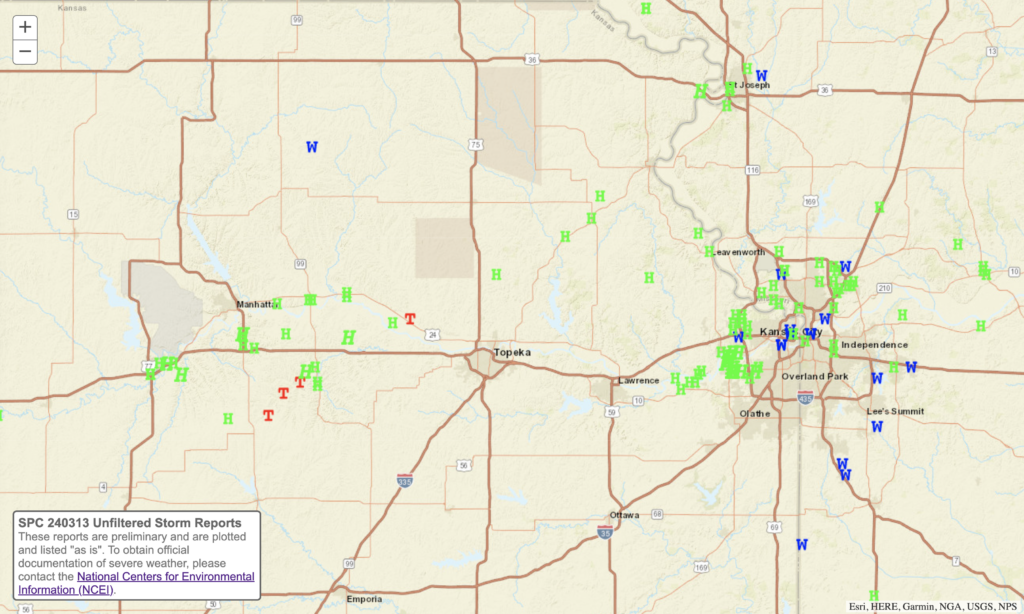
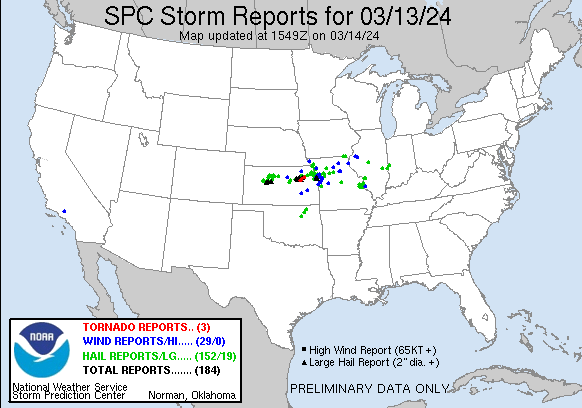
As storms became severe, the Kansas City metro region got hammered with hailstones up to 3″ in diameter, while tornadoes touched down between Manhattan and Topeka.
Preliminary severe weather reports from NOAA’s Storm Prediction Center.
The ProbSevere v3 models track developing thunderstorms and use use radar, satellite, lightning data, and near-term near-storm environment data from the HRRR model to predict next-hour severe weather probabilities of hail, wind, and tornado. This guidance improves confidence for forecasters in their warning-decision making and helps provide enhanced situational awareness of how storms are evolving. Scientists are exploring methods to exploit polarimetric radar data and the important spatial aspects of radar and satellite data, to further improve the models’ accuracy.
Severe-hail-producing storms with ProbSevere probabilities (contours), MRMS MergedReflectivity, and NWS severe weather warnings (yellow polygons) for storms near the Kansas City metro area.
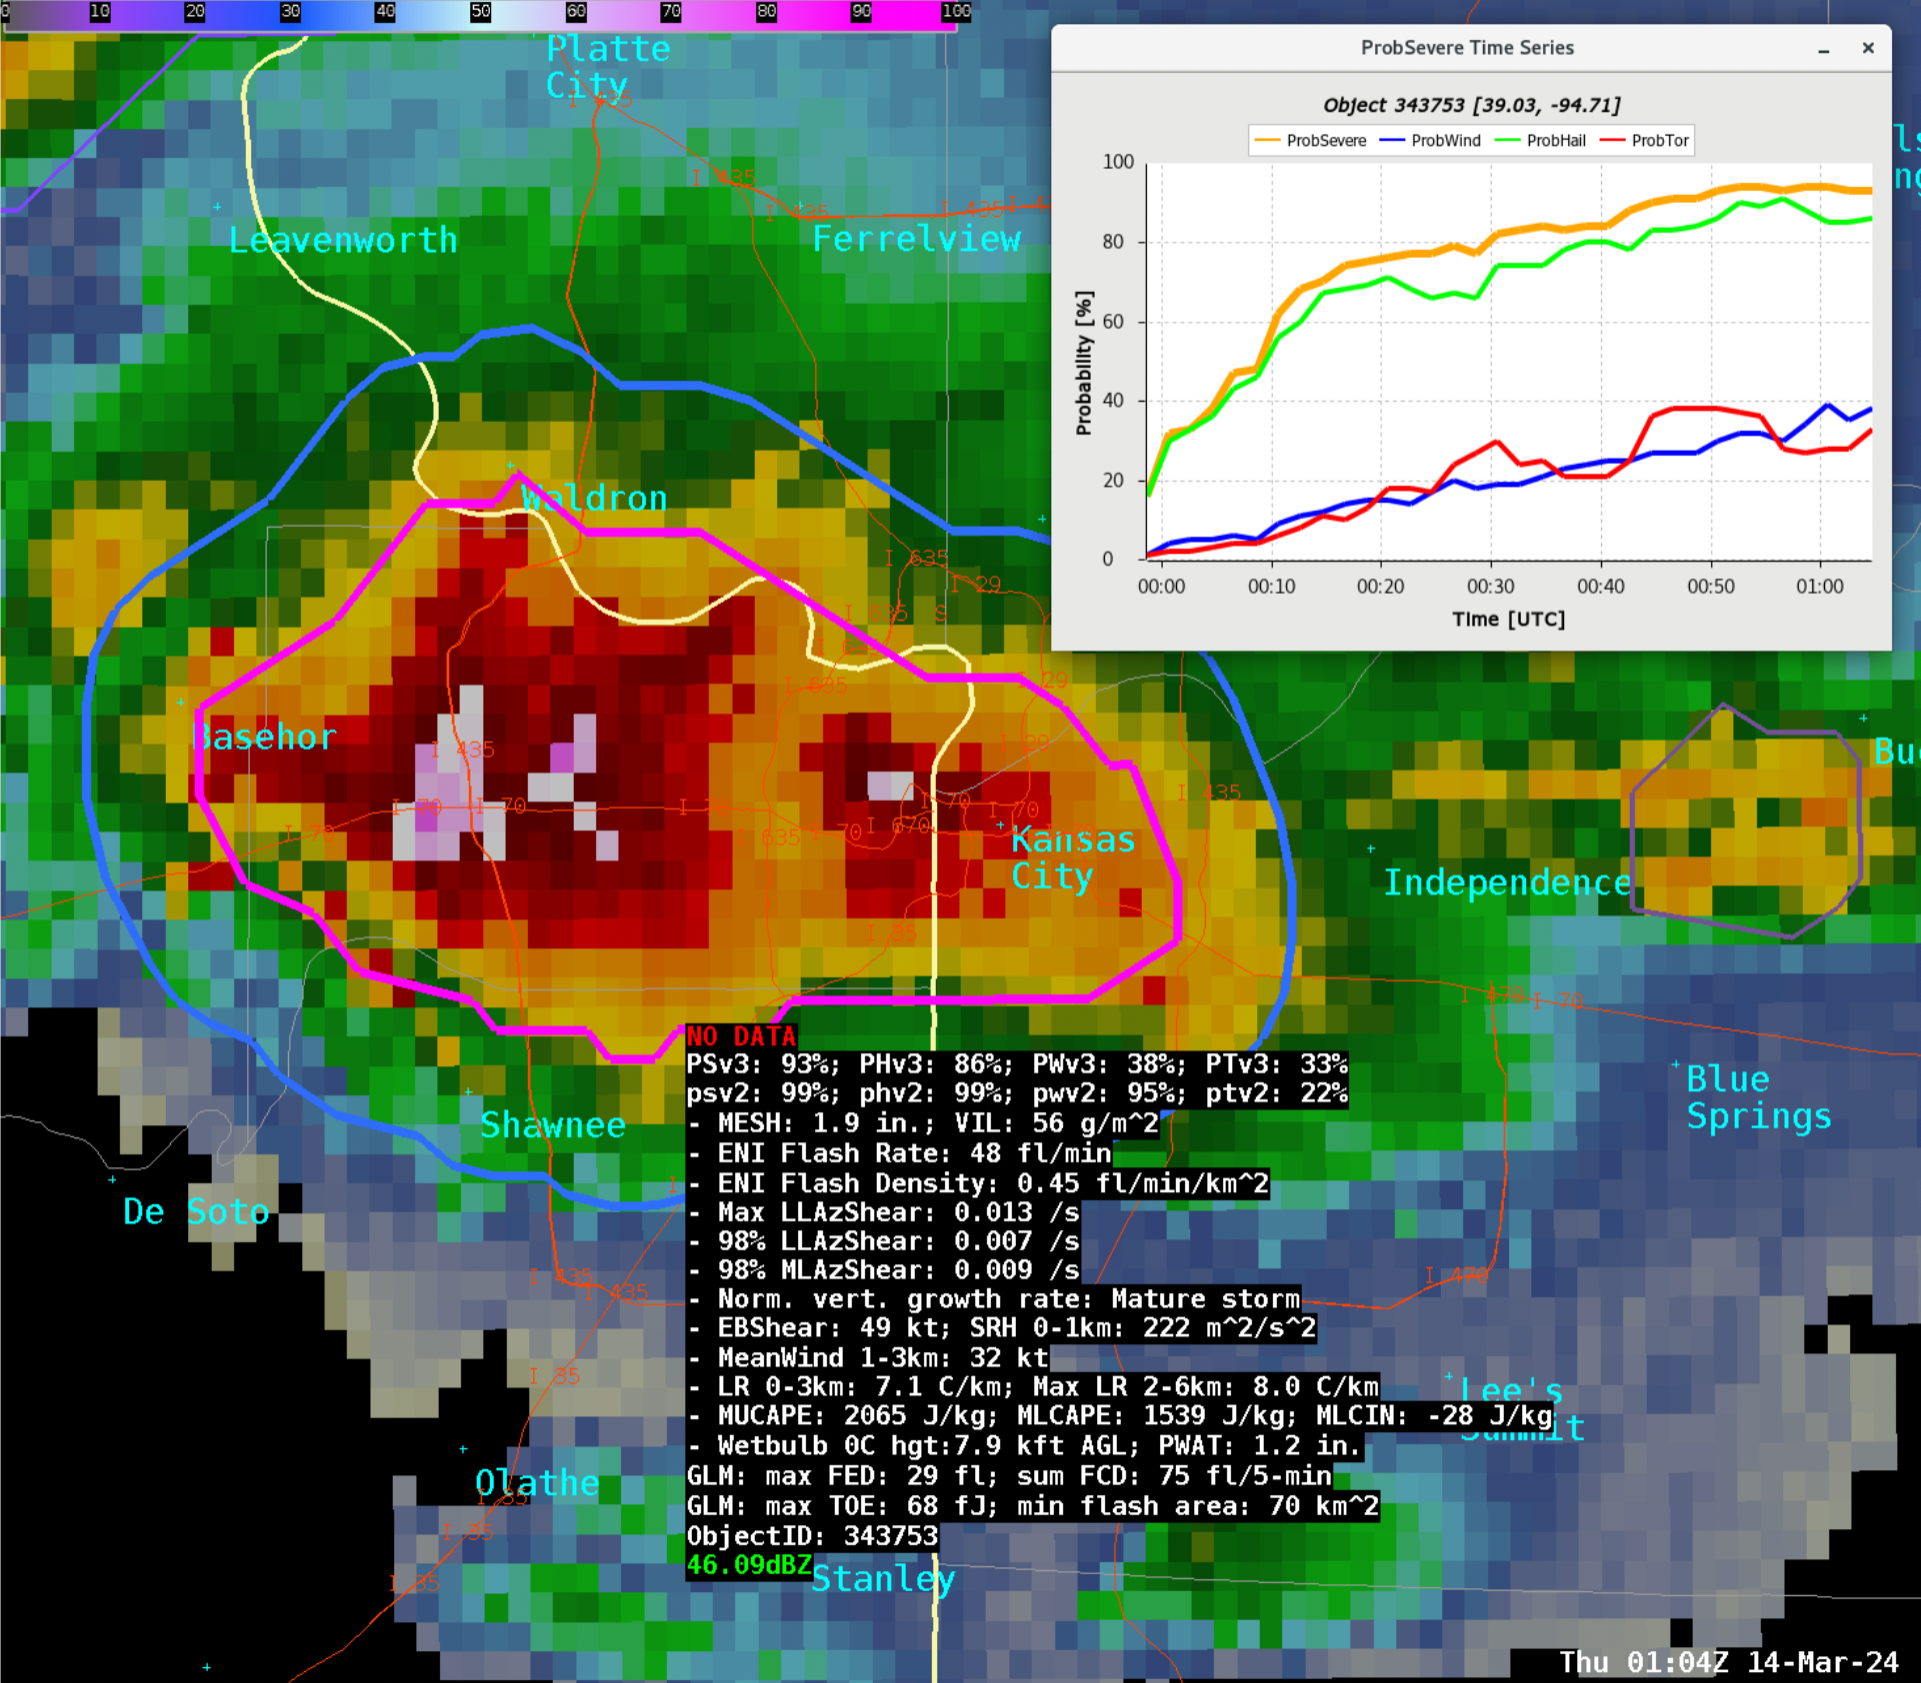
This method of data fusion and probabilistic guidance is especially useful in busy situations with numerous rapidly evolving storms with multiple threats (see below, in eastern Kansas). The quick-look probabilities, cursor read-out, and time series functionality help forecasters make more efficient and effective warning decisions.
Multiple severe storms with ProbSevere probabilities (contours), MRMS MergedReflectivity, and NWS severe weather warnings (yellow and red polygons) for storms in eastern Kansas along I-70.A storm dropping large hail in the Kansas City metro area. The inner contour is colored by the probability of any severe hazard (hail, wind, or tornado), while the outer probability contour is colored by the probability of tornado. Probability and predictor readout appears when a user hovers over a ProbSevere. Users can also double-click for a time series of how the probabilities have evolved in the latest hour.
Another machine-learning model developed at CIMSS is the IntenseStormNet, which uses GOES-R ABI and GLM images to detect “intense” convection, as viewed from a geostationary satellite perspective. This model excels at isolating the most intense parts of storms in developing and mature convection using a computer-vision approach, which holistically uses features like strong overshooting tops, above-anvil cirrus plumes, cold-U signatures, and strong anvil-edge gradients to predict probabilities.
IntenseStormNet probabilities (contours), GOES-16 Ch02+Ch13 “sandwich” imagery, and severe weather reports for rapidly developing convection over Oklahoma.
IntenseStormNet is particularly valuable when radar coverage is diminished, but still adds value to ProbSevere v3 models even in the presence of good radar coverage. The final movie shows a zoomed-out view of IntenseStormNet applied to all of the convection in the central U.S. on March 14.
IntenseStormNet probabilities (contours), GOES-16 Ch02+Ch13 “sandwich” imagery, and severe weather reports for widespread convection over the central U.S.
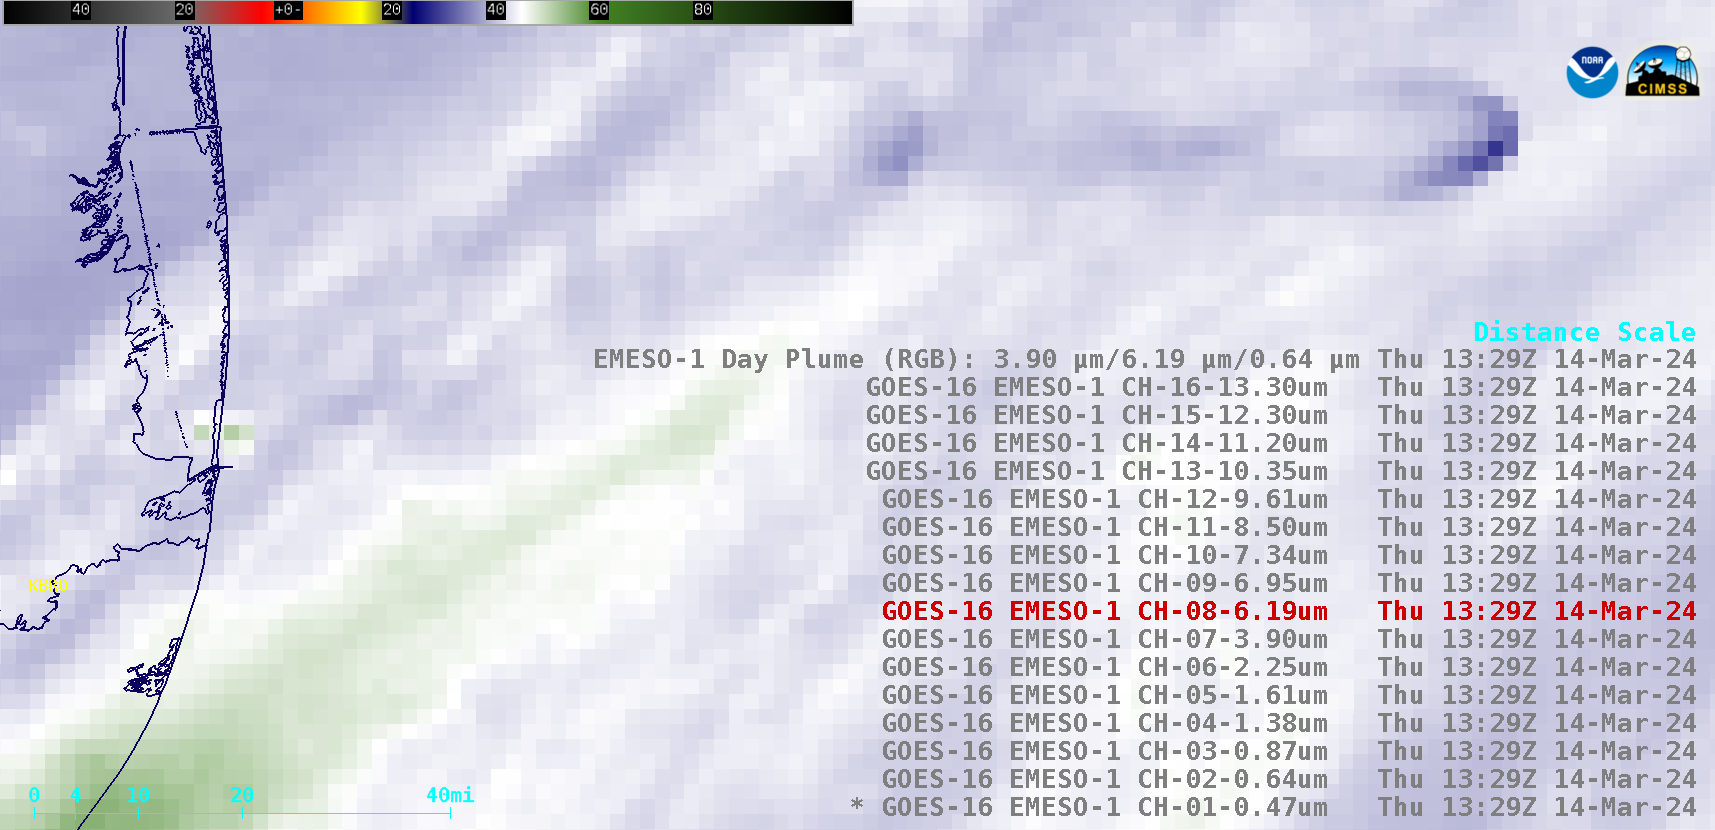
1-minute Mesoscale Domain Sector GOES-16 (GOES-East) images from all 16 of the ABI spectral bands plus a Rocket Plume RGB (above) displayed signatures of the SpaceX Starship 3 rocket that was launched from the Starbase facility in Boca Chica Beach, Texas at 1325 UTC on 14 March 2024. During the first 4 minutes post-launch, the Stage... Read More
1-minute GOES-16 images of ABI spectral bands 01-16 and a Rocket Plume RGB, from 1324-1329 UTC on 14 March; KBRO denotes the Brownsville TX rawinsonde site [click to play animated GIF | MP4]
1-minute Mesoscale Domain Sector GOES-16 (GOES-East) images from all 16 of the ABI spectral bands plus a Rocket Plume RGB(above) displayed signatures of the SpaceX Starship 3 rocket that was launched from the Starbase facility in Boca Chica Beach, Texas at 1325 UTC on 14 March 2024. During the first 4 minutes post-launch, the Stage 1 rocket booster’s condensation cloud was evident in images from all 16 spectral bands, as it began to drift slowly eastward away from the Texas coast — and the ascending rocket booster’s thermal signature was seen in Near-Infrared and Infrared spectral bands 04-16, as well as the Rocket Plume RGB.
In Band 8 (Upper-level Water Vapor) imagery, note the change in exhaust plume shape with time and atmospheric layer: at early altitudes of 20-50 km (where the Stratosphere had more density, and therefore higher ambient pressure), the Stage 1 booster plume was more linear — but after the 1328 UTC “hot stage separation” as the Stage 2 rocket reached higher altitudes of 70-80 km (where the Mesosphere was much less dense, with lower ambient pressure) the plume was able to expand outward into more of a curved “boomerang” shape beginning at 1329 UTC.
A close-up view using a sequence of three 16-panel displays of all GOES-16 ABI spectral bands (below) showed that a warm thermal signature of the hot stage separation process was apparent at 1328 UTC in Near-Infrared bands 04-06 and Infrared bands 07-16 (just to the right of center in each image panel).
16-panel display of all GOES-16 ABI spectral bands, every minute from 1327-1329 UTC on 14 March [click to enlarge]
Interleaved GOES-16 Mesoscale Sector and CONUS Sector Upper-level Water Vapor (6.2 µm) images, from 1325-1332 UTC on 14 March [click to play animated GIF | MP4]
A larger-scale view using interleaved GOES-16 Mesoscale Sector and CONUS Sector Upper-level Water Vapor (6.2 µm) images (above) allowed the Stage 2 rocket exhaust signature to be followed for about 7 minutes post-launch as it moved eastward across the Gulf of Mexico.
Severe weather occurred over Kansas late in the day 13 March. SPC Storm Reports, shown below, indicate three tornadoes (as of 13 March) within a swath of wind and hail reports. The animation above shows the development of the strong thunderstorms along a warm front in northern Kansas. The tornado observations are... Read More
GOES-16 Clean Window Infrared (Band 13, 10.3) imagery, 2326 – 0331 UTC 13-14 March 2024 (Click to enlarge); surface observations and storm reports are also plotted.
Severe weather occurred over Kansas late in the day 13 March. SPC Storm Reports, shown below, indicate three tornadoes (as of 13 March) within a swath of wind and hail reports. The animation above shows the development of the strong thunderstorms along a warm front in northern Kansas. The tornado observations are plotted between 0046 and 0146 UTC on 14 March. They occurred within the Topeka KS CWA (WFO TOP) that is outlined in the animation above.
SPC Storm Reports, 1200 UTC 13 March – 1200 UTC 14 March 2024 (Click to enlarge)
30-second GOES-16 “Clean” Infrared Window (10.3 µm) images with Local Storm Reports plotted in cyan, from 2300 UTC on 13 March to 0247 UTC on 14 March (courtesy Scott Bachmeier, CIMSS) [click to play animated GIF | MP4]
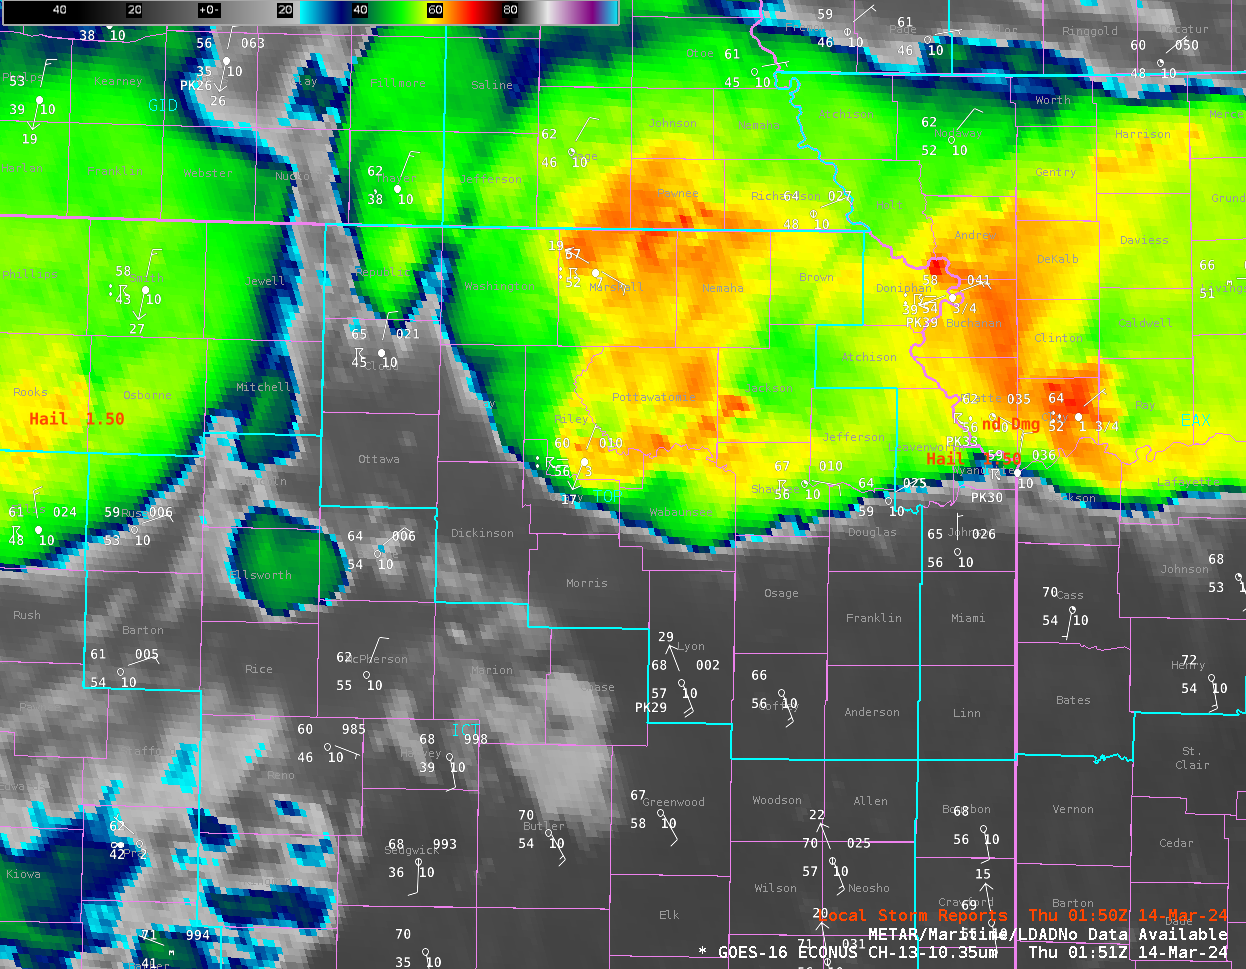
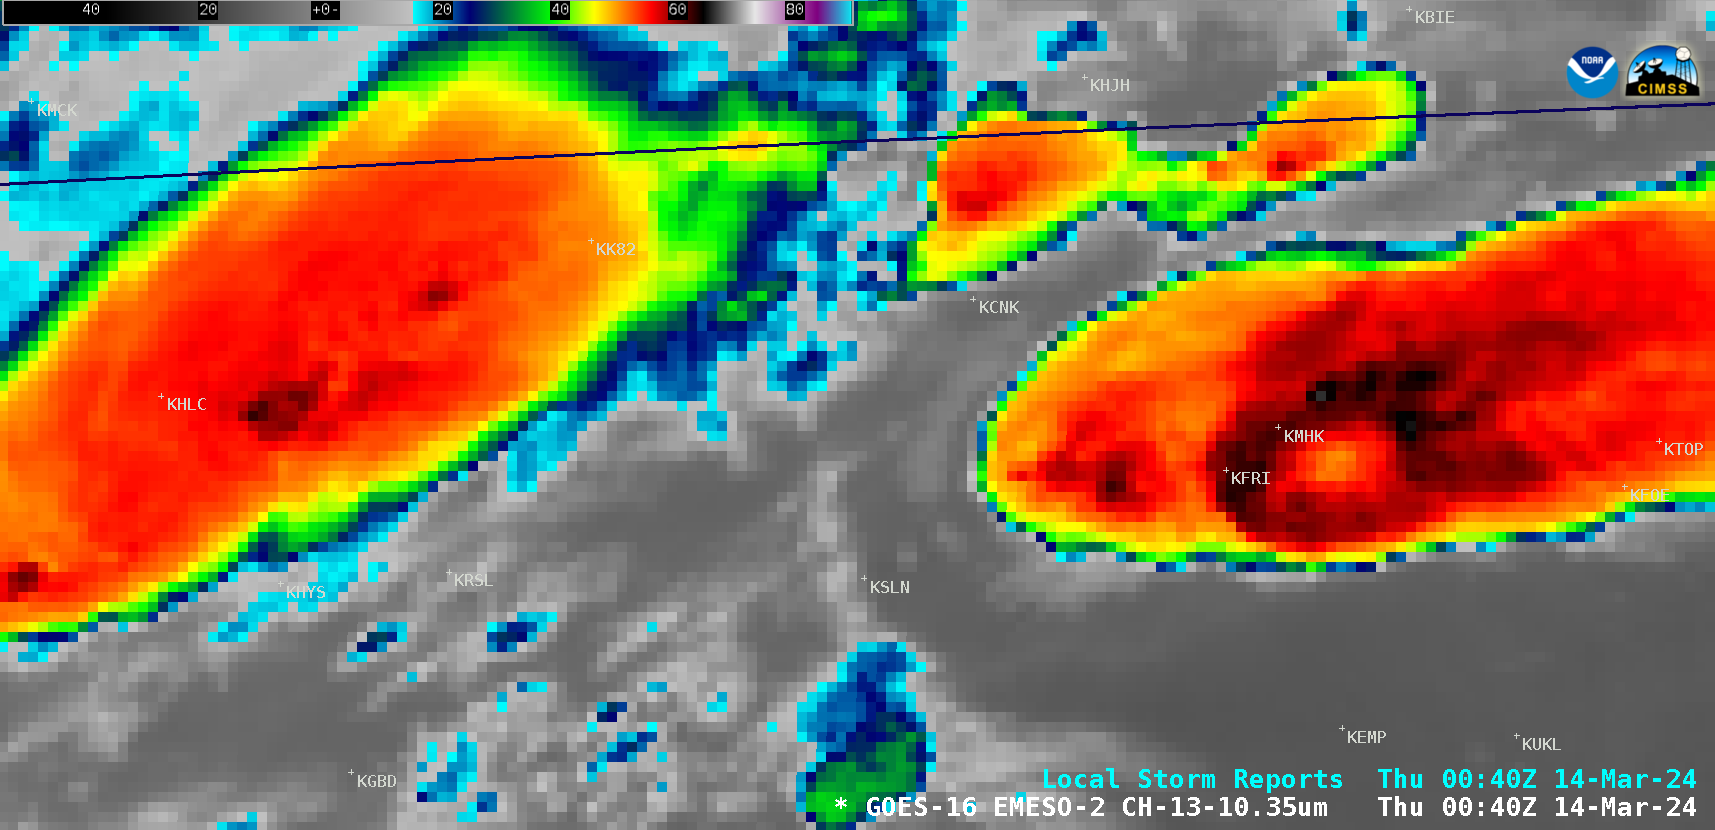
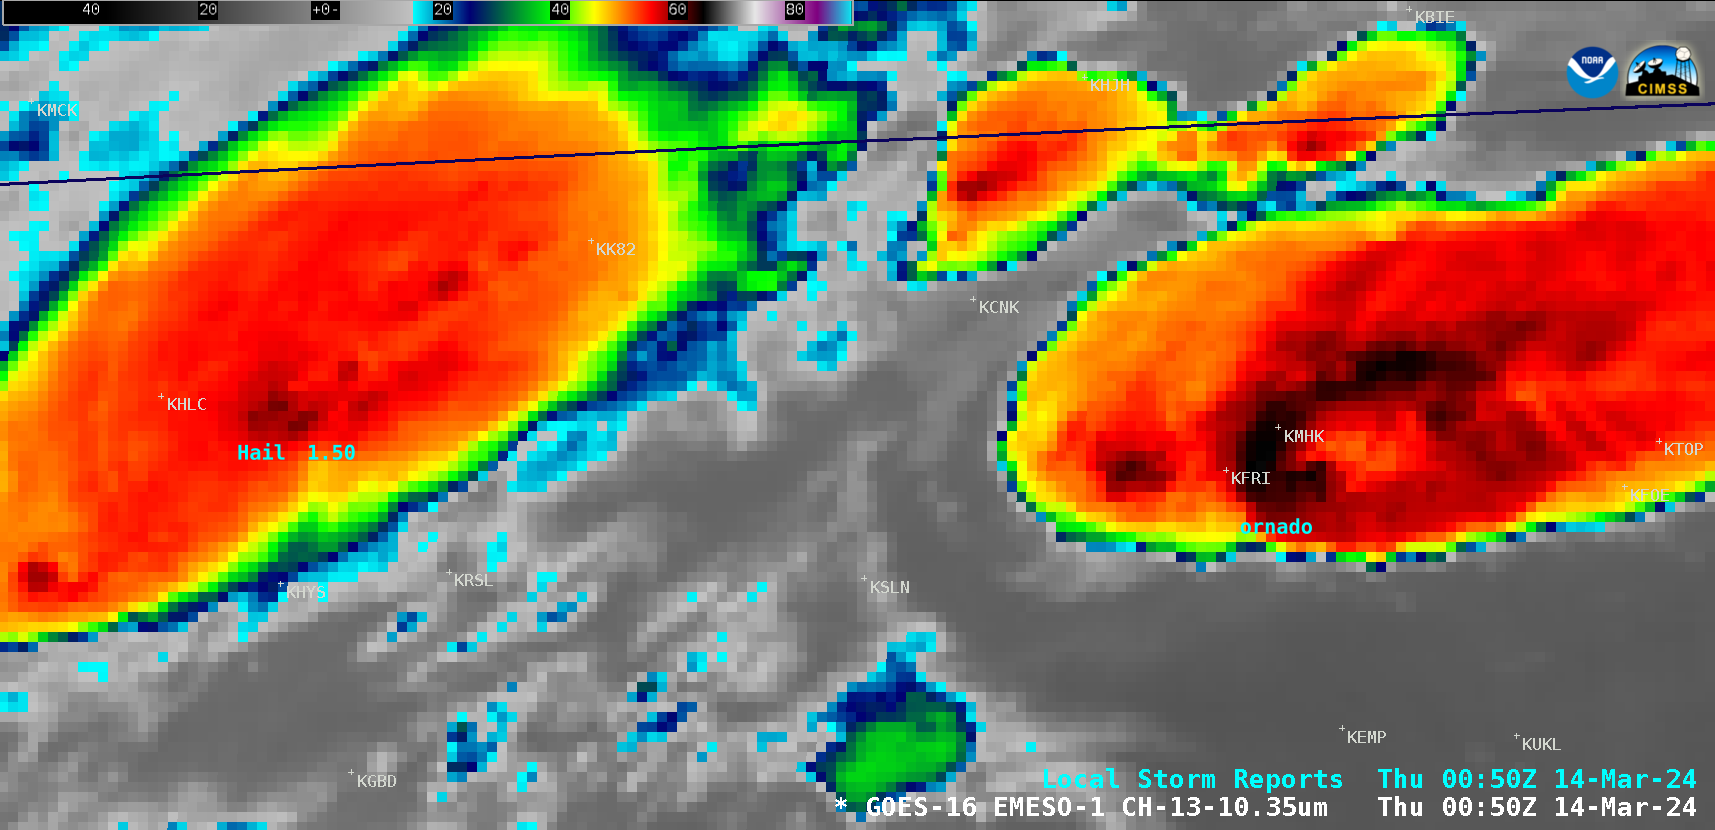
Overlapping 1-minute GOES-16 Mesoscale Domain Sectors provided imagery at 30-second intervals over northcentral/northeast Kansas — Infrared imagery covering the period when the tornado-producing thunderstorms occurred within the WFO Topeka County Warning Area are shown above. The default max/min Infrared enhancement Color Table ranges were changed to 55/-90 C, to better highlight the pulses of overshooting tops. Beginning around 0040 UTC, a distinct “enhanced-V” storm top signature was exhibited by the thunderstorm that produced the first tornado, south-southeast of Ft. Riley Kansas (KFRI) at 0050 UTC.
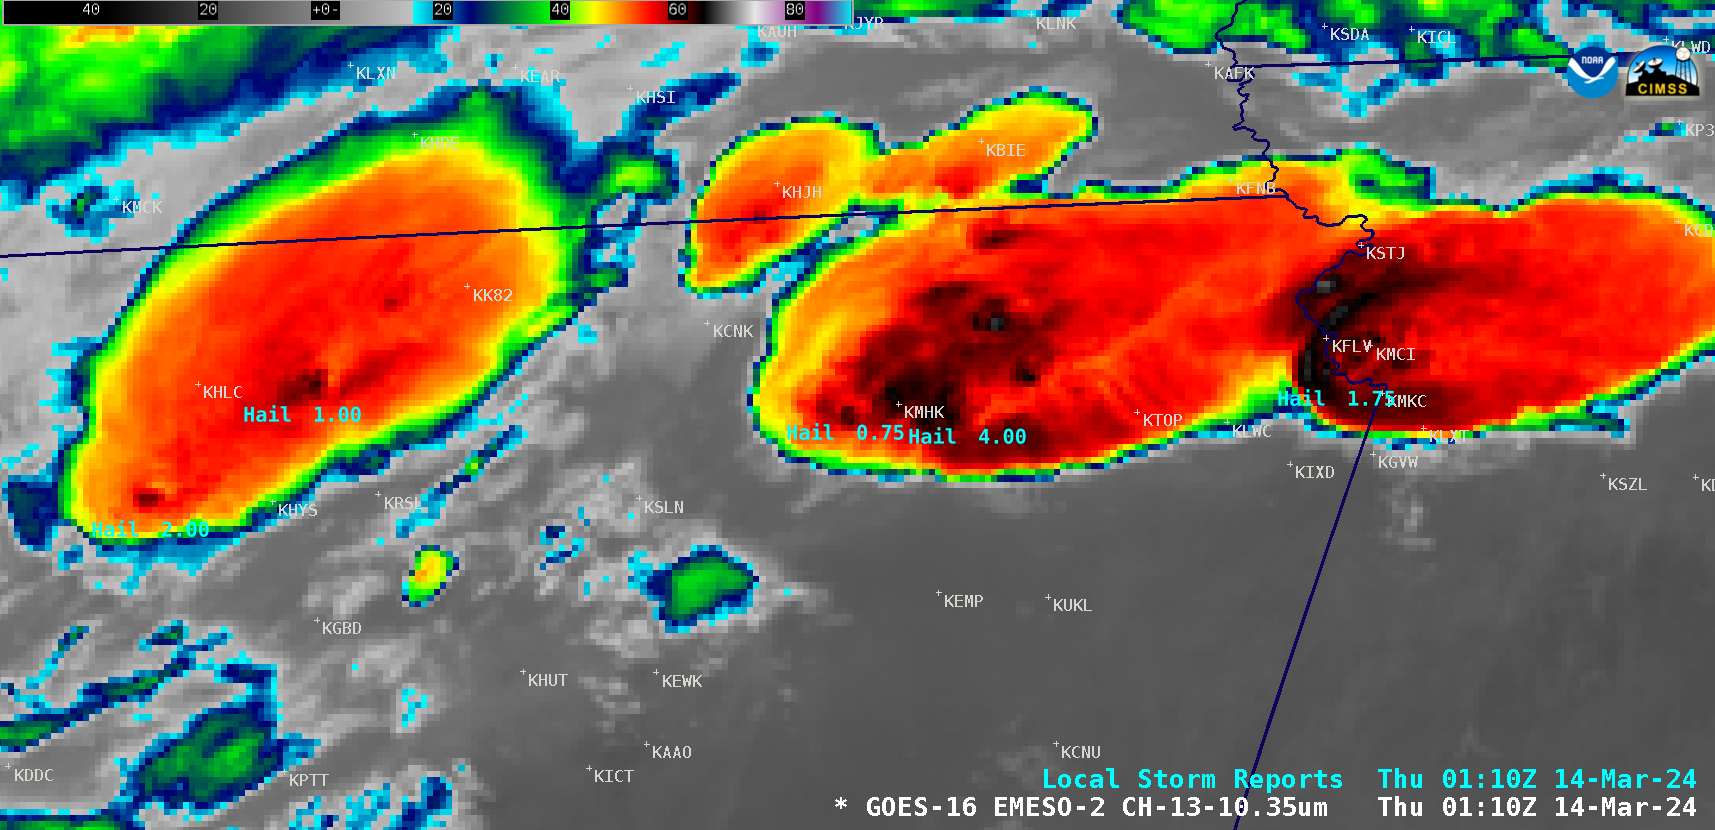
A larger-scale view using 1-minute GOES-16 Infrared images is shown below. Note the report of 4.00-inch diameter hail at 0110 UTC, just southeast of Manhattan, Kansas (KMHK).
1-minute GOES-16 “Clean” Infrared Window (10.3 µm) images with Local Storm Reports plotted in cyan, from 2259 UTC on 13 March to 0700 UTC on 14 March (courtesy Scott Bachmeier, CIMSS) [click to play animated GIF | MP4]
What satellite products might have been used before this outbreak to better understand or anticipate it? The toggle below shows lapse rates (700-500mb and 850-700 mb) derived from gridded NOAA-20 NUCAPS profiles (source). Steep lapse rates exist over Kansas from 700-500 mb; convection that develops there will not be impeded by stability.
Gridded NOAA-20 NUCAPS estimates of Lapse Rates (850-700, 700-500 mb) over the central US, ca. 1850 UTC on 13 March 2024 (Click to enlarge)
Polar Hyperspectral Soundings can be fused with ABI data to blend the high spectral resolution Polar Data with the high spatial and temporal resolution of geostationary data. That thermodynamic information can then be assimilated into a high-resolution mesoscale model to give short-term forecasts that include better moisture information. Model output is here (this model is one of the products to be demonstrated at the Hazardous Weather Testbed at the Storm Prediction Center in late May and early June). What did model output suggest. The animations below shows Significant Tornado Parameter at 0100 and 0200 UTC on 14 March (from two consecutive model runs initialized at 2000 UTC and 2200 UTC on 13 March 2024, respectively). Both model runs suggest greater tornado probabilities within the TOP CWA, as was observed.
5- and 6-h forecasts of Significant Tornado Parameter (STP) valid 0100 and 0200 UTC 14 March, from a model run initialized at 2000 UTC 14 March 2024 (Click to enlarge)3- and 4-h forecasts of Significant Tornado Parameter (STP) valid 0100 and 0200 UTC 14 March, from a model run initialized at 2200 UTC 14 March 2024 (Click to enlarge)
Animations of MUCAPE, below, valid at 0000, 0100 and 0200 UTC on 14 March, show the northward motion to the most unstable air through the Topeka CWA
Forecast MUCAPE fields at 0000, 0100 and 0200 UTC on 14 March 2024, from a model run initialized at 2000 UTC (top, showing 4-, 5-, and 6-h forecasts) and a model run initialized at 2200 UTC (bottom, showing 2-, 3- and 4-h forecasts)


