This website works best with a newer web browser such as Chrome, Firefox, Safari or Microsoft
Edge. Internet Explorer is not supported by this website.
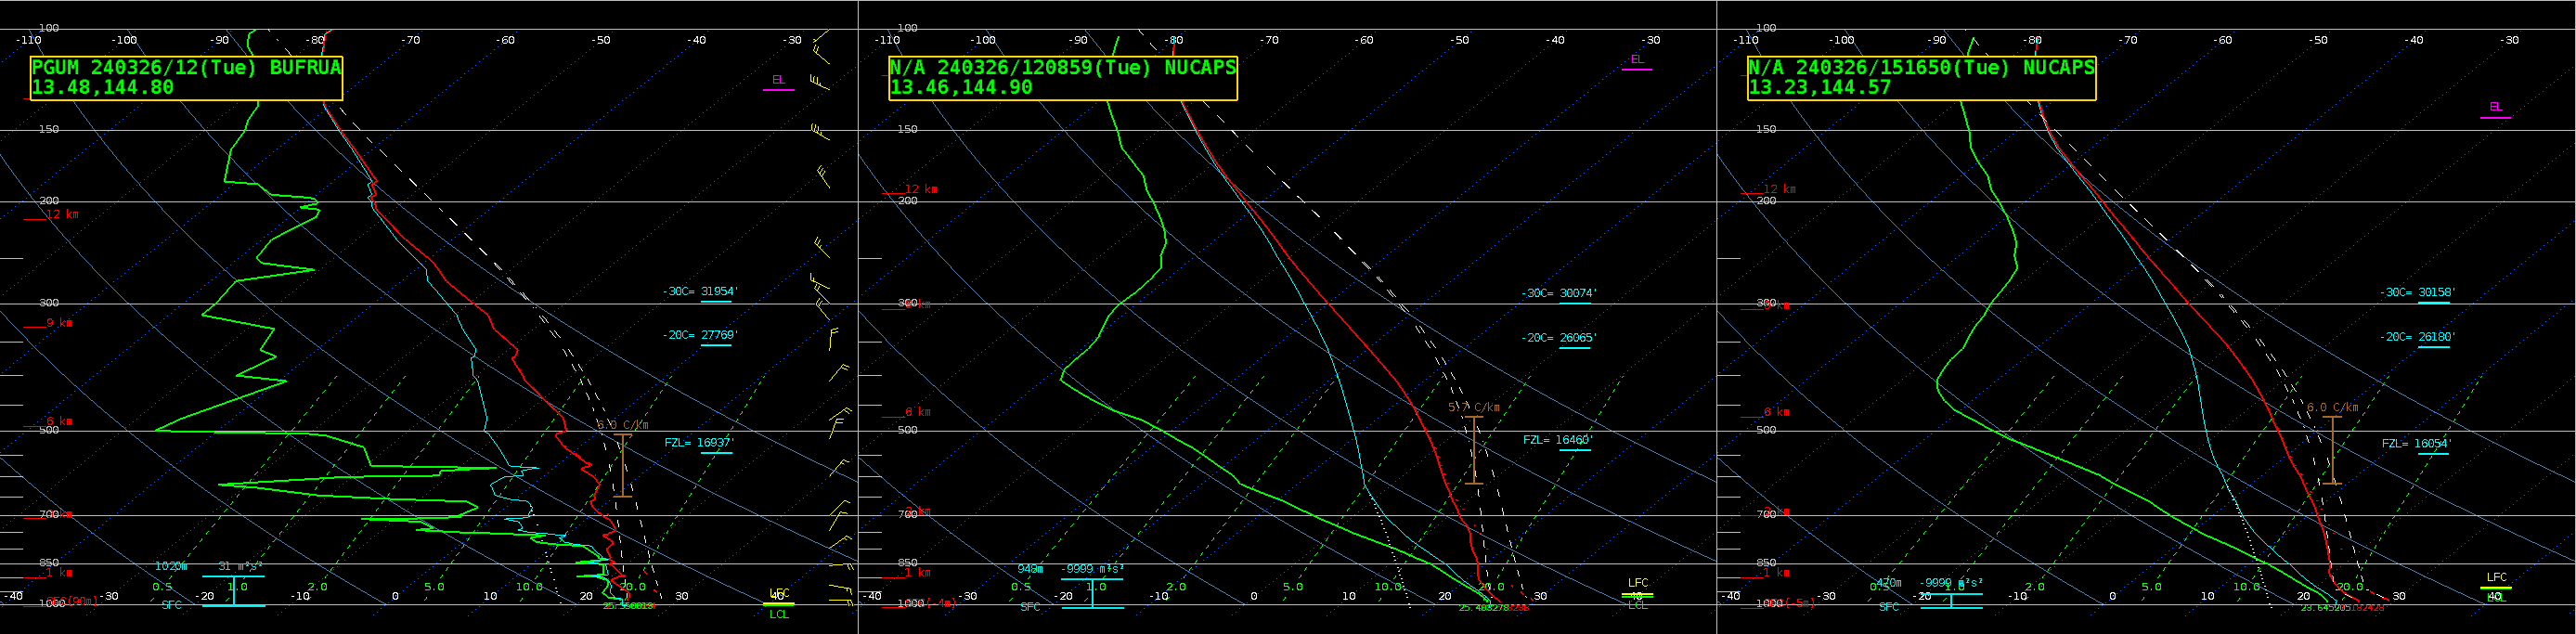
The addition of a 2nd satellite (MetopC) producing NUCAPS profiles means that places such as Guam have twice as much Satellite information over the otherwise data-sparse western Pacific Ocean. The three-panel above shows the 1200 UTC sounding at Guam (on the left) with a nearly coincident 1208 UTC NUCAPS profile... Read More
Guam 1200 UTC Sounding (left), NOAA-20 NUCAPS Sounding, 1208 UTC (middle) and MetopC NUCAPS Sounding, 1516 UTC (right) on 26 March 2024 (Click to enlarge)
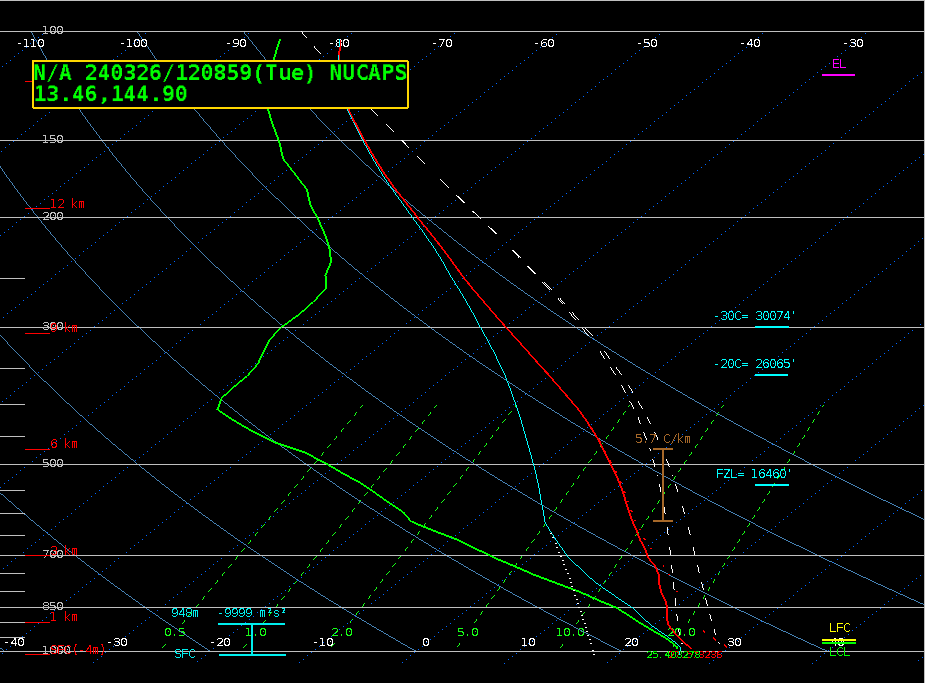
The addition of a 2nd satellite (MetopC) producing NUCAPS profiles means that places such as Guam have twice as much Satellite information over the otherwise data-sparse western Pacific Ocean. The three-panel above shows the 1200 UTC sounding at Guam (on the left) with a nearly coincident 1208 UTC NUCAPS profile from NOAA-20 data in the middle, and a 1516 UTC MetopC NUCAPS profile on the right. It’s a lot easier to use these satellite soundings to infer how things are changing because of the increased number of soundings available. The toggle below compares the two NUCAPS profiles.
NOAA-20 NUCAPS (1208 UTC) and MetopC NUCAPS (1516 UTC) on 26 March 2024 (Click to enlarge)
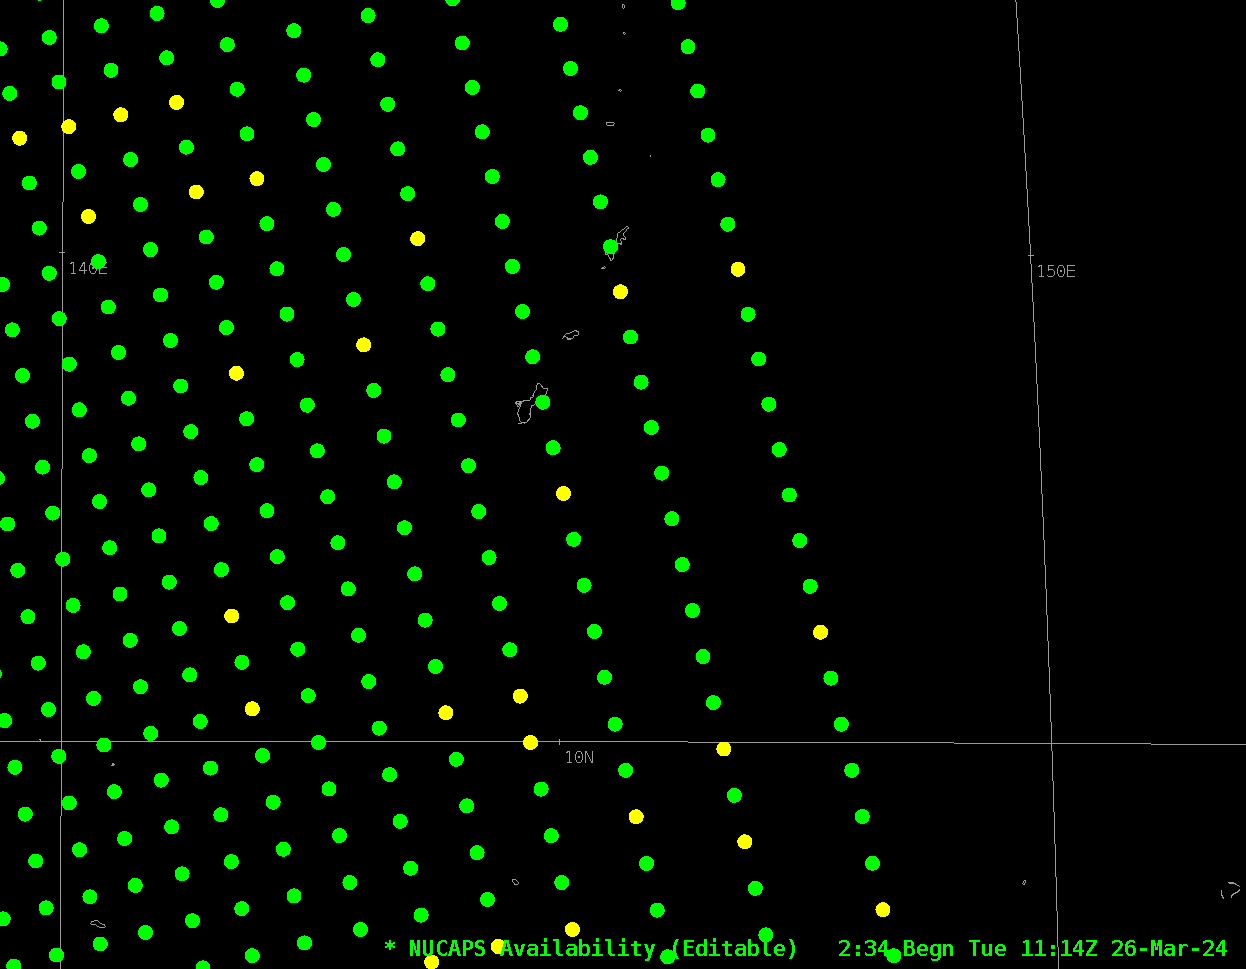
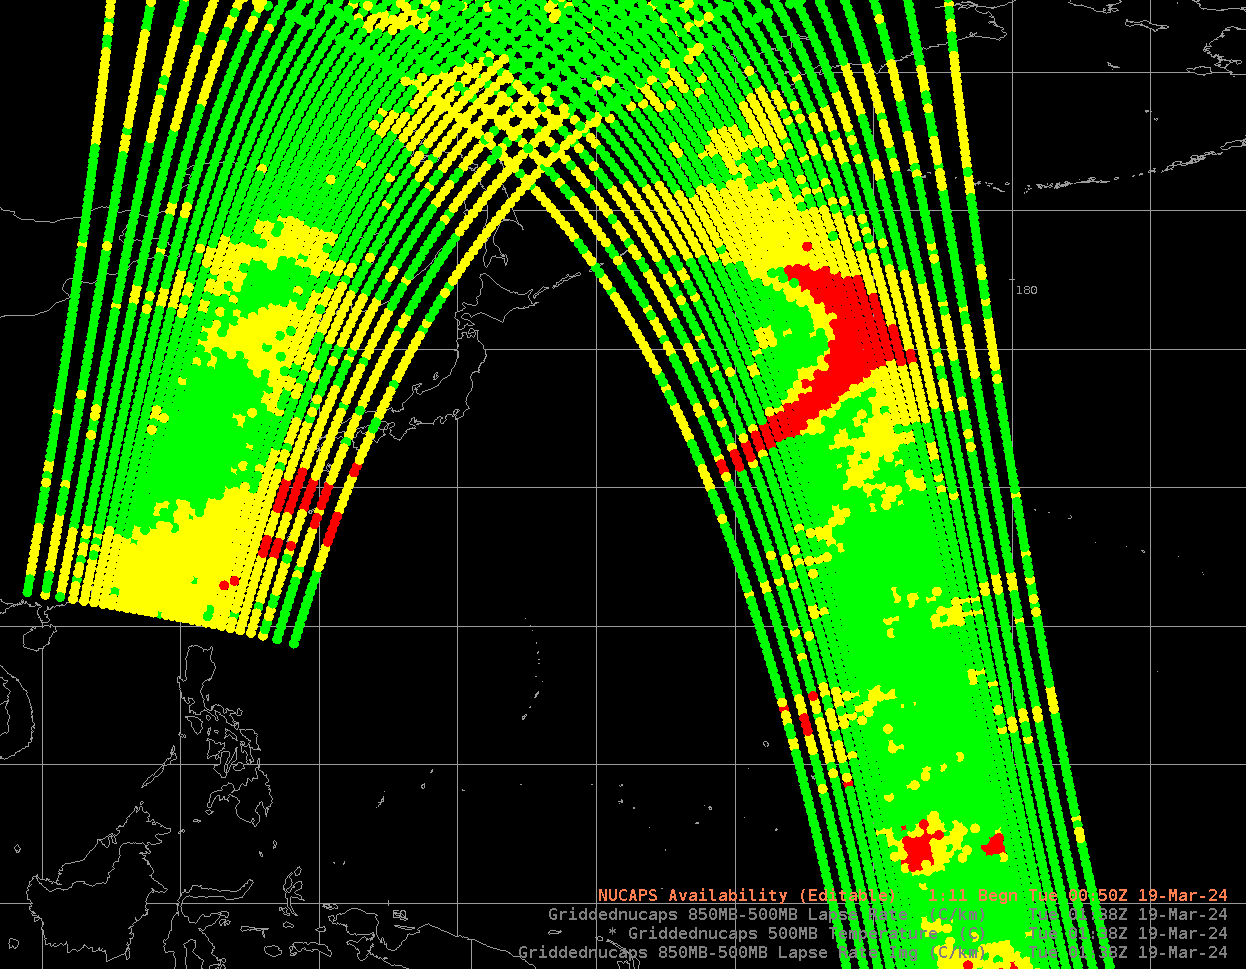
The Sounding Availability Plot from AWIPS, below, shows the distribution of points from the NOAA-20 and MetopC overpasses centered on the island of Guam. The points chosen above were the closest ones to the island of Guam.
NUCAPS Sounding Availability at 1114 (NOAA-20) and 1414 UTC (MetopC) on 26 March 2024 (Click to enlarge)
Gridded NUCAPS fields are also created in AWIPS from these vertical profiles. Those fields allow a user to easily pick out gradients and thresholds.
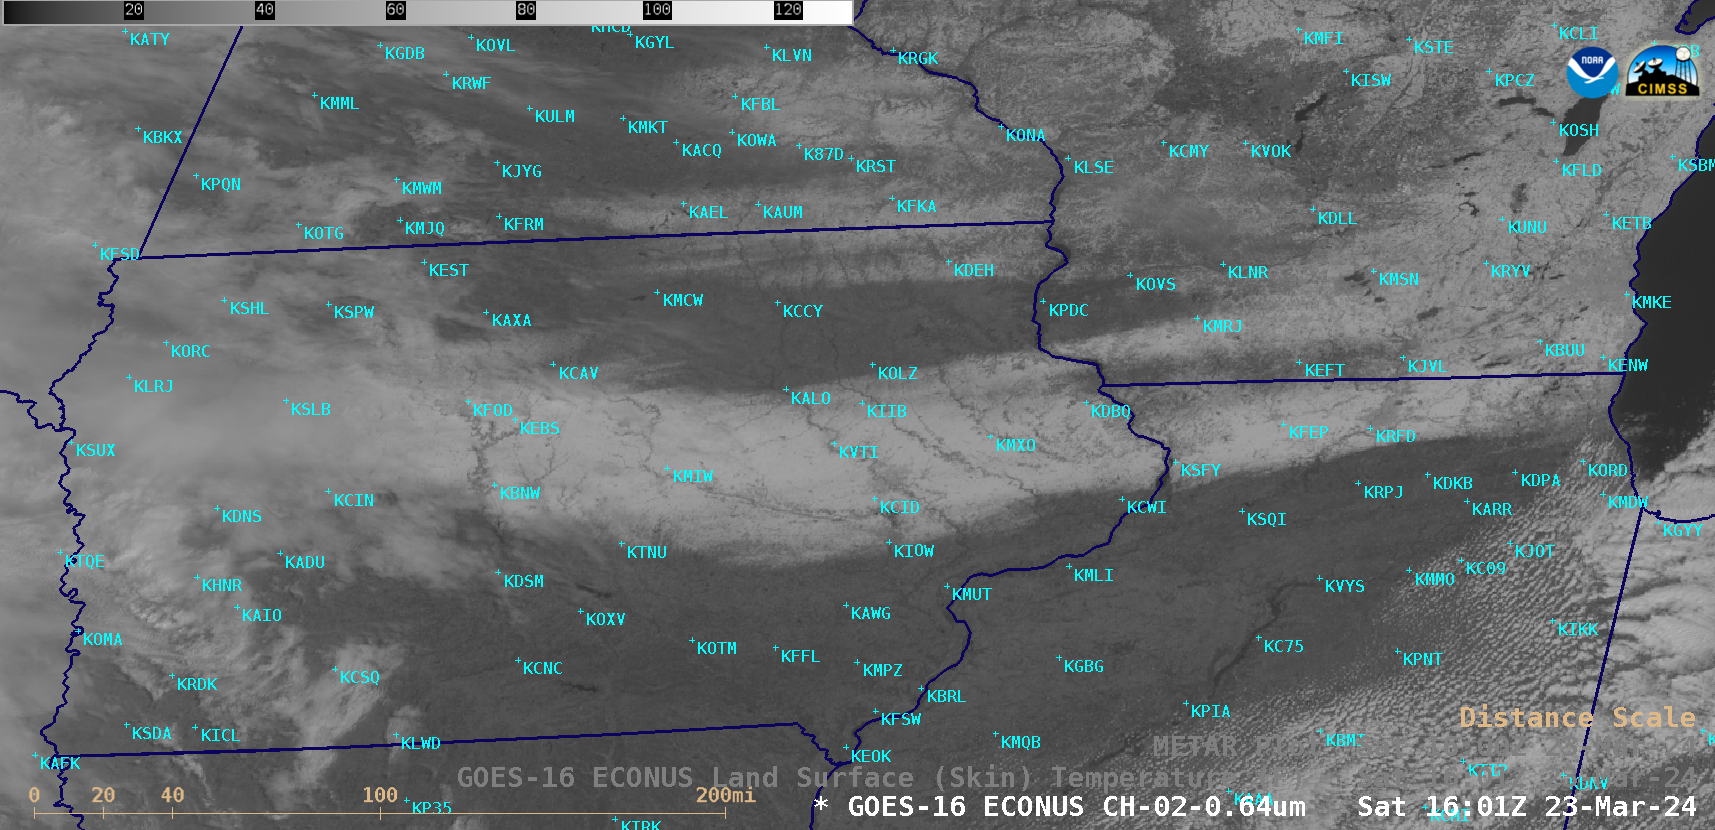
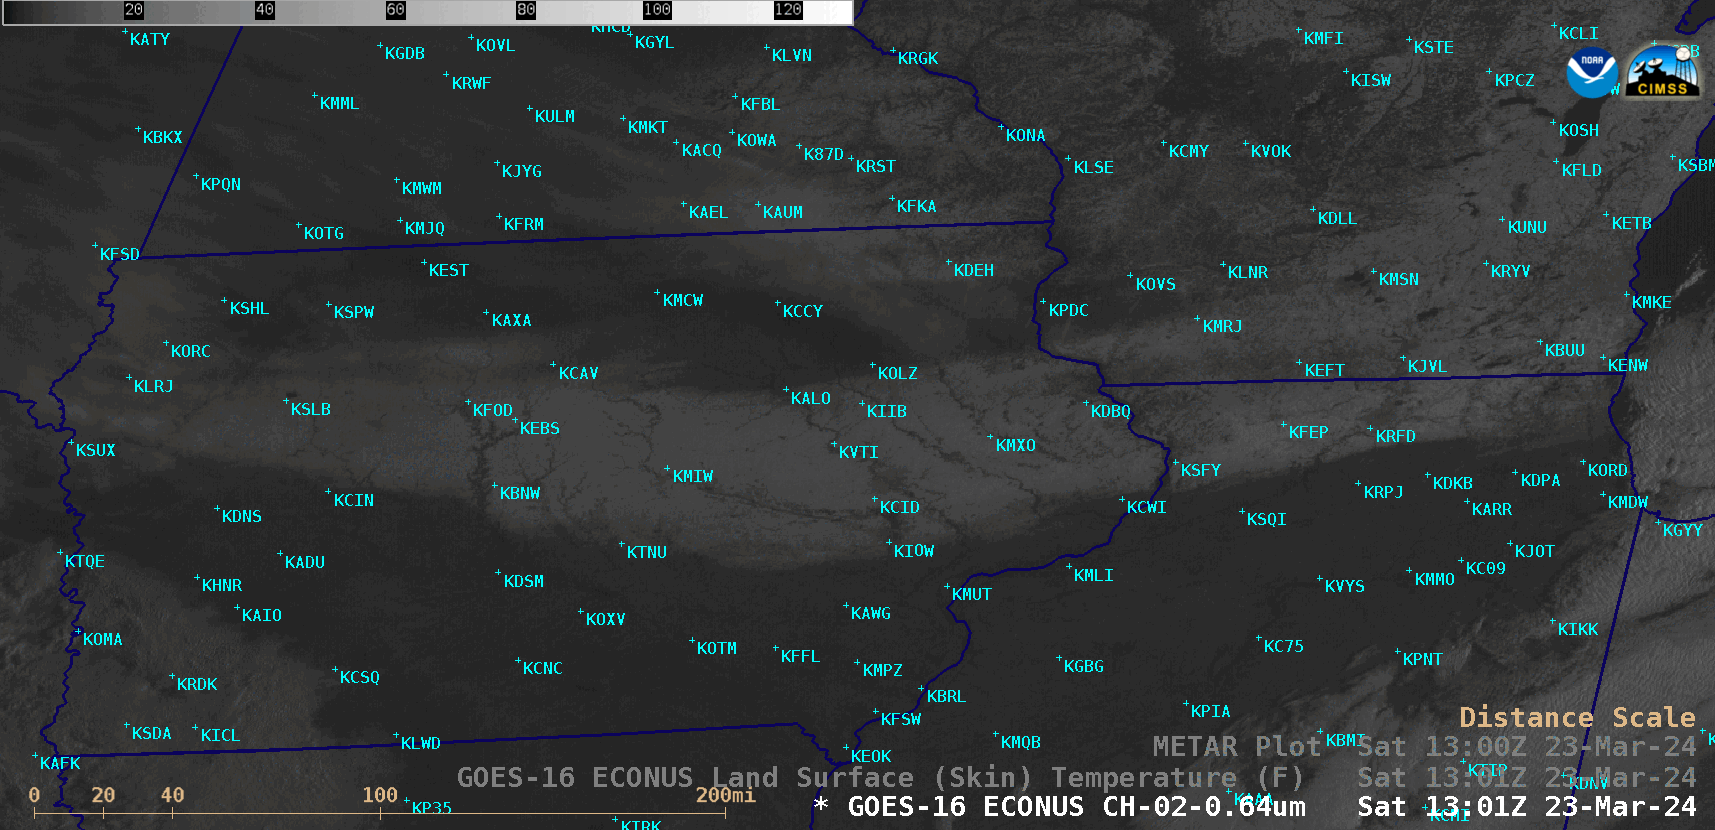
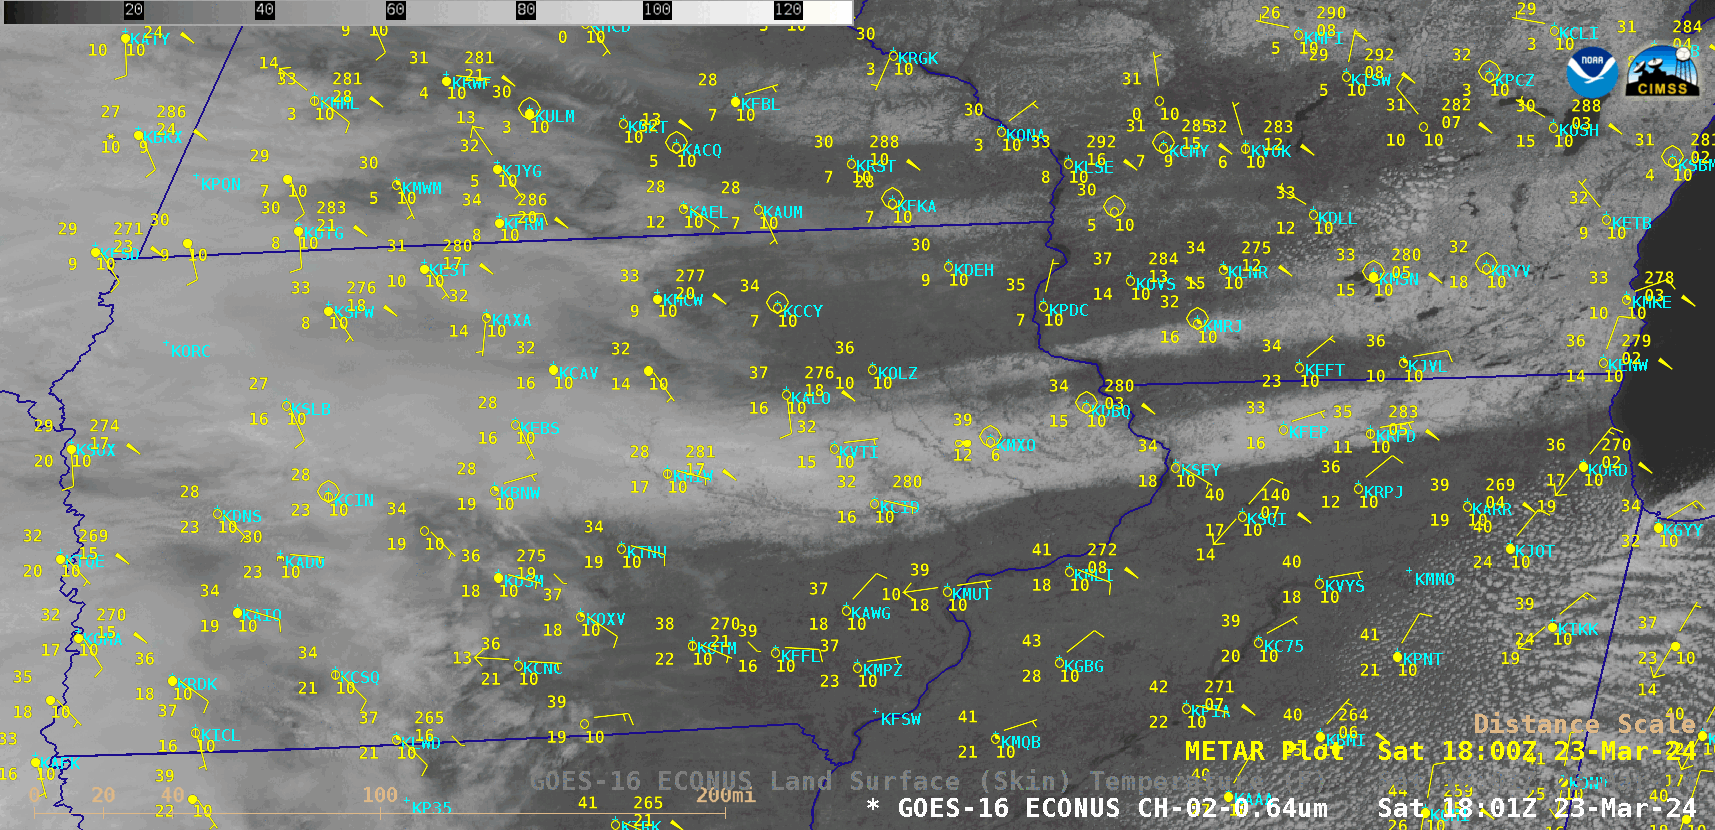
GOES-16 (GOES-East) “Red” Visible (0.64 µm) images (above) showed 2 swaths of fresh snow cover across central/eastern Iowa, far northern Illinois and far southern Wisconsin on 23 March 2024 — which were produced by consecutive systems on 21 March and 22 March (below). Total snowfall accumulations contributing to the 22 March southern snow... Read More
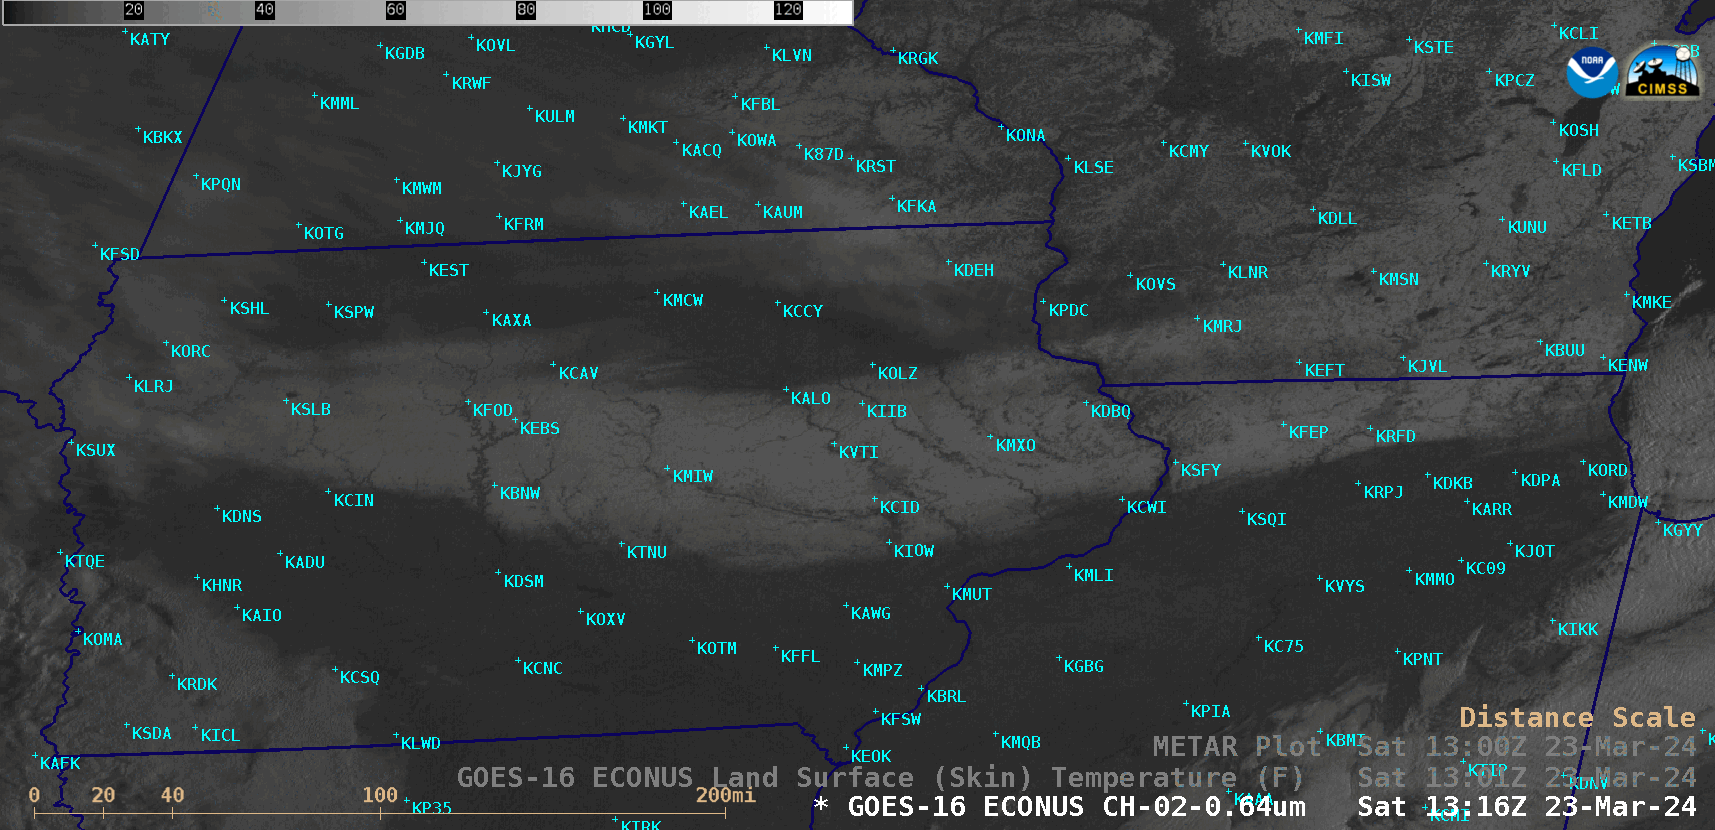
GOES-16 “Red” Visible (0.64 µm) images, with/without hourly plots of surface observations, from 1301-2001 UTC on 23 March [click to play animated GIF | MP4]
GOES-16 (GOES-East) “Red” Visible (0.64 µm) images (above) showed 2 swaths of fresh snow cover across central/eastern Iowa, far northern Illinois and far southern Wisconsin on 23 March 2024 — which were produced by consecutive systems on 21 March and 22 March (below). Total snowfall accumulations contributing to the 22 March southern snow swath included 8.0″ in eastern Iowa and 9.3″ in northern Illinois (NWS Quad Cities | NWS Chicago).
As daytime air temperatures warmed as a result of abundant incoming solar radiation, the zone of lesser snow depth (along the Wisconsin/Illinois border) between the 2 primary swaths of deeper snow cover revealed their northern and southern boundaries. The sharp southern boundary of the Illinois snow cover was particularly notable.
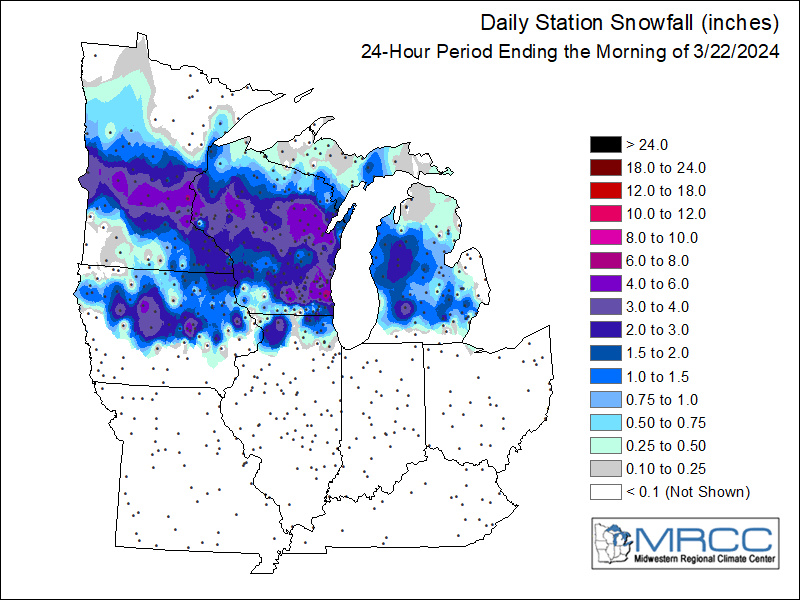
Maps of 24-hour snowfall ending at 1200 UTC on 22 March and 23 March (source)
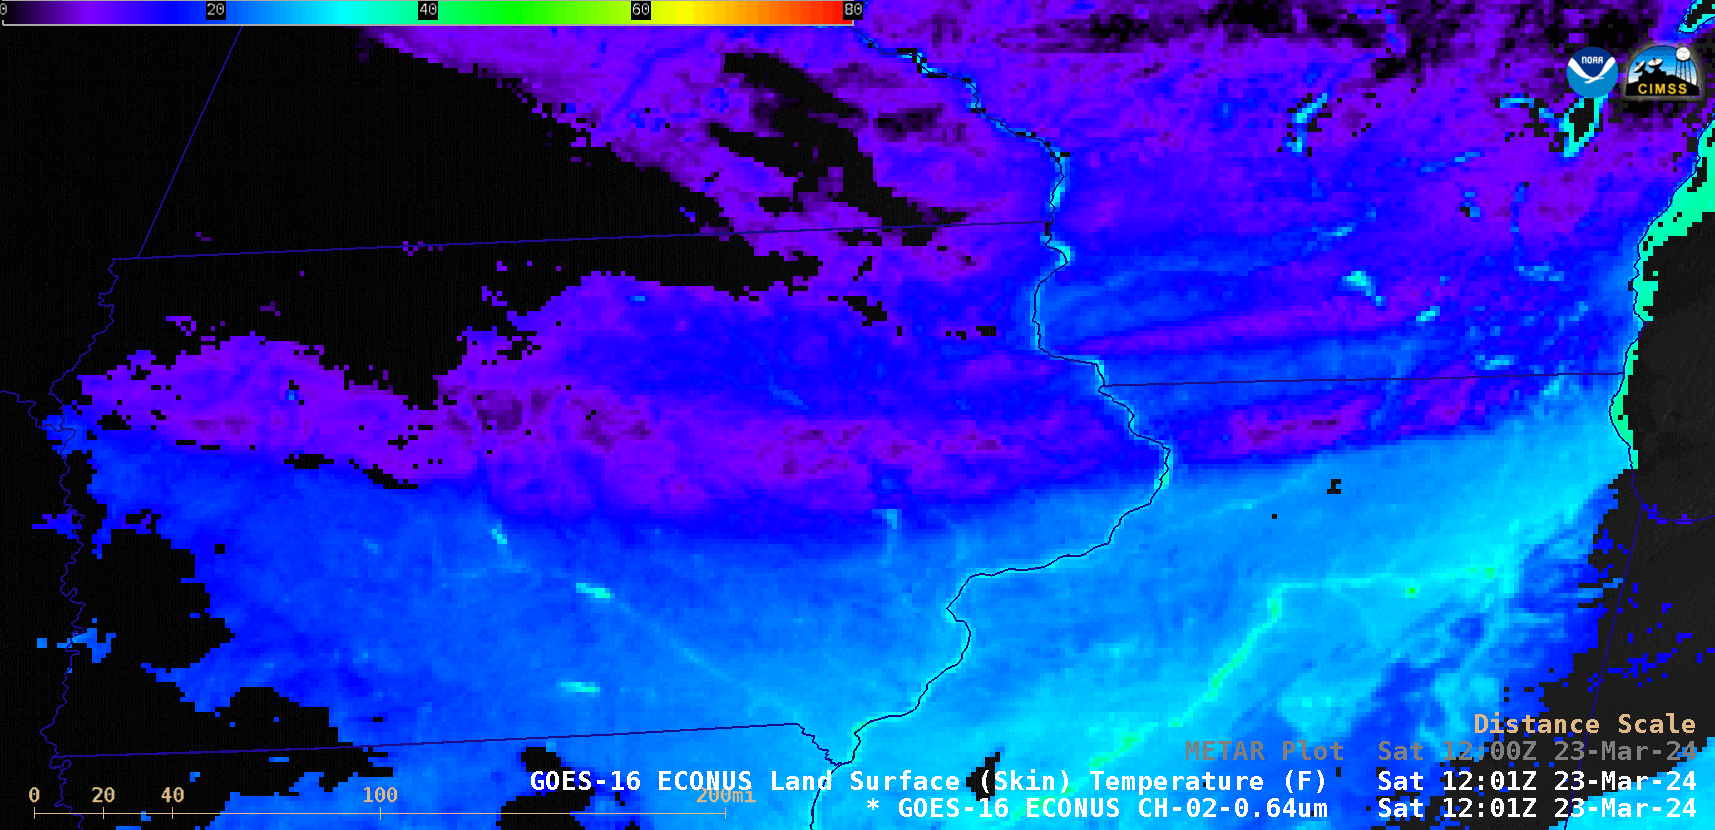
GOES-16 Land Surface Temperature derived product at 1201 UTC, with/without plots of METAR sites [click to enlarge]
The GOES-16 Land Surface Temperature (LST) derived product at 1201 UTC (above) revealed several pockets of LST values as cold as +5ºF (darker shades of purple) within the swath of snow cover across Iowa and northern Illinois. The coldest minimum shelter air temperature reported that morning was +9ºF at Webster City, Iowa (KEBS), which was located within one of the darker purple pockets of coldest LST.
A toggle between the GOES-16 Land Surface Temperature derived product at 1201 UTC and a Visible image at 1331 UTC (below) demonstrated how the LST product could be useful for identifying areas where snow depth was likely the greatest (especially in areas having sparse observations) — with deeper snow cover exhibiting a colder LST value.
GOES-16 Land Surface Temperature derived product at 1201 UTC and “Red” Visible image at 1331 UTC [click to enlarge]
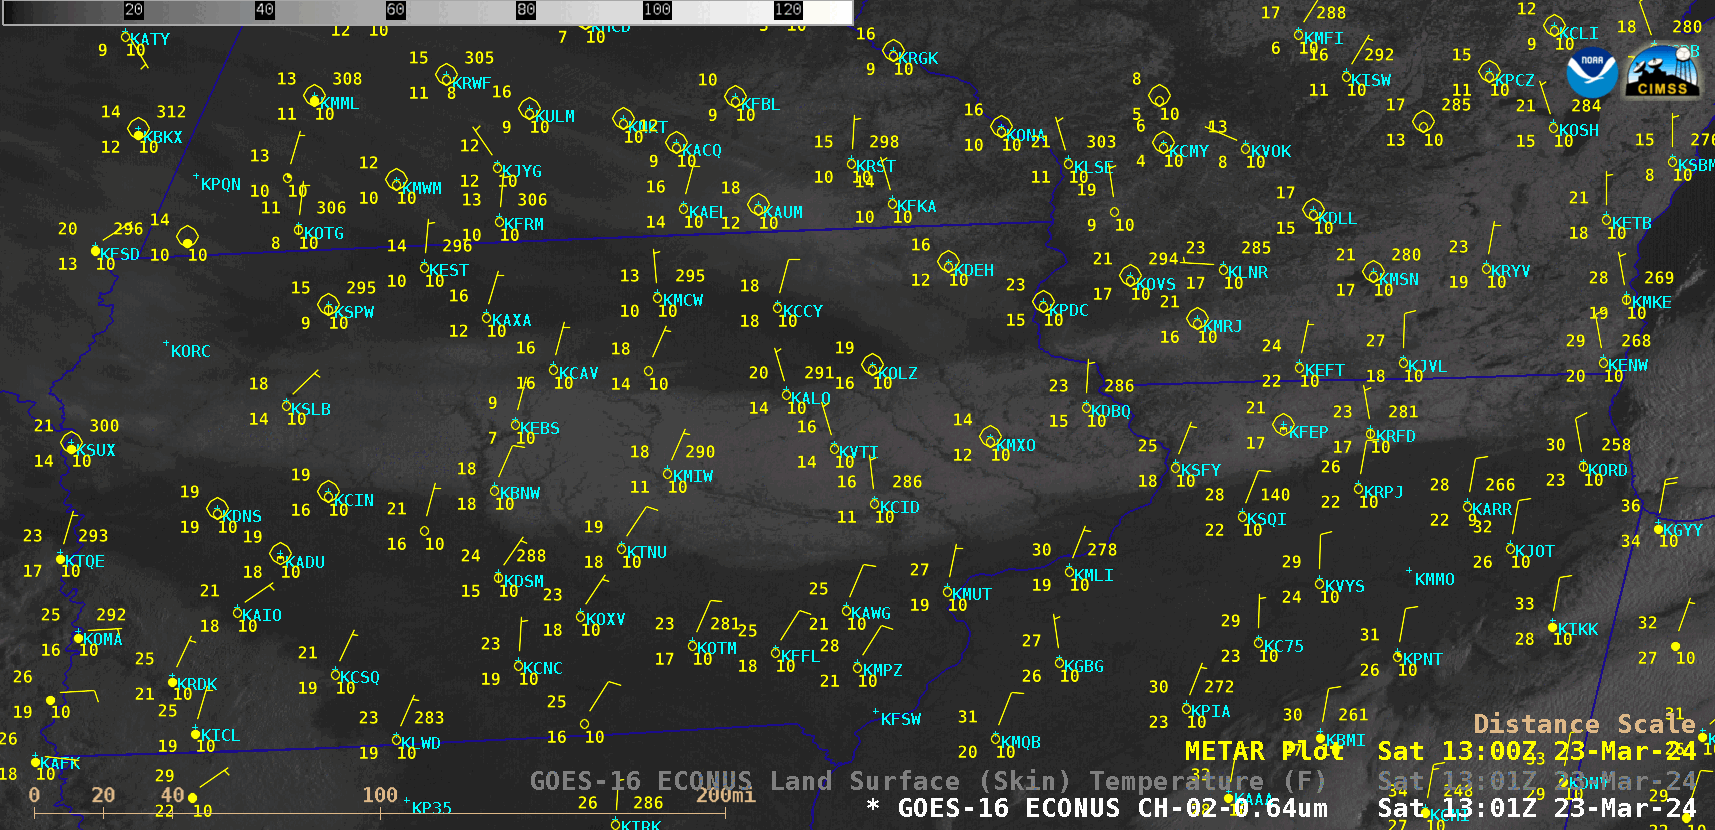
GOES-16 Visible image and Land Surface Temperature derived product at 1301 UTC [click to enlarge]
A comparison of GOES-16 Visible and Land Surface Temperature at 1301 UTC (above) showed that shortly after sunrise the METAR air temperatures were generally several degrees F colder over the deeper snow cover (and colder LSTs), as would be expected — but air temperatures were several degrees warmer than LST values. 5 hours later at 1801 UTC (below) the air temperatures lagged the rate of warming seen in LST (often by about 20-25ºF), especially to the south of snow cover over bare ground in Illinois.
GOES-16 Visible image and Land Surface Temperature derived product at 1801 UTC [click to enlarge]
_______________________________________
It bears mentioning that some lightning activity was seen during the 22 March snowfall event, with two sites — Cedar Rapids, Iowa (KCID) and Savanna, Illinois (KSFY) — briefly reporting thundersnow. Toggles between GOES-16 Water Vapor (6.9 µm) images + GLMFlash Extent Density on 22 March and Visible images on 23 March (below) indicated that the lightning occurred near the southern edge of the resulting swath of heavy snow across Iowa and Illinois.
GOES-16 Mid-level Water Vapor (6.9 µm) image with an overlay of GLM Flash Extent Density at 1151 UTC on 22 March, along with a “Red” Visible (0.64 µm) image at 1316 UTC on 23 March [click to enlarge]
GOES-16 Mid-level Water Vapor (6.9 µm) image with an overlay of GLM Flash Extent Density at 1316 UTC on 22 March, along with a “Red” Visible (0.64 µm) image at 1316 UTC on 23 March [click to enlarge]
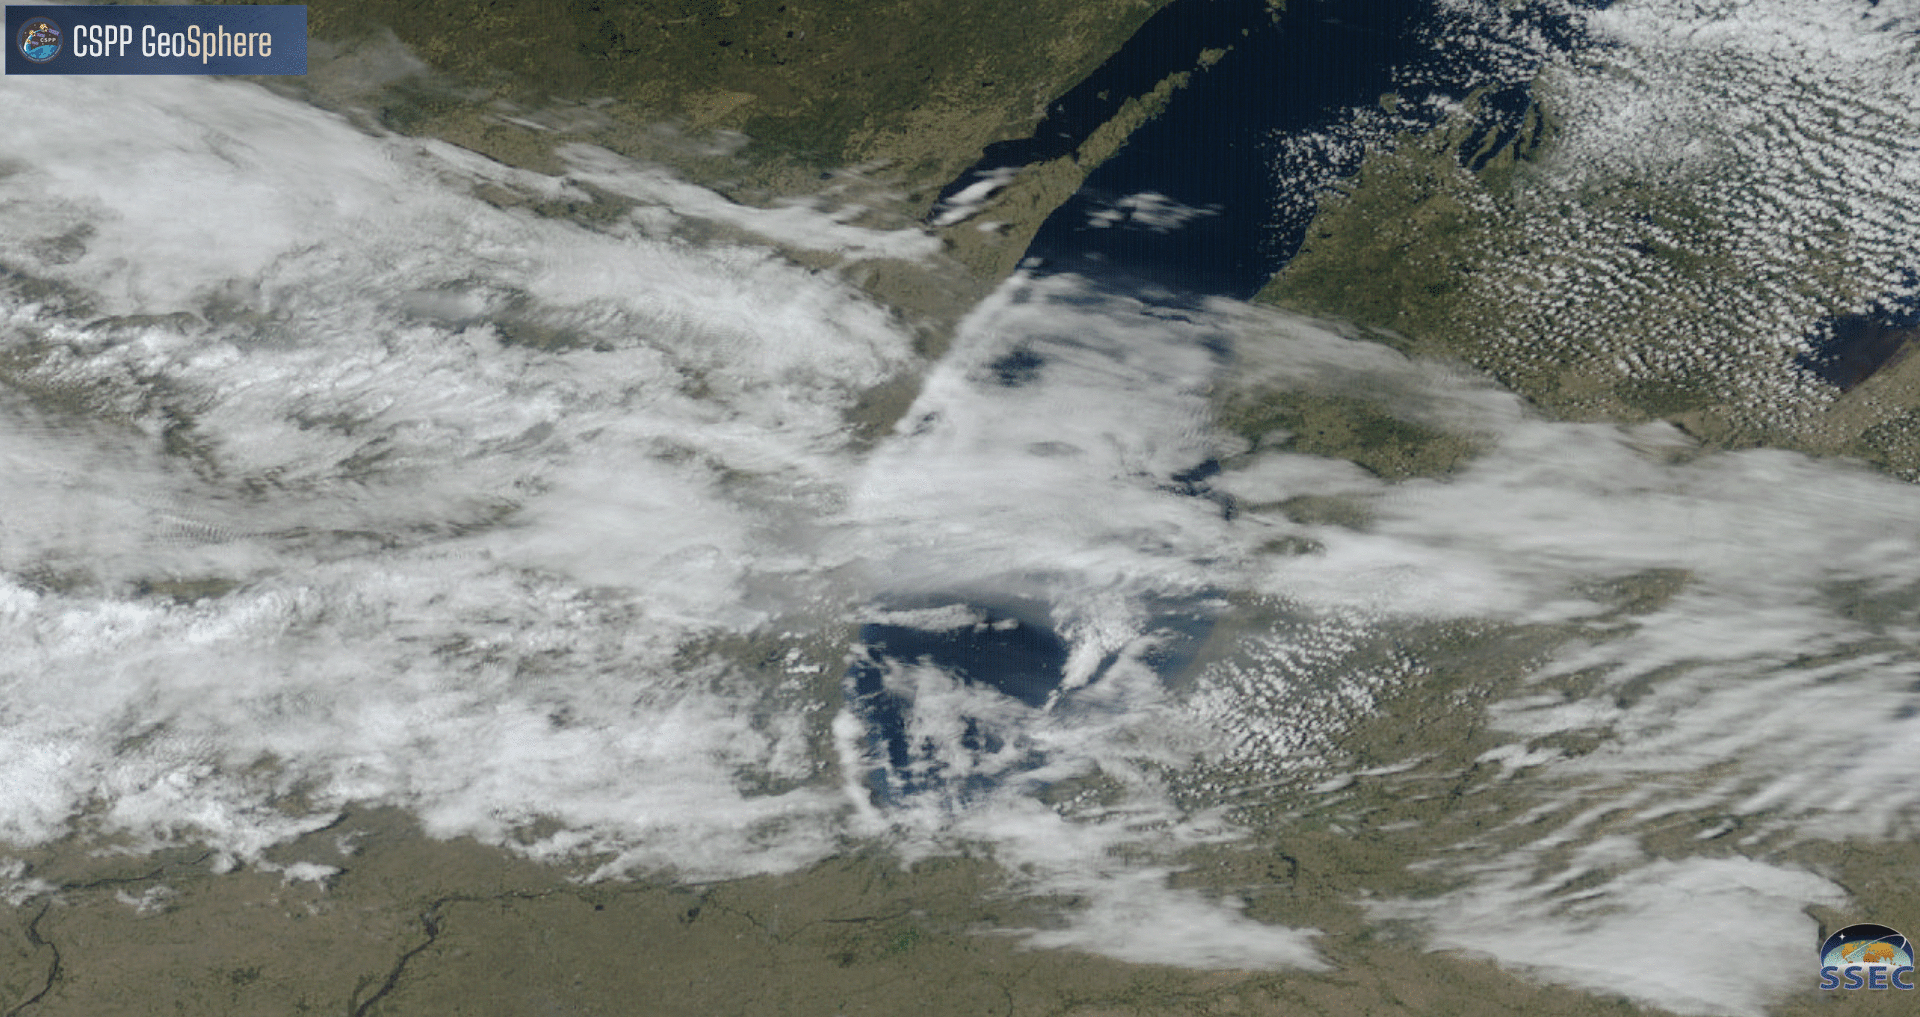
The animation above shows true-color imagery from the CSPP Geosphere site (direct link to animation). Of particular interest is the cloud band that forms along the western shore of Lake Michigan, especially near Chicago, and north of Milwaukee. The toggle below of the True Color imagery and Cloud Top Height suggests the cloud tops are... Read More
GOES-16 True Color imagery from the CSPP Geosphere site, 1531-2031 UTC on 21 March 2024
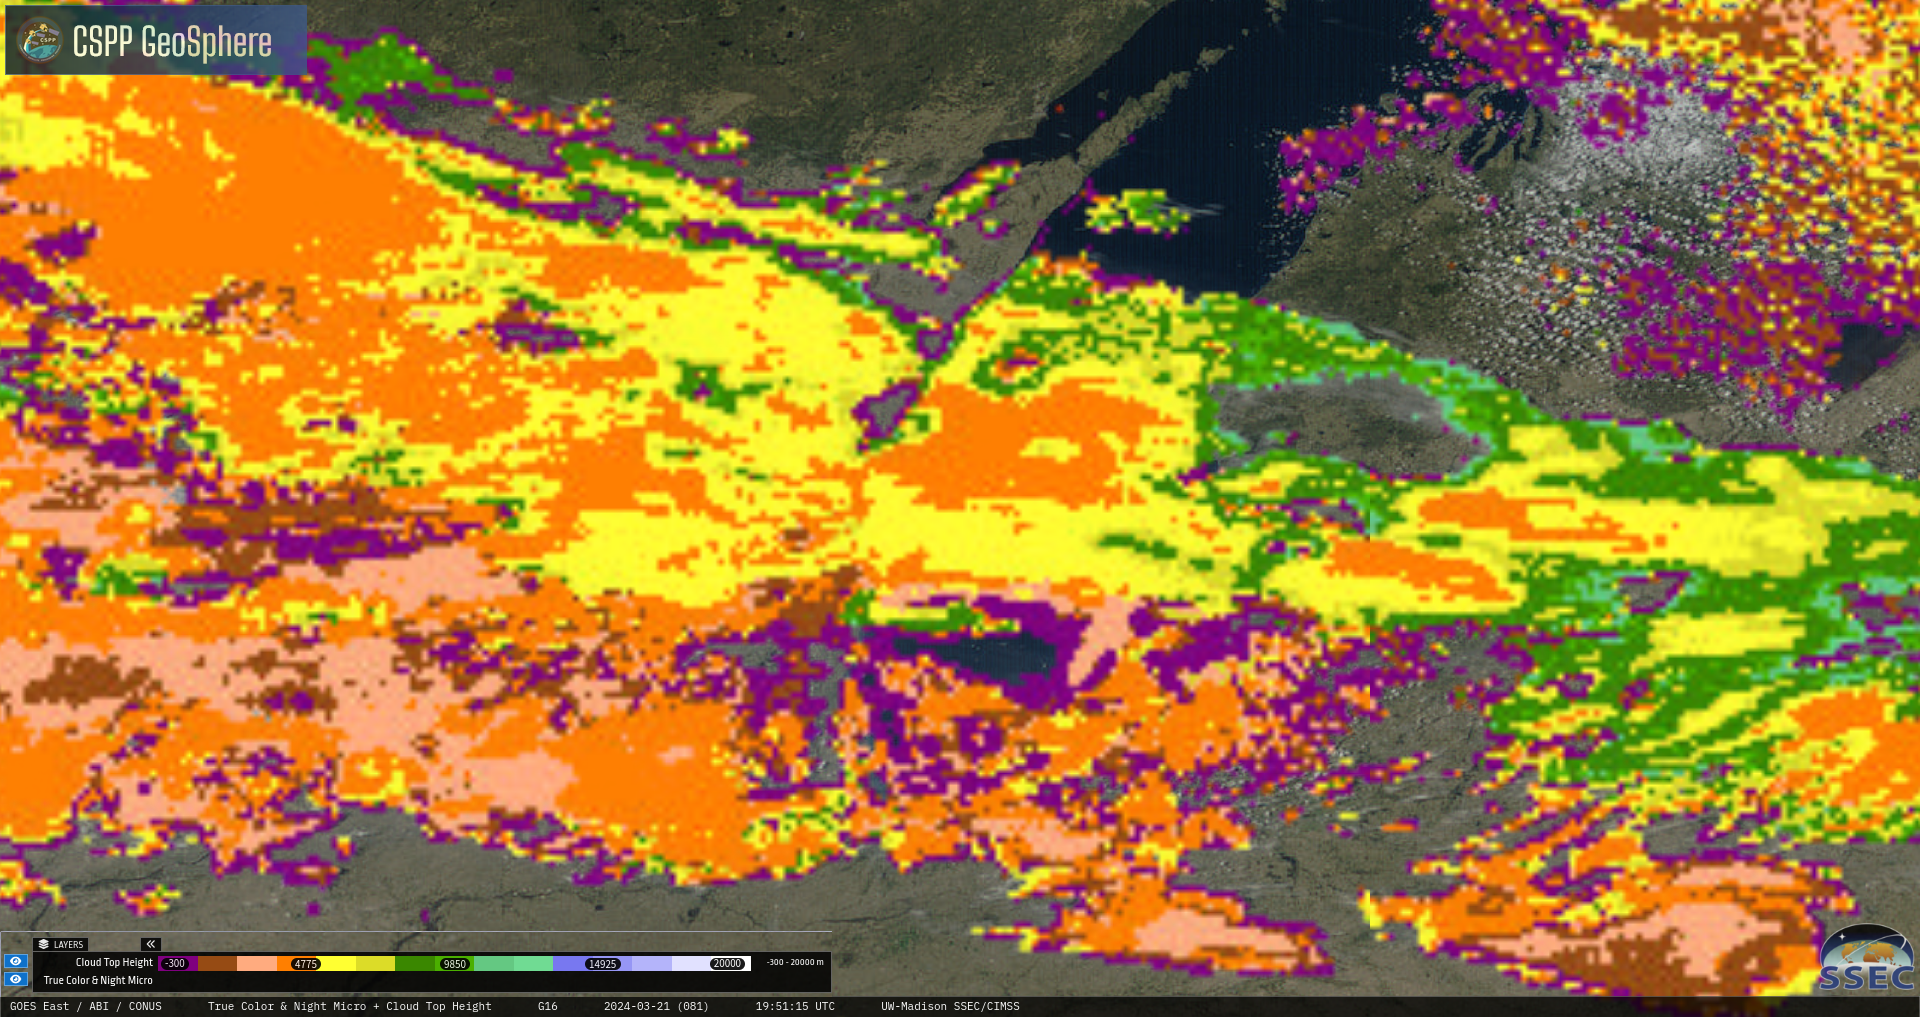
The animation above shows true-color imagery from the CSPP Geosphere site (direct link to animation). Of particular interest is the cloud band that forms along the western shore of Lake Michigan, especially near Chicago, and north of Milwaukee. The toggle below of the True Color imagery and Cloud Top Height suggests the cloud tops are at or above 700 mb (see this 1951 UTC image of Cloud Top Height), perhaps too high to be affected by the Lake Michigan. A curious feature (at least to me) of this animation is that the cloud band does not appear underneath the high clouds over southeast Wisconsin. Does that mean that solar forcing plays some role in this band’s development?
GOES-East True Color imagery and Cloud Top Height, 2115 UTC on 21 March 2024 (Click to enlarge)
This event was brought to our attention by Gino Izzi at WFO LOT (i.e., Chicago) via this email that concludes:
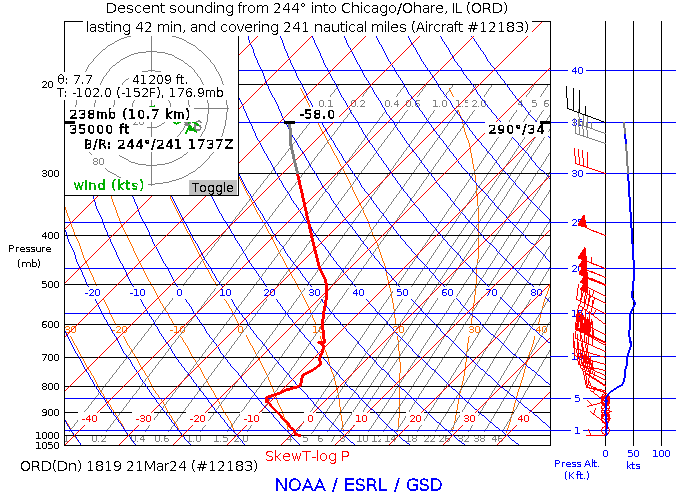
visible imagery starting just before 18z this standing wave looking mid level cloudiness formed on the southwestern shores of Lake Michigan. Eventually some subtle waves form just a hair downstream over the lake and the standing wave seems to propagate upwind just a bit. These wave clouds appear to be around 10kft (~700mb) and looking at ACARS soundings this is at the top of a deep isothermal layer based at around 850mb. The strength of the inversion around 850mb should preclude any lake or marine influence from affecting cloudiness at 10kft. Any idea why these standing waves are there and apparently connected to the western shores of Lake Michigan (even up into central WI) when thermodynamically the lake shouldn\'t be influencing cloudiness that high up.
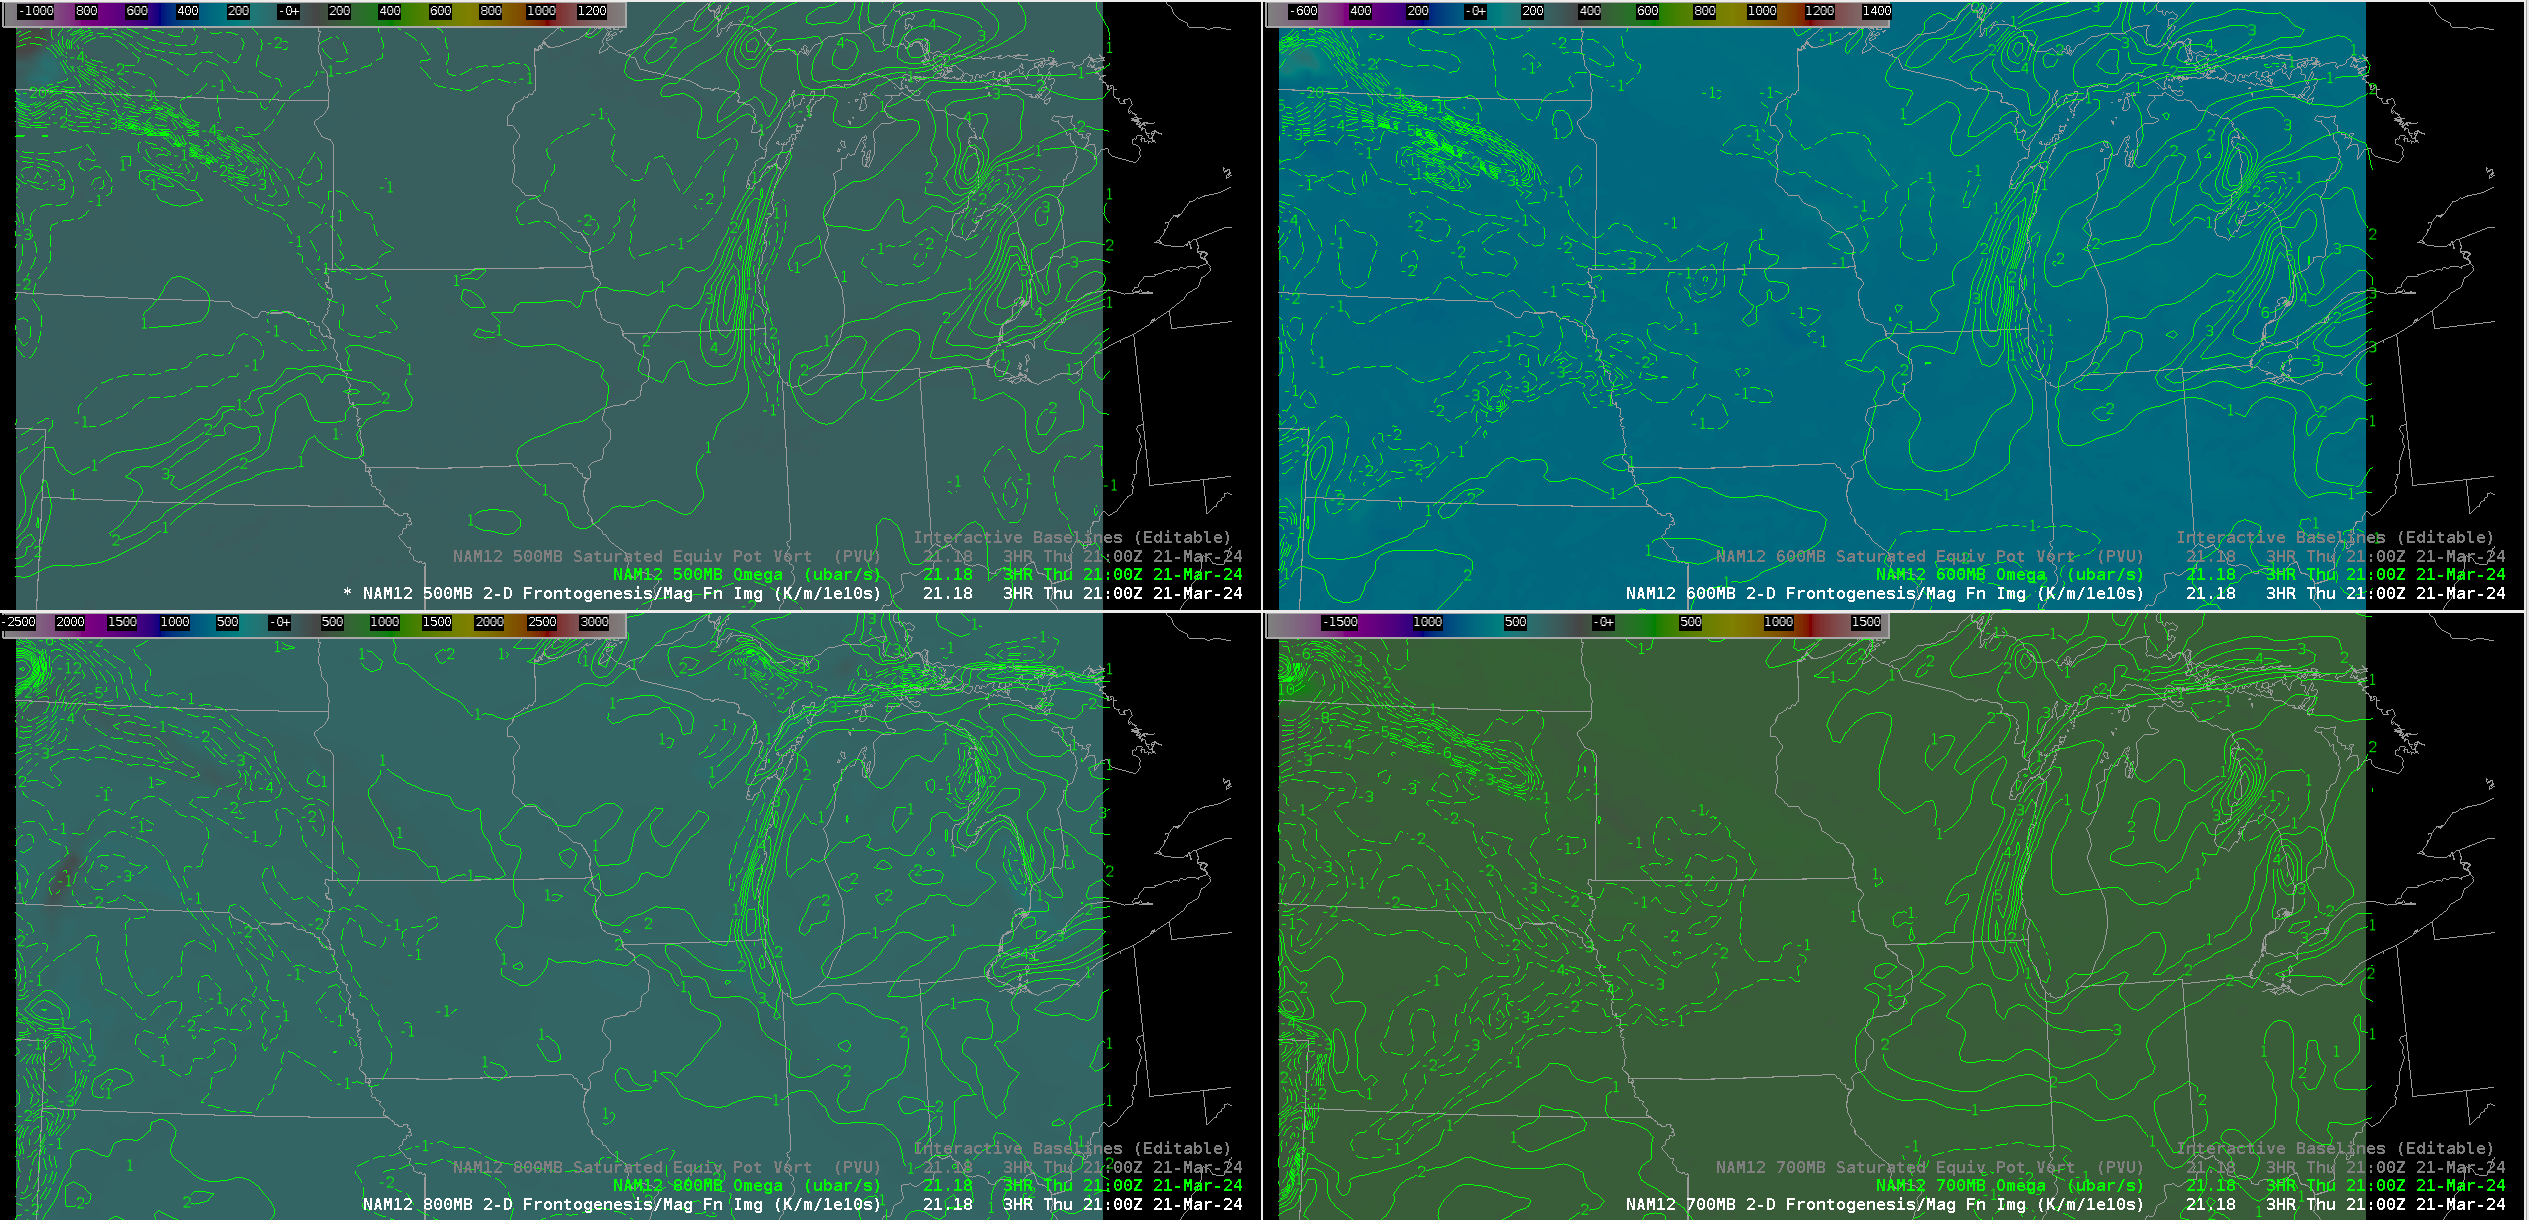
He followed up the email with NAM-12 output, below, showing a pretty good simulation of the rising/sinking motion couplet that might accompany such a band of clouds. In addition, this ACARS sounding from a plane landing at O’Hare, approaching from the southwest, shows stable air below 700 mb
3-h forecasts of omega (dp/dt) valid at 2100 UTC on 21 March 2024: 500 mb (upper left), 600 mb (upper right), 700 mb (lower right), 800 mb (lower left) (Click to enlarge)
Mid-level water vapor infrared (Band 9, 6.95 µm) imagery below, from Scott Bachmeier, CIMSS, suggests cooler cloud tops along the Lake Michigan shoreline, but also warming upstream of that, suggesting, perhaps that downward motion is occurring immediately upwind of the cloud band. (Note also how a break in the cooler brightness temperatures develops over southeast Wisconsin).
GOES-East mid-level water vapor infrared (band 9, 6.95 µm) imagery, 1736-2216 UTC on 21 March 2024 (Click to enlarge)
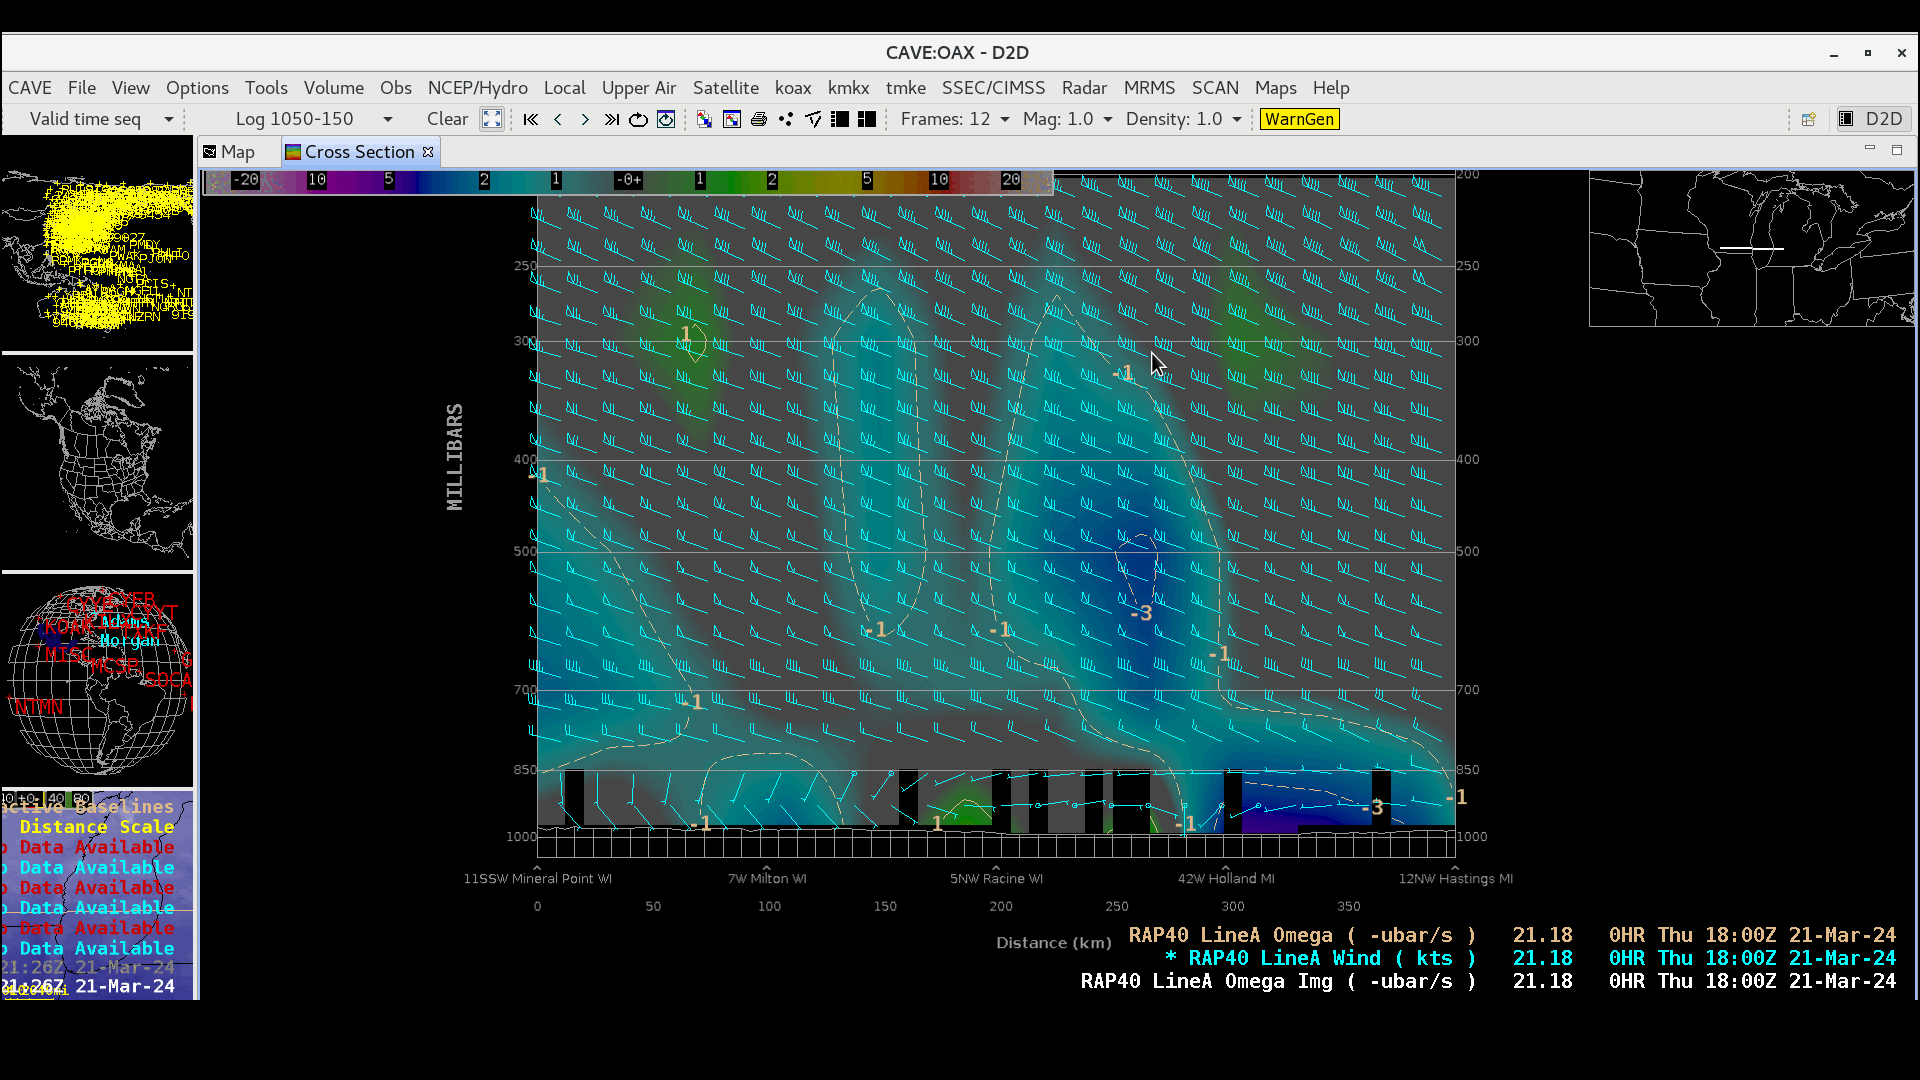
West-to-east oriented cross sections of RAP40 model Omega and Winds along Baseline A-A’ (below) showed a fairly deep column of elevated subsidence (darker shades of blue to violet) just inland over southern Wisconsin, which roughly corresponded to the band of subsidence (warmer/dryer air, darker shades of blue) seen in GOES-16 Water Vapor imagery.
West-to-east oriented cross sections of RAP40 model Omega and Winds along Baseline A-A’, every hour from 1800-2200 UTC (courtesy Scott Bachmeier, CIMSS) [click to enlarge]
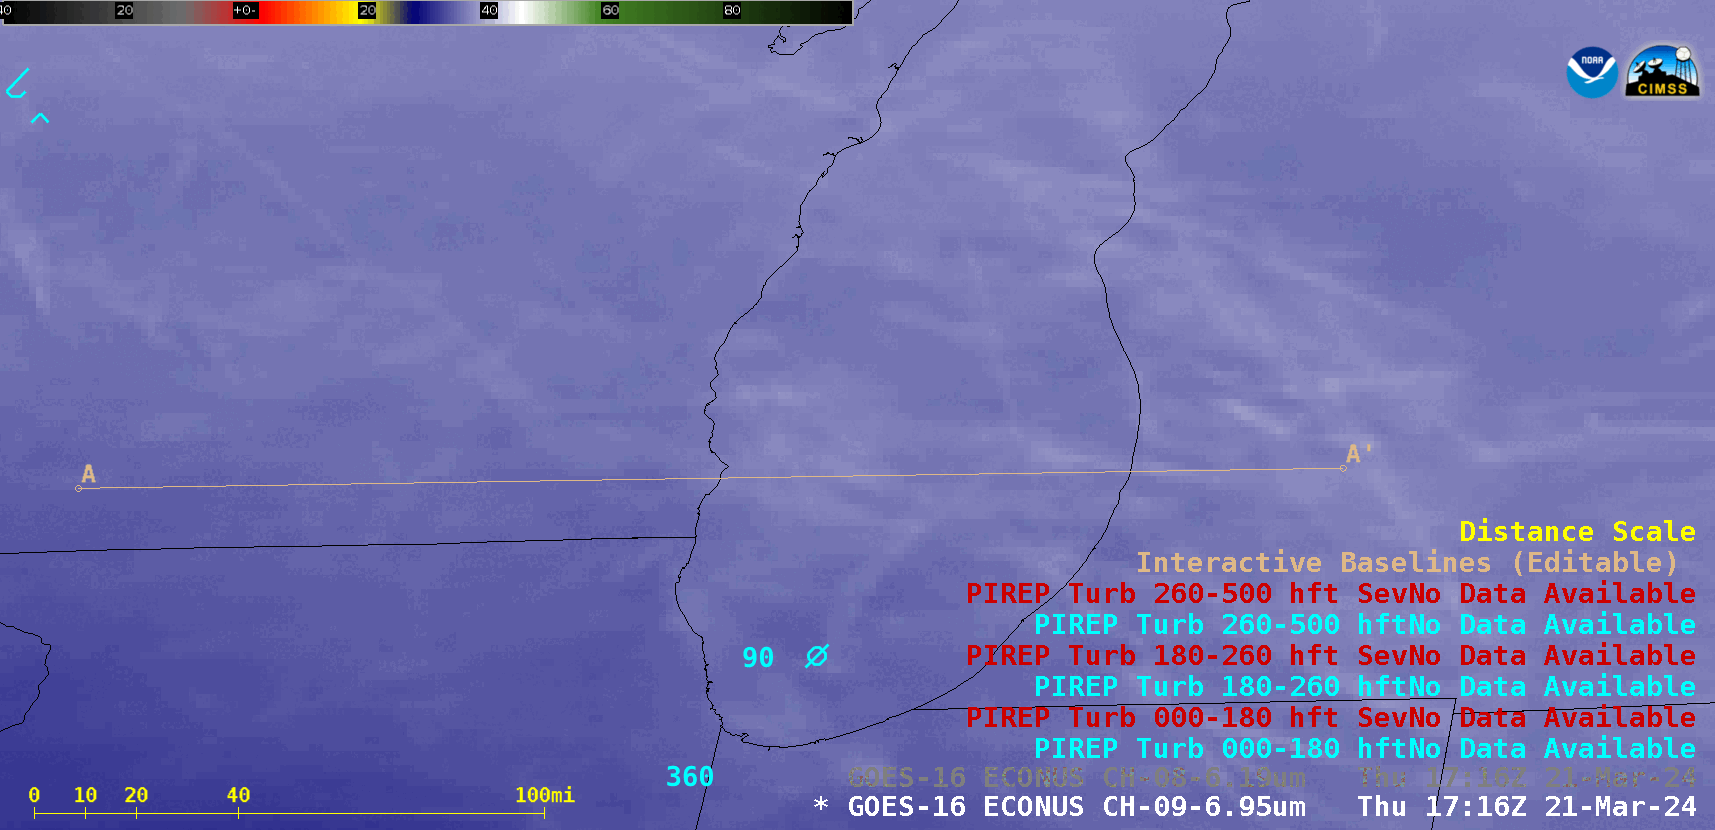
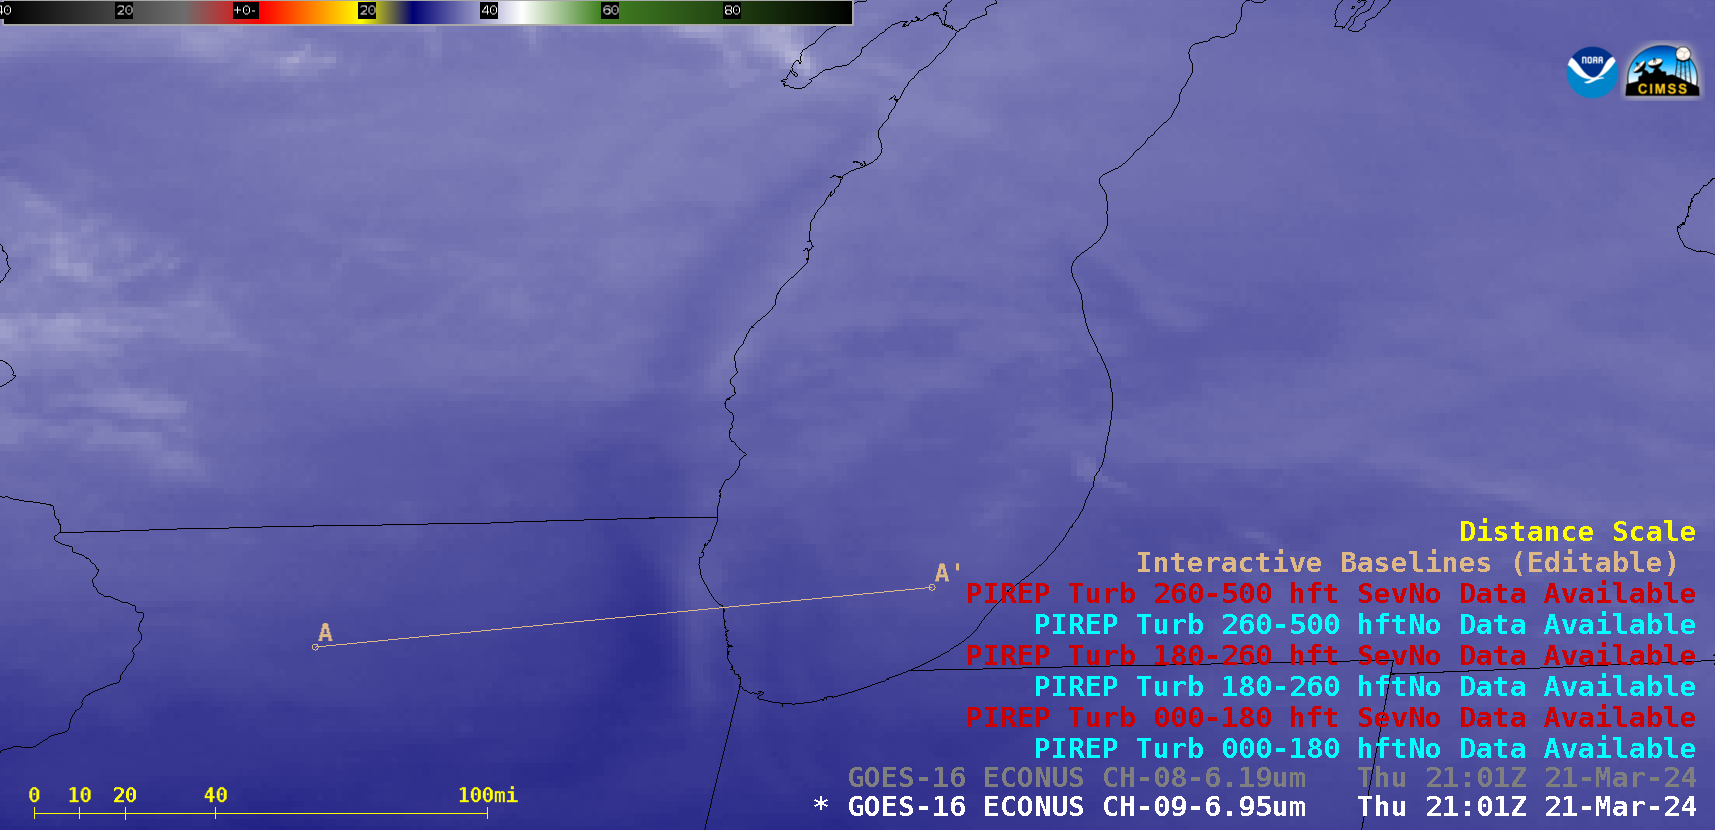
GOES-16 Water Vapor image at 2101 UTC, with Baseline A-A’ moved southward across the Chicago area [click to enlarge]
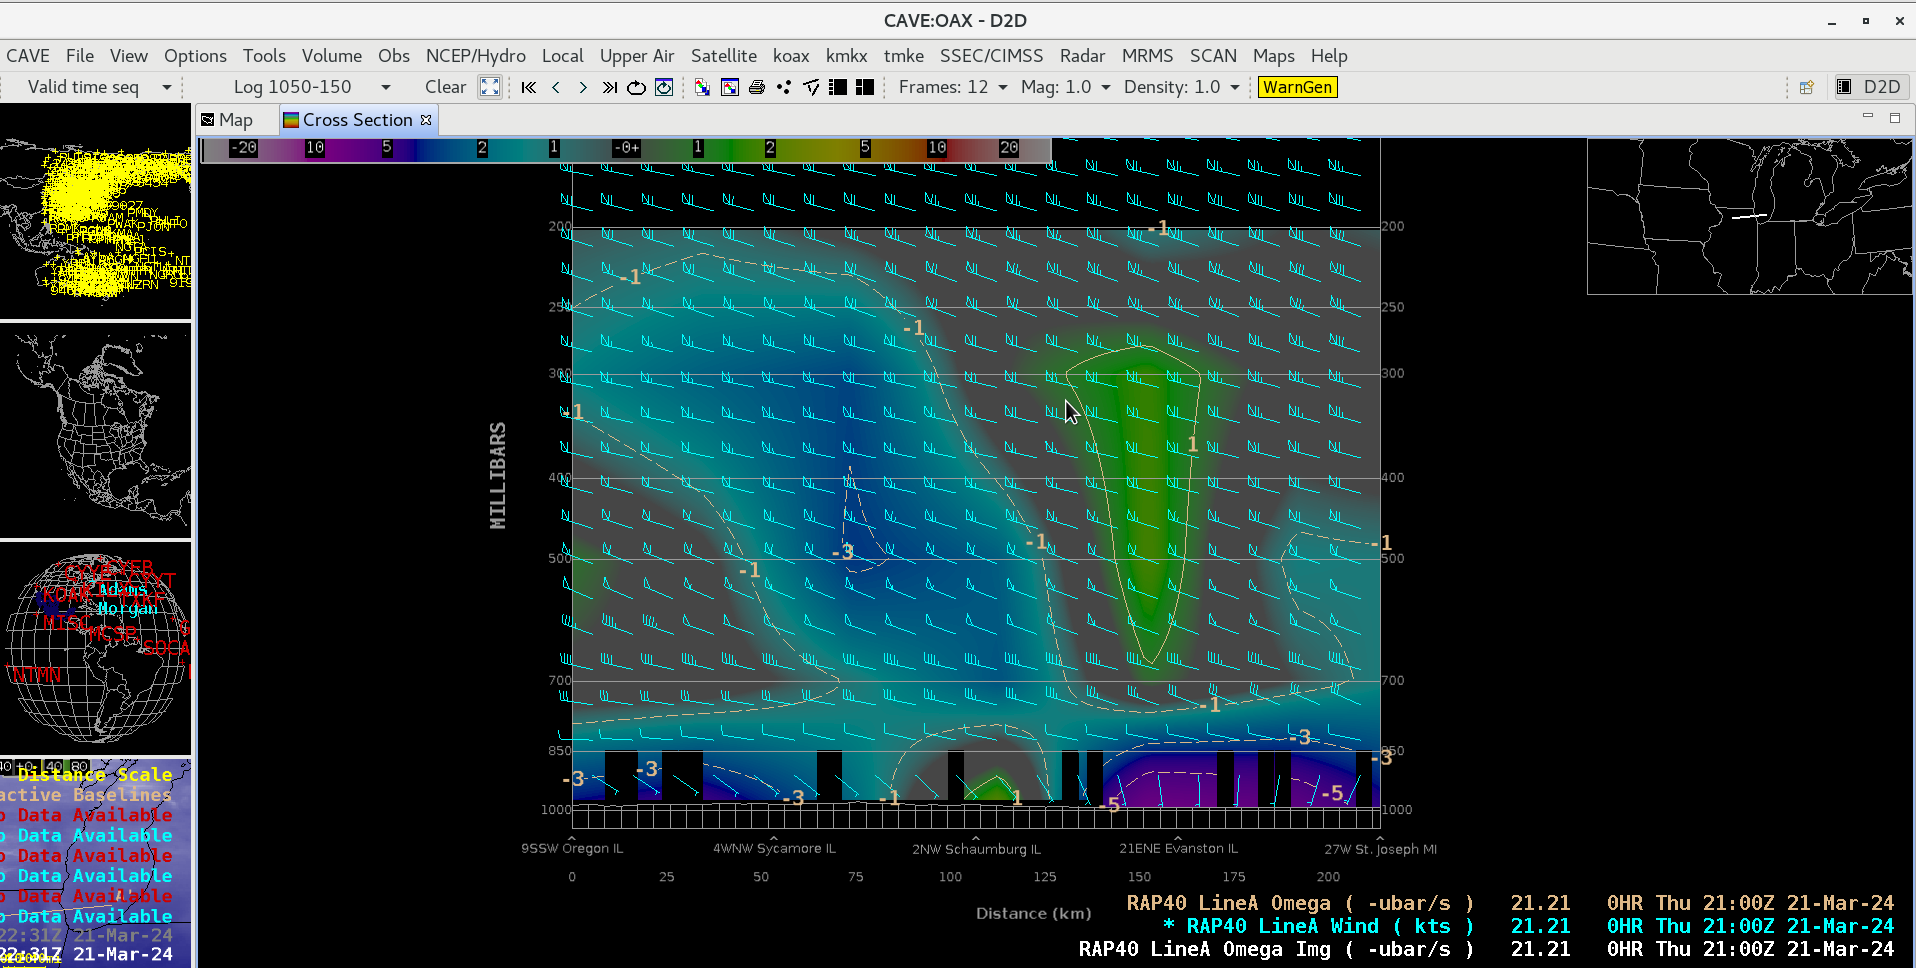
Relocating Baseline A-A’ farther south across the Chicago area, note the colder signature of the cloud band (brighter shades of white) seen just inland on the 2101 UTC Water Vapor image (above), along with a signature of subsidence (darker shades of blue) immediately to the west — the 2100 UTC RAP40 Omega field (below) depicted an elevated couplet of downward (blue) / upward (green) motion located over those two Water Vapor features.
RAP40 model cross section of Omega and Winds at 2100 UTC, along Baseline A-A’ across the Chicago area [click to enlarge]
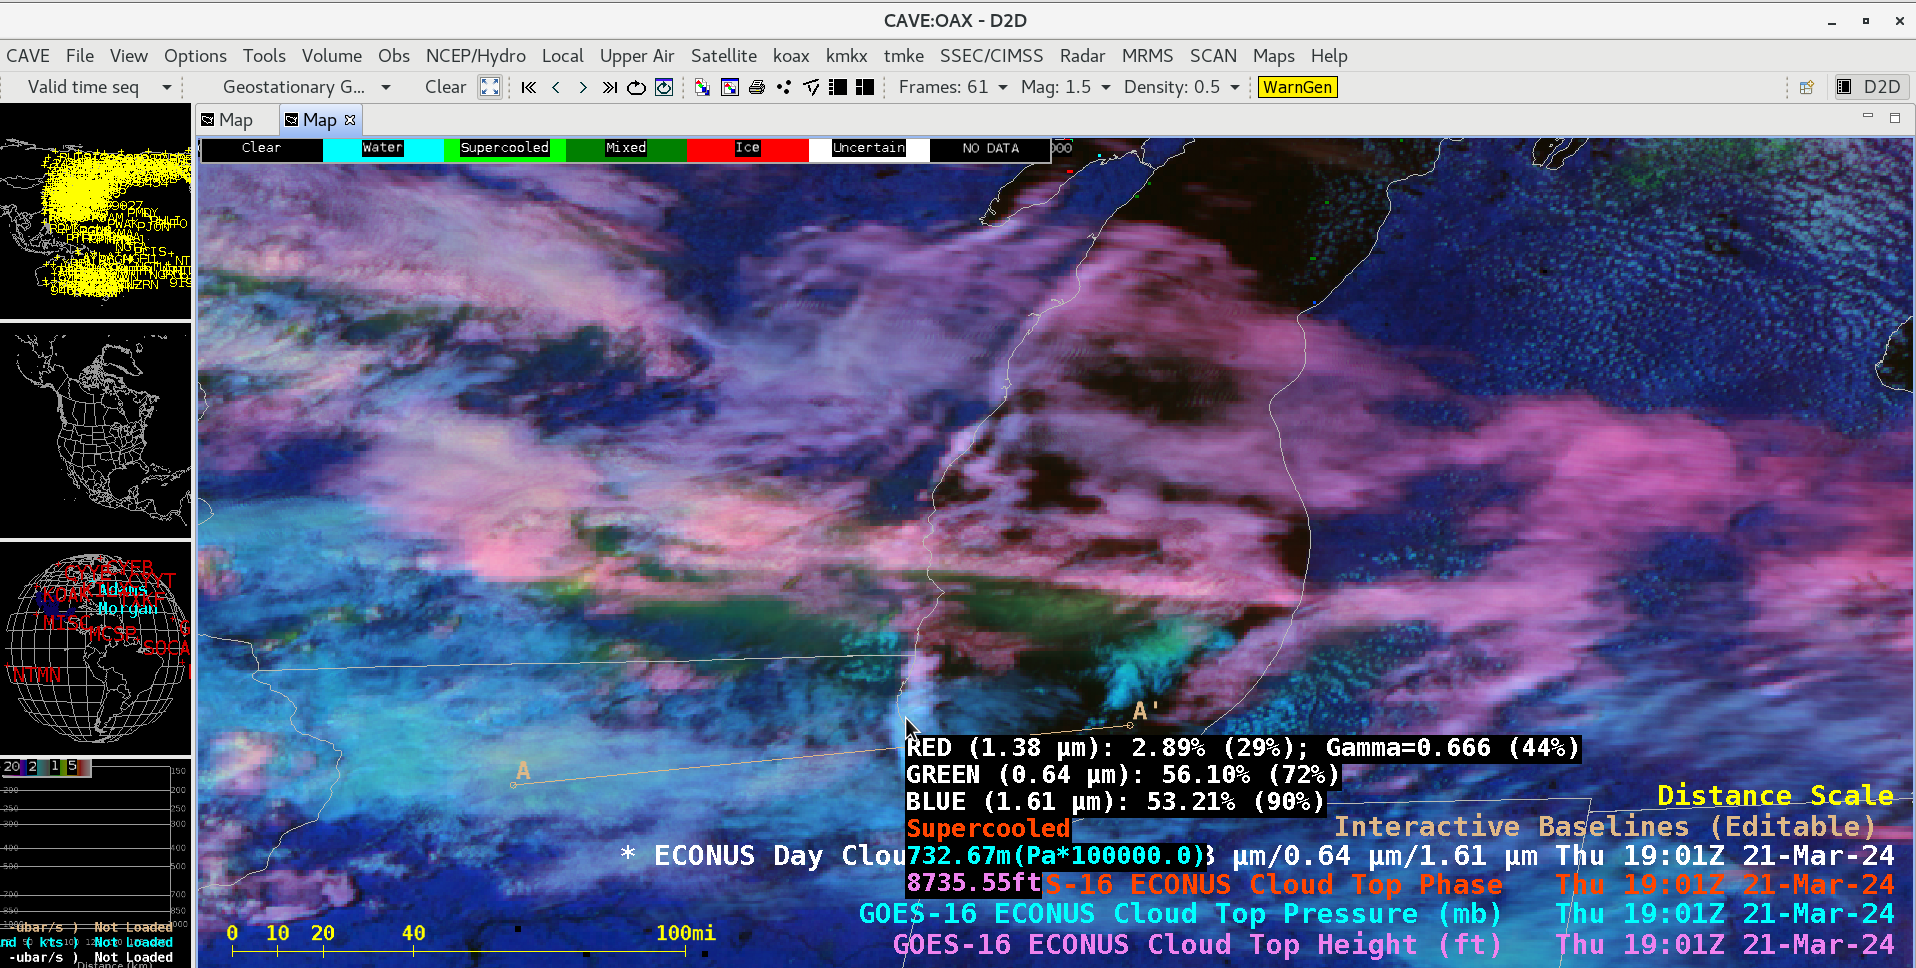
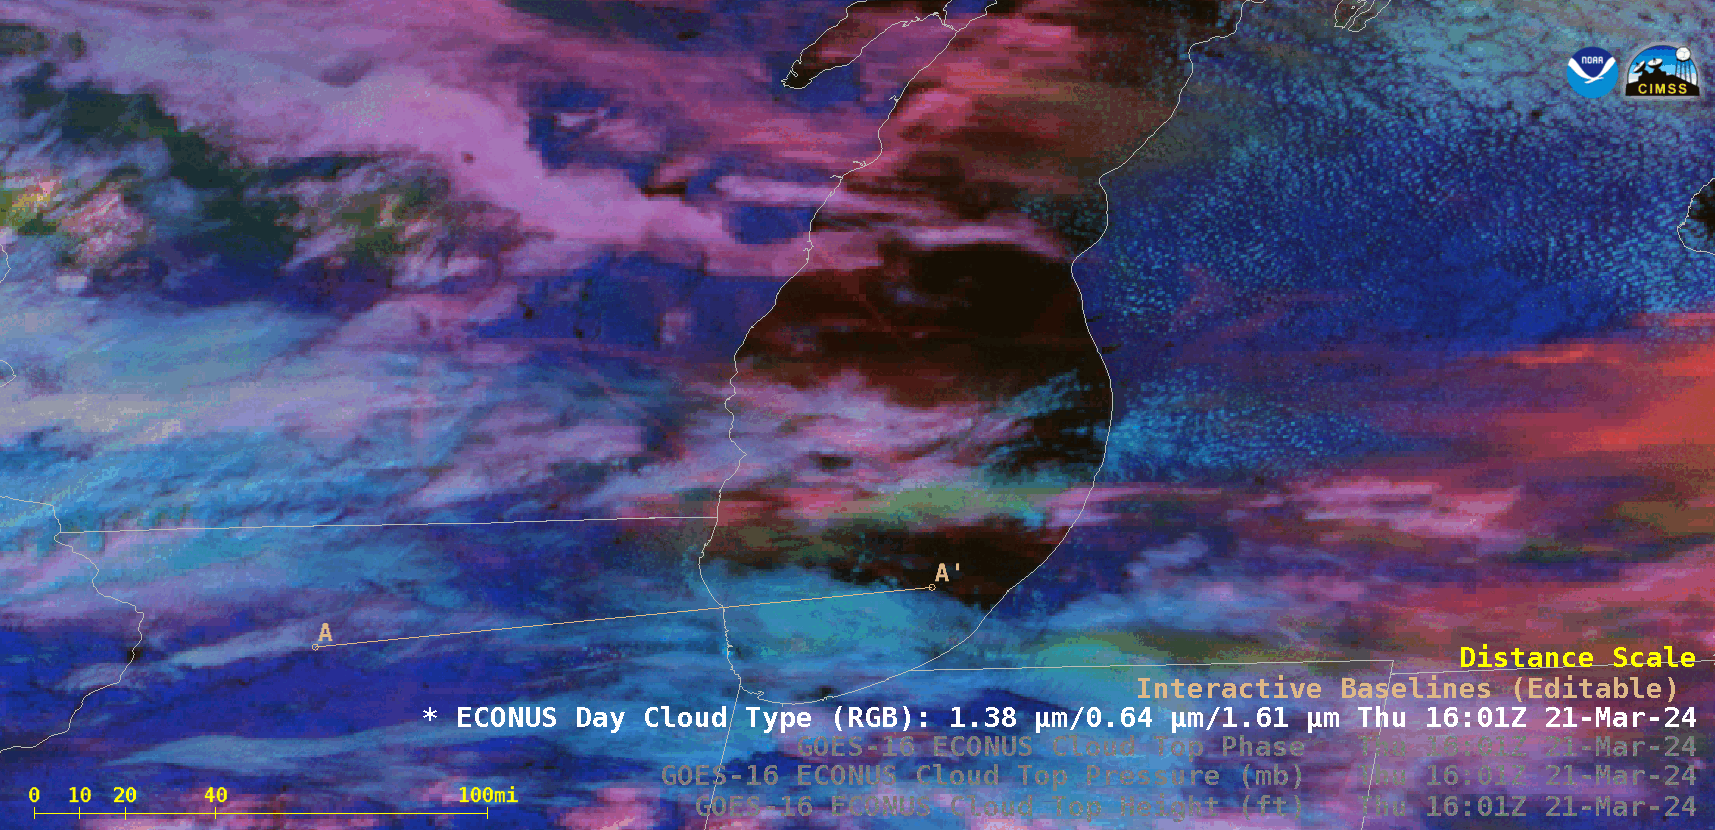
A GOES-16 Day Cloud Type RGB image at 1901 UTC (below) included cursor sampling of the Cloud Top Phase, Cloud Top Pressure and Cloud Top Height derived products along the cloud band (near Baseline A-A’). An animation of Day Cloud Type RGB imagery is available here.
GOES-16 Day Cloud Type RGB image at 1901 UTC, with cursor sampling of the Cloud Top Phase, Cloud Top Pressure and Cloud Top Height derived products (courtesy Scott Bachmeier, CIMSS) [click to enlarge]
This write-up concludes with more questions than answers. The exact answer why the standing wave develops is not yet clear.
The incorporation of MetopC NUCAPS files into AWIPS also means that MetopC Gridded NUCAPS fields are available for forecasters to help diagnose the state of the atmosphere. The toggle above shows two swaths of data, one from MetopC over China, and one from NOAA-20 over the western Pacific. The imagery also includes estimates of the 850-500 mb lapse rates in... Read More
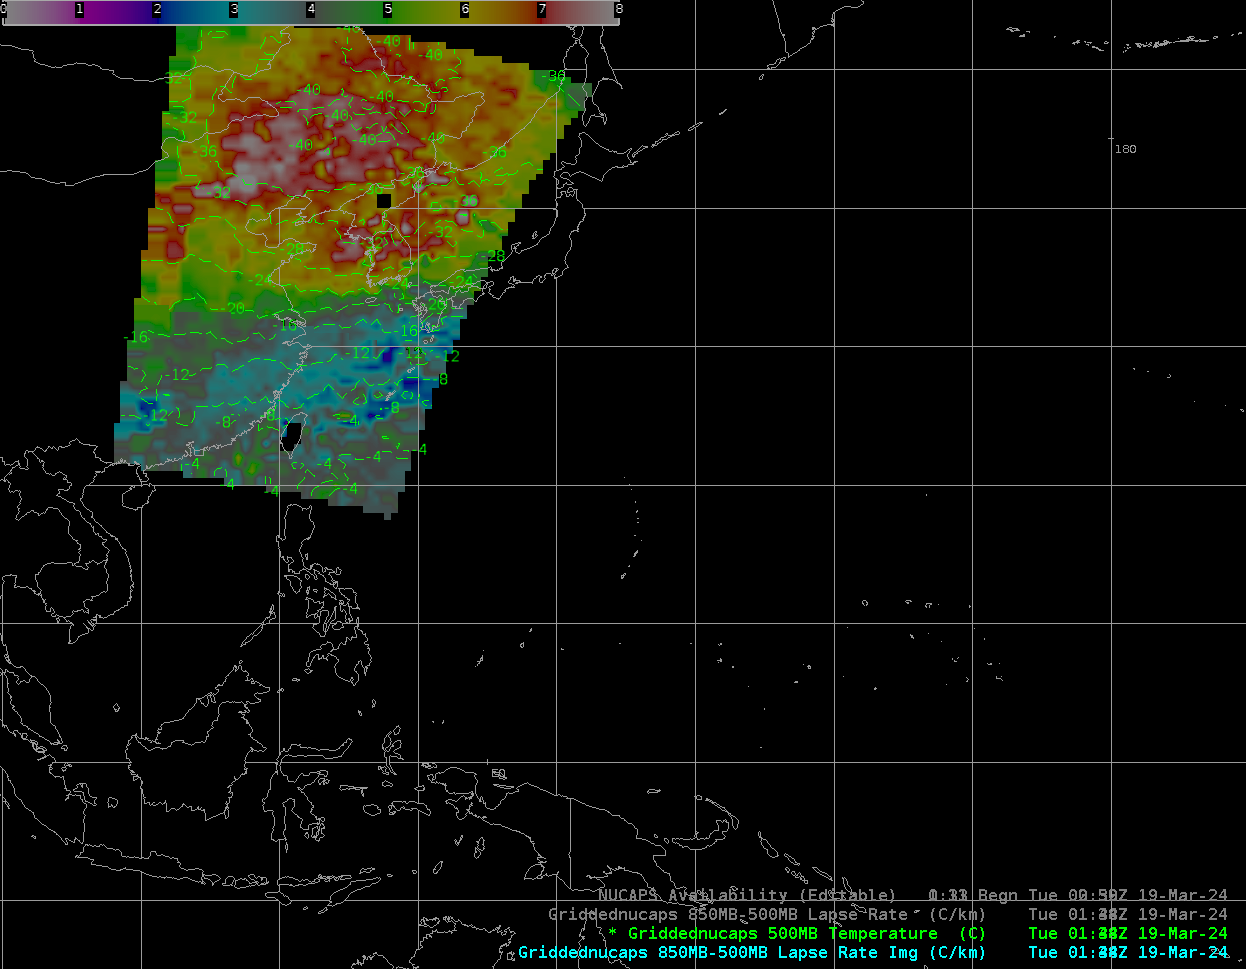
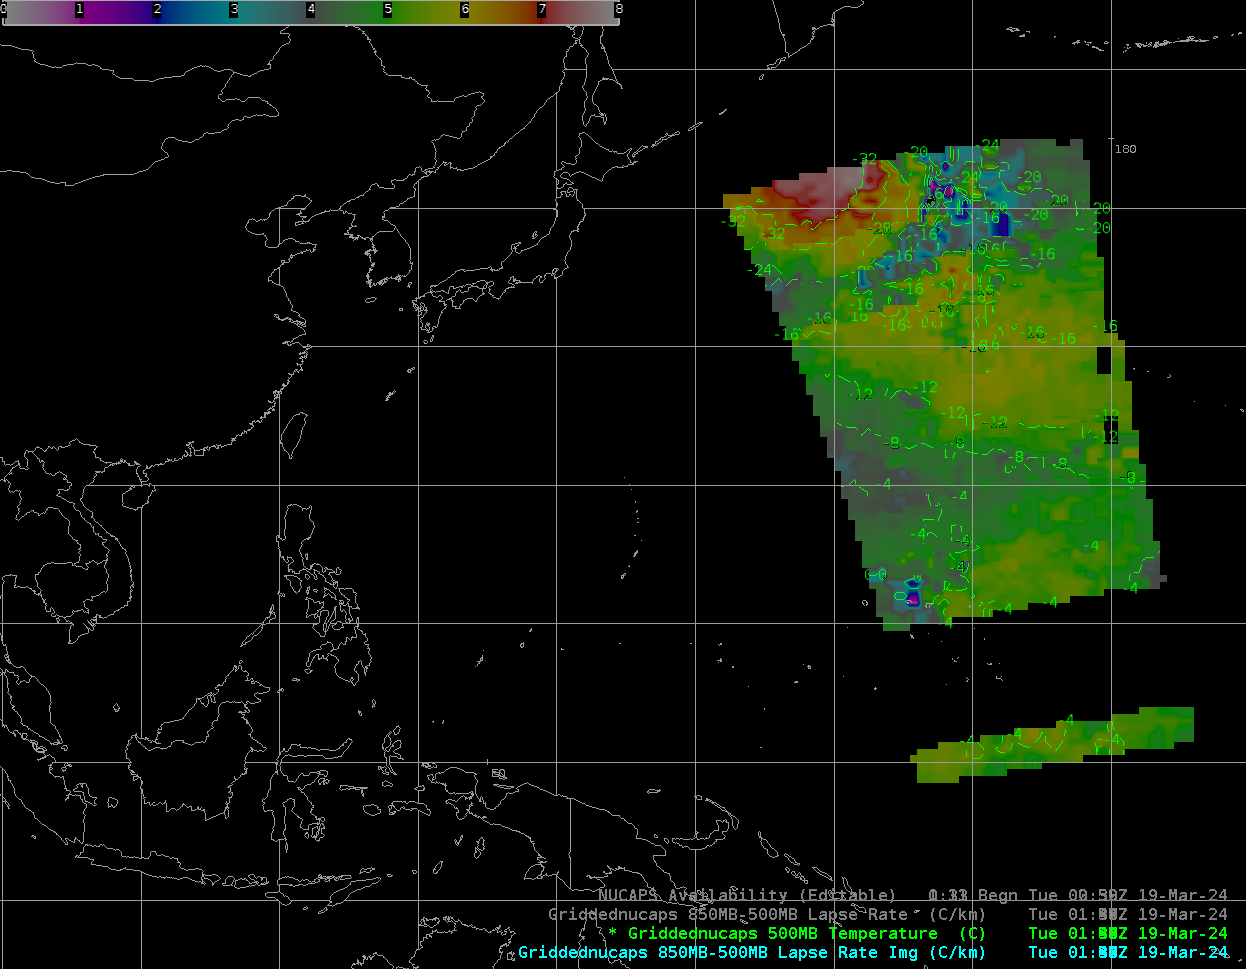
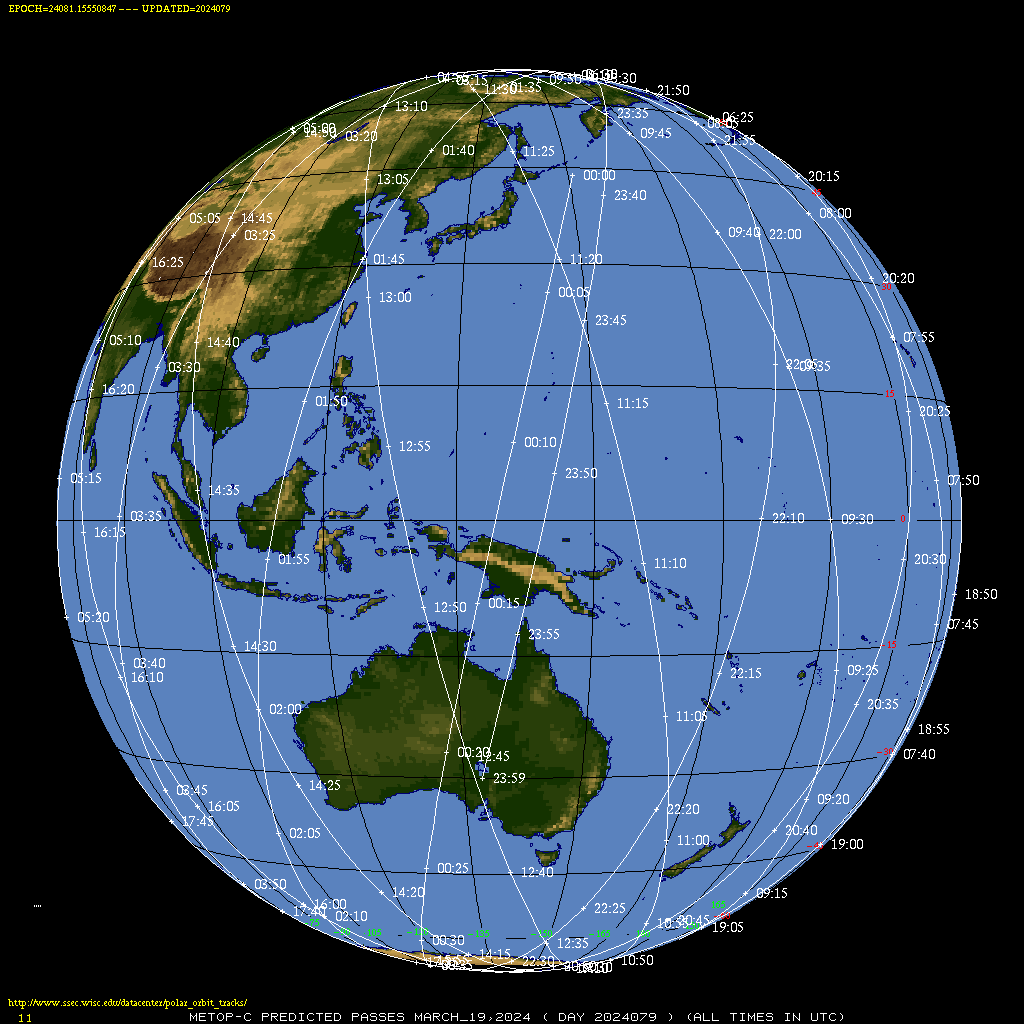
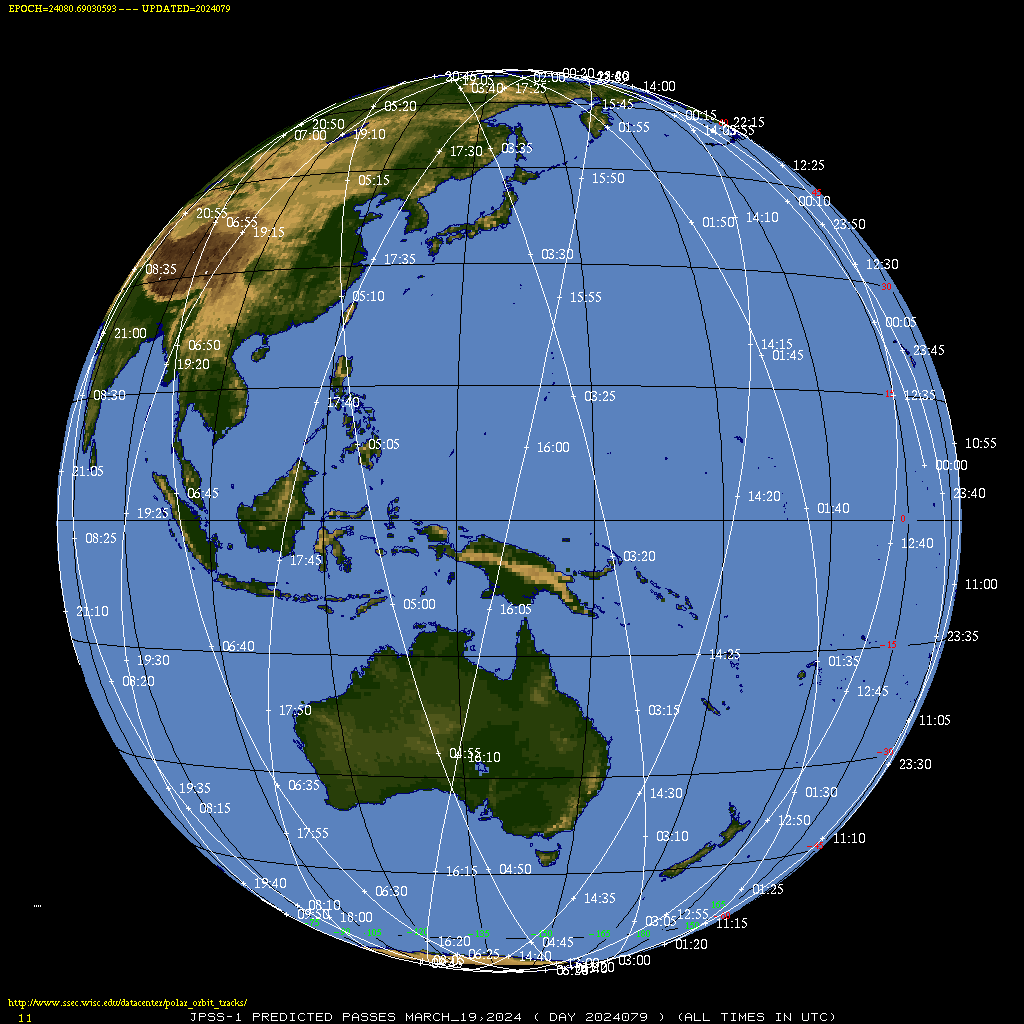
NUCAPS Sounding Availability, 0050 UTC on 19 March 2024 and gridded NUCAPS fields of 500-mb Temperature at 0138 UTC on 19 March 2024 (Click to enlarge)
The incorporation of MetopC NUCAPS files into AWIPS also means that MetopC Gridded NUCAPS fields are available for forecasters to help diagnose the state of the atmosphere. The toggle above shows two swaths of data, one from MetopC over China, and one from NOAA-20 over the western Pacific. The imagery also includes estimates of the 850-500 mb lapse rates in two regions (that I accessed through AWIPS’ Product Browser). Those are viewed a bit more closely below.
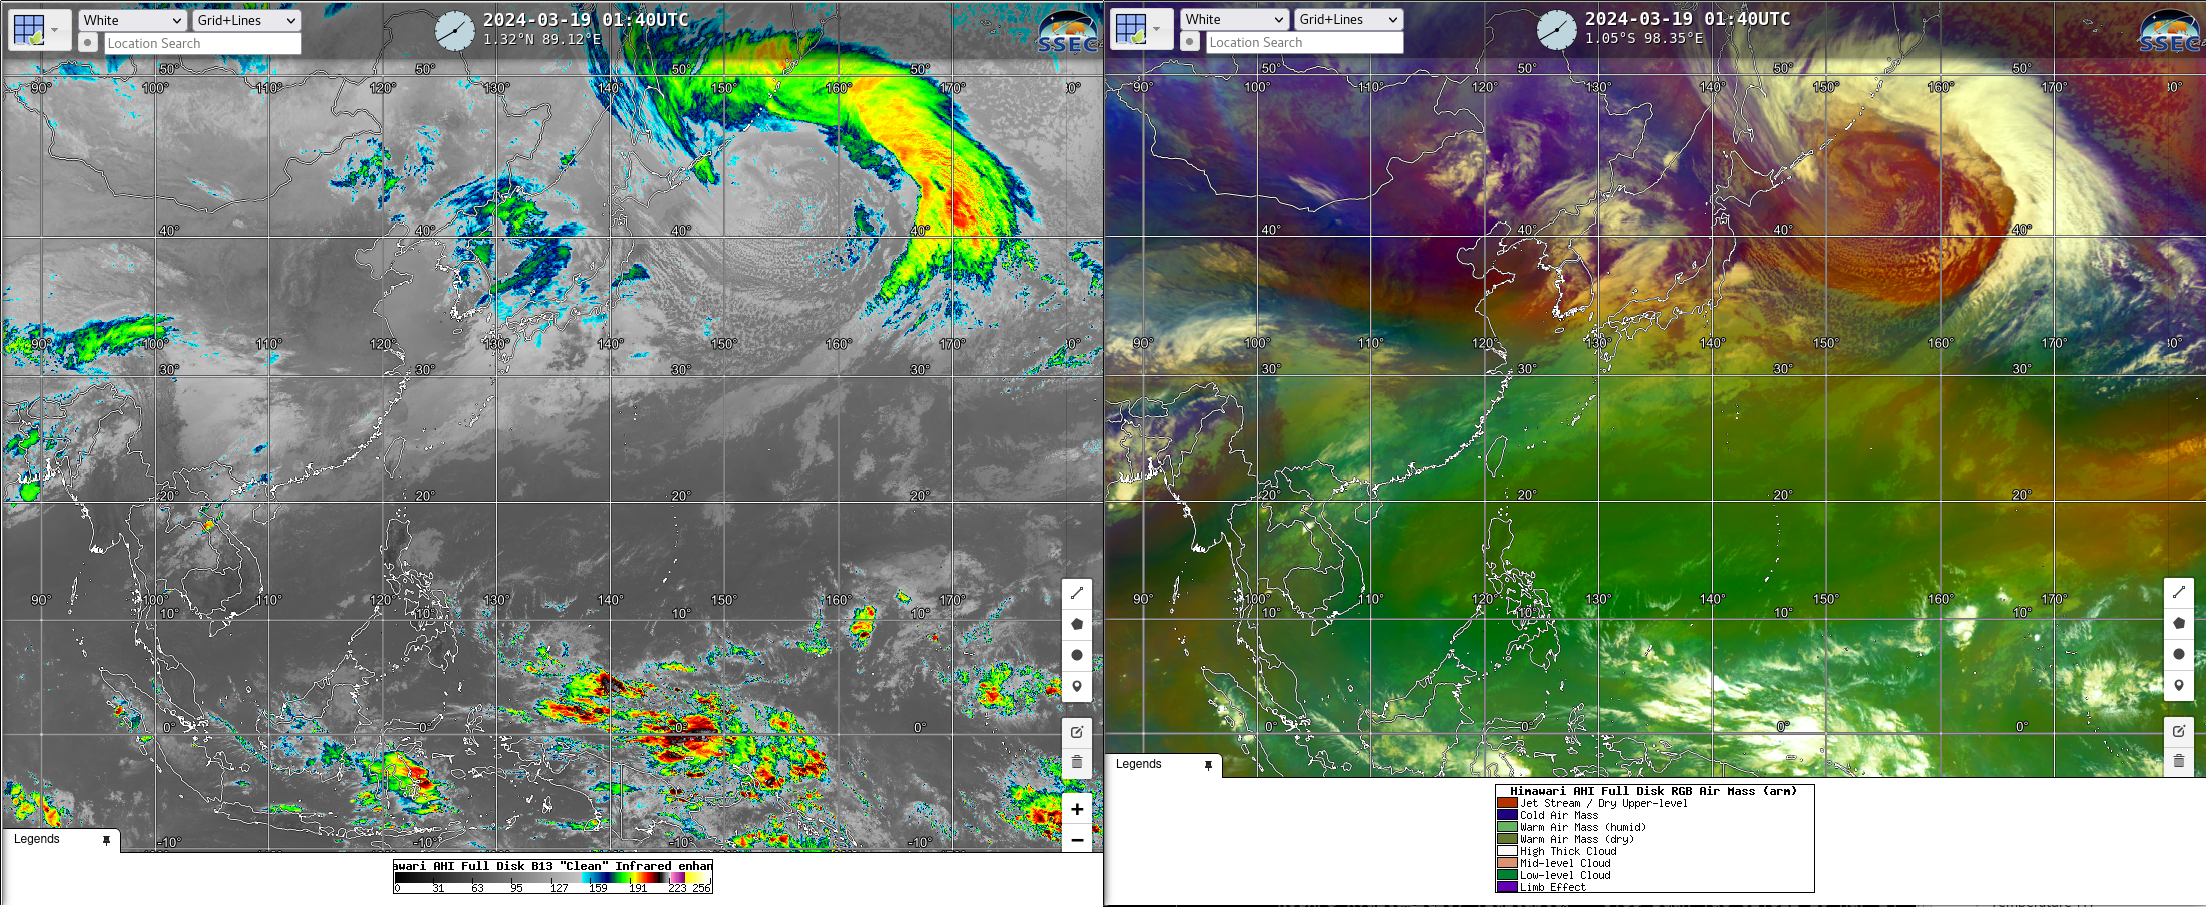
The time of the MetopC and NOAA-20 overpasses was near 0140 UTC on 19 March. Himawari-9 Band 13 (Clean Window infrared, 10.4 µm) and Air Mass RGB imagery (taken from Real Earth) show evidence of a polar front over China. Much of the West Pacific is in a tropical airmass.
Himawari-9 Band 13 (Clean Window infrared, 10.41 µm, left) and Air Mass RGB (right), at 0140 UTC on 19 March 2024 (Click to enlarge)
MetopC Gridded NUCAPS fields, below, show the very cold (ca. -40oC) 500-mb temperatures and steep lapse rates associated with the upper level front over China.
MetopC Gridded NUCAPS Lapse Rates (850-500 mb, color shaded) and 500-mb temperatures (contoured in green), 0138-0140 UTC on 19 March 2024 (Click to enlarge)
At about the same time, NOAA-20 saw very steep lapse rates each of Japan, but relatively warmer 500-mb temperatures (i.e., the lower levels were likely warmer).
NOAA-20 Gridded NUCAPS Fields (color-shaded 850-500 mb lapse rates and green-contoured 500-mb temperatures), 0138-0152 UTC on 19 March 2024
Use gridded NUCAPS fields to determine what’s going on in the troposphere in regions where other sources of data are scarce, and also over data-rich regions where more thermodynamic information will be useful.


