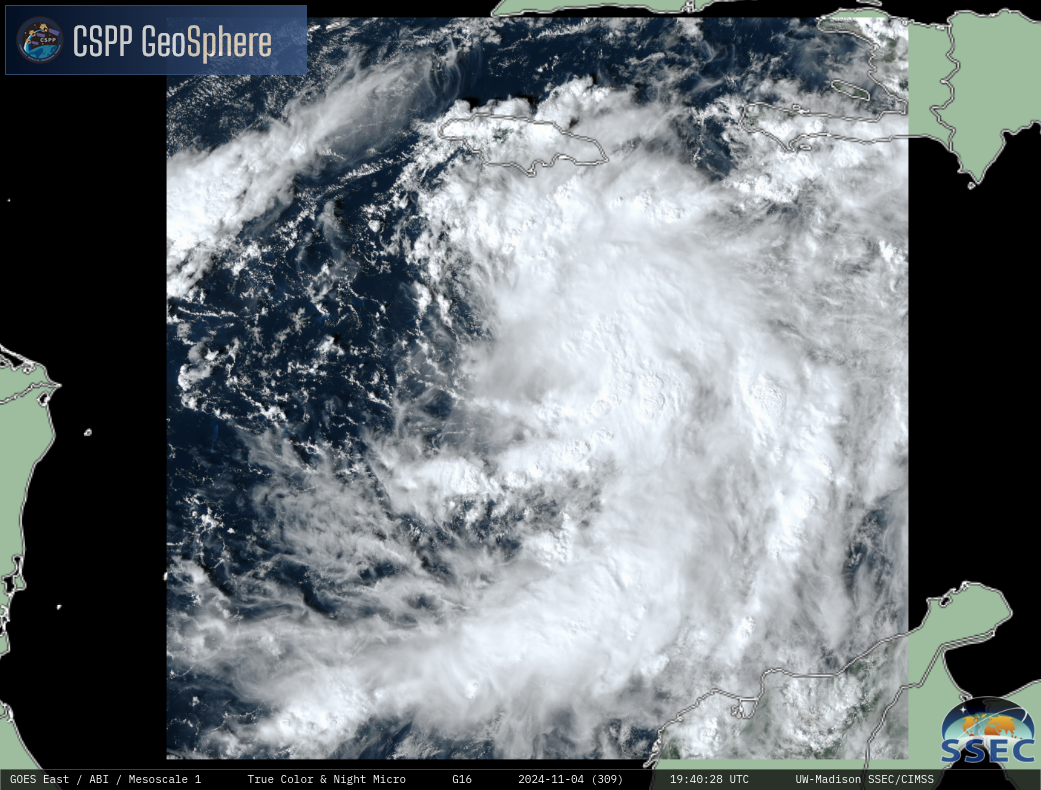
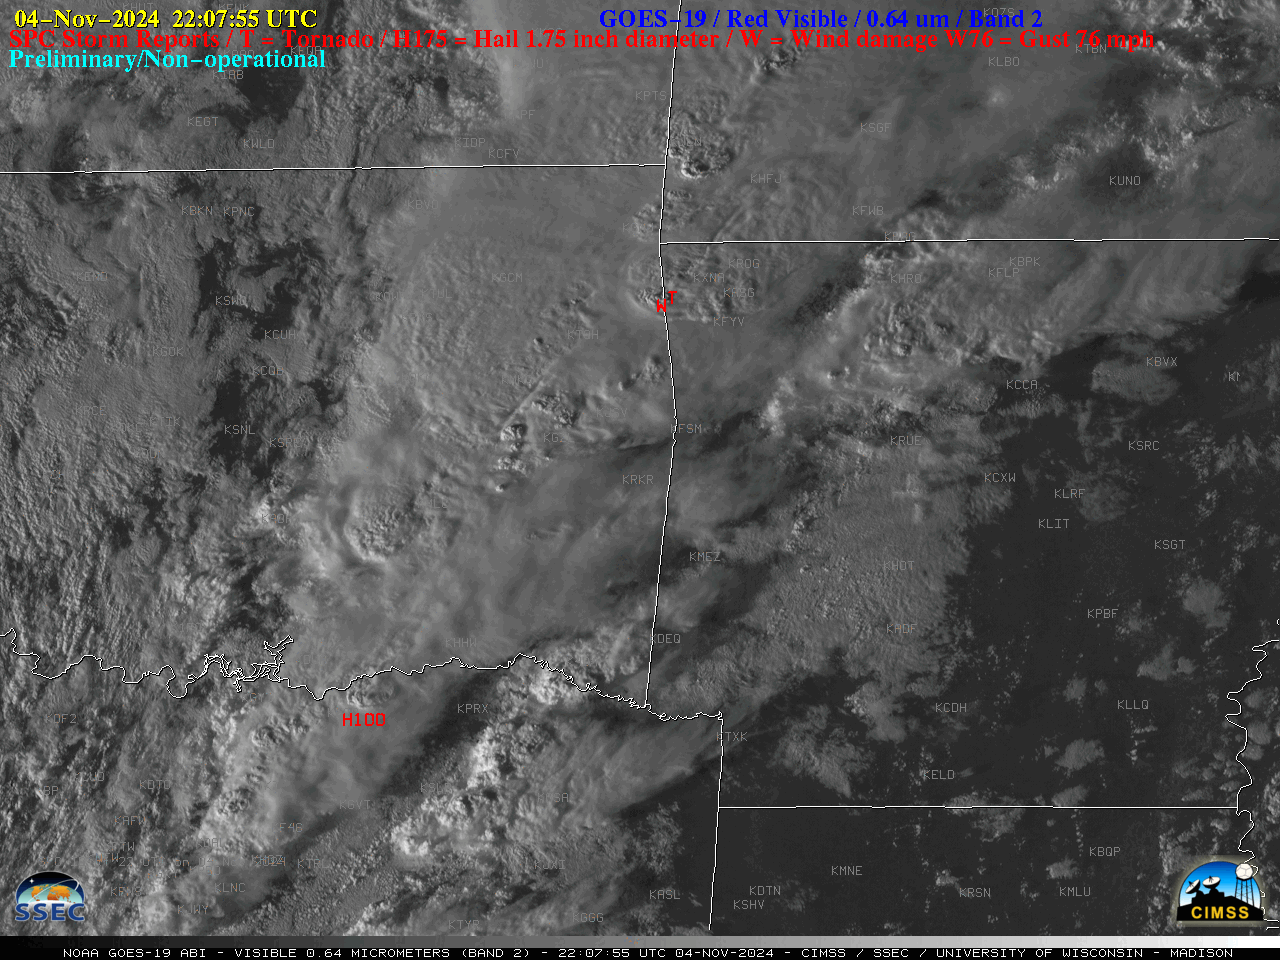
The area of convection that has been percolating within the Caribbean has acquired sufficient organization and speed to be named Tropical Storm Rafael (at 2100 UTC on 4 November, near the end of the animation, above, created at the CSPP Geosphere site). The storm is approaching the island of Jamaica where Tropical Storm Warnings are in effect.
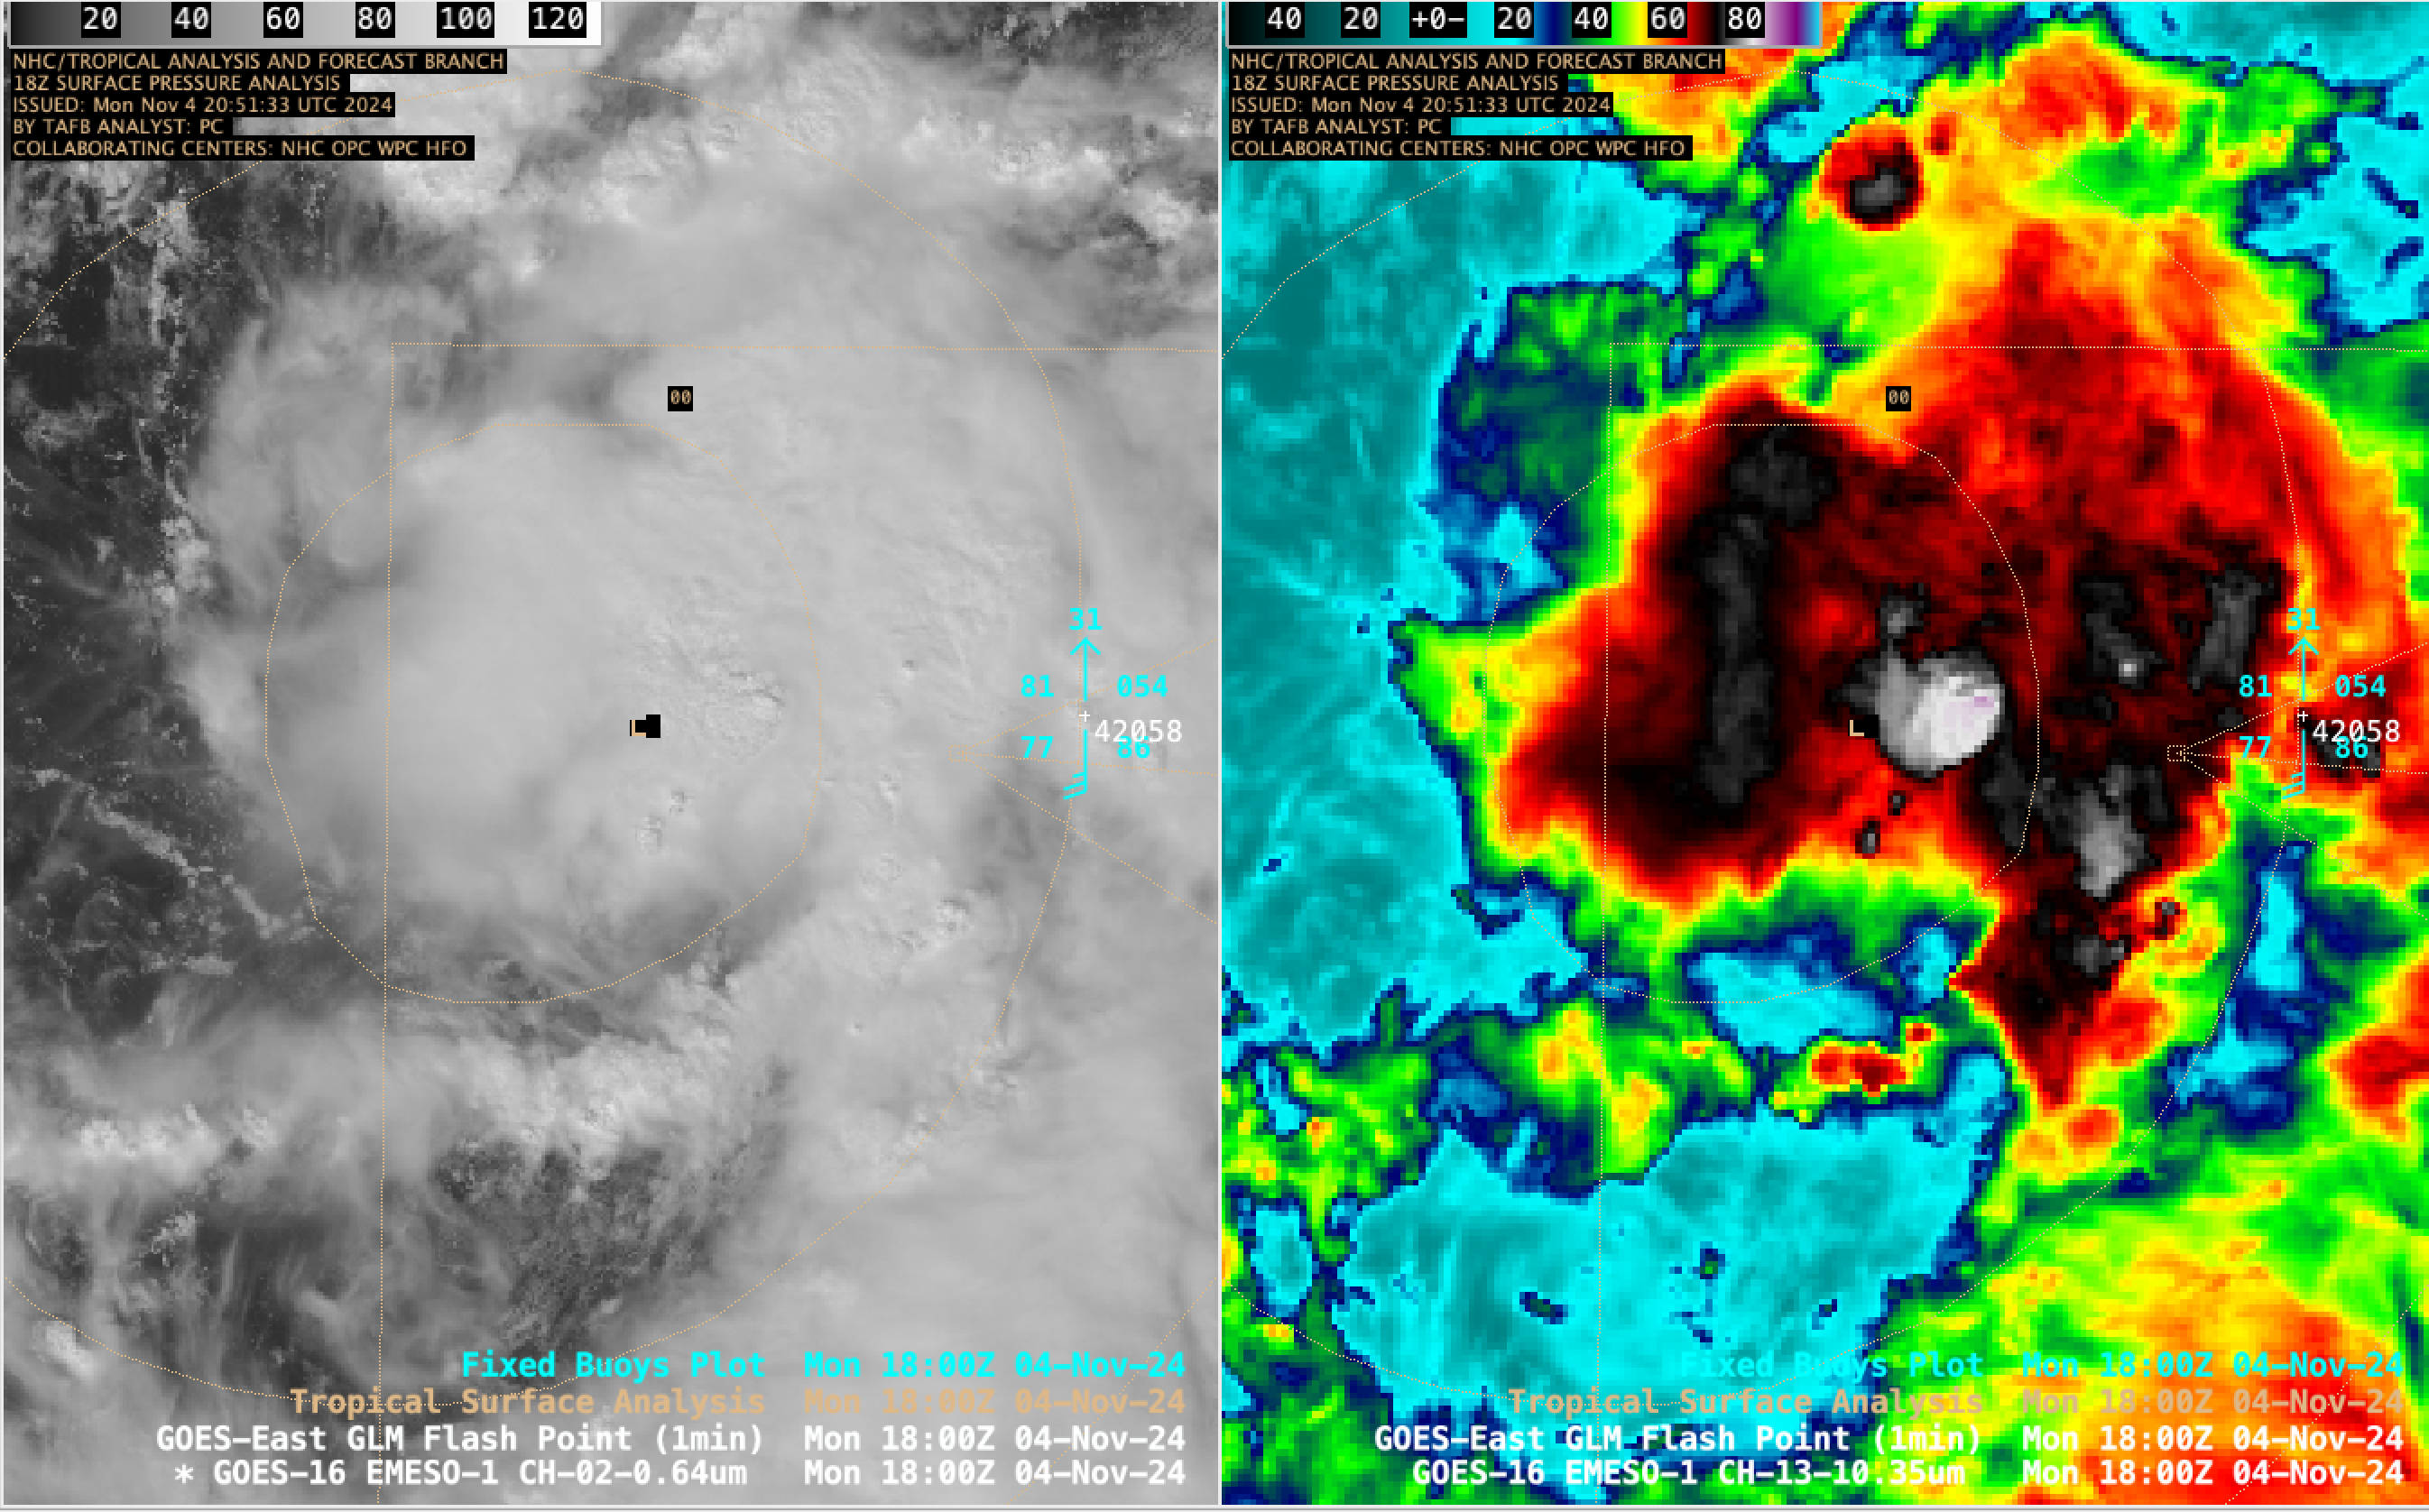
1-minute GOES-16 Red Visible (0.64 µm, left) and Clean Infrared Window (10.3 µm, right) images with an overlay of GLM Flash Points, from 1654-2200 UTC on 4 November (courtesy Scott Bachmeier, CIMSS) [click to play MP4 animation]
1-minute GOES-16 Visible and Infrared images (above) showed Rafael as it intensified from a Tropical Depression to a Tropical Storm by 2100 UTC. Near the center of Rafael’s circulation there were periodic convective bursts (exhibiting cloud-top infrared brightness temperatures as cold as -88ºC), but there was very little GLM-observed lightning activity near the core of the tropical cyclone. Rafael was located just to the west of Buoy 42058, where the Sea Surface Temperature was 86ºF.
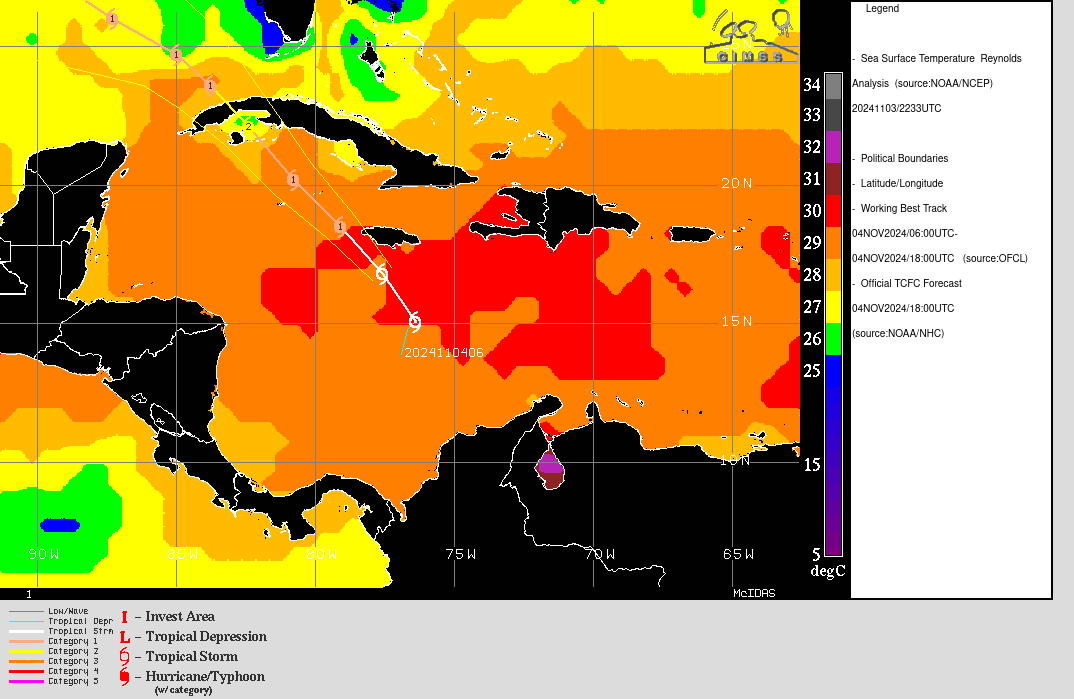
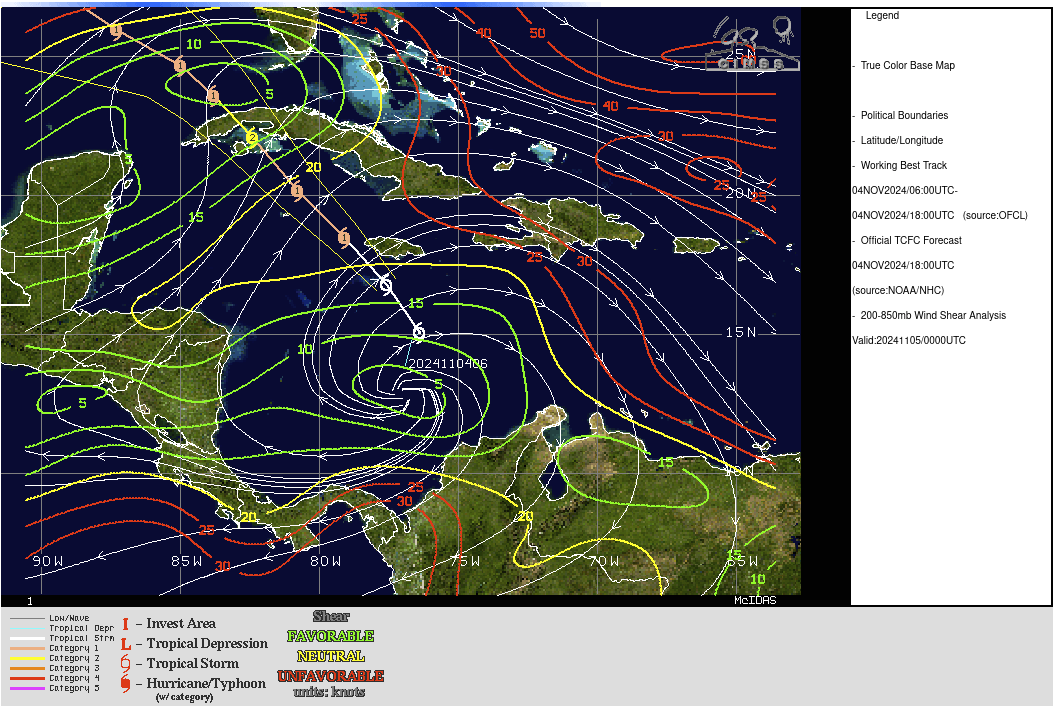
Rafael is currently in a region of warm sea-surface temperatures and low shear (imagery below is taken from SSEC/CIMSS’s tropical weather website), and slow strengthening is forecast as it moves between Jamaica and the Caymans en route to western Cuba.
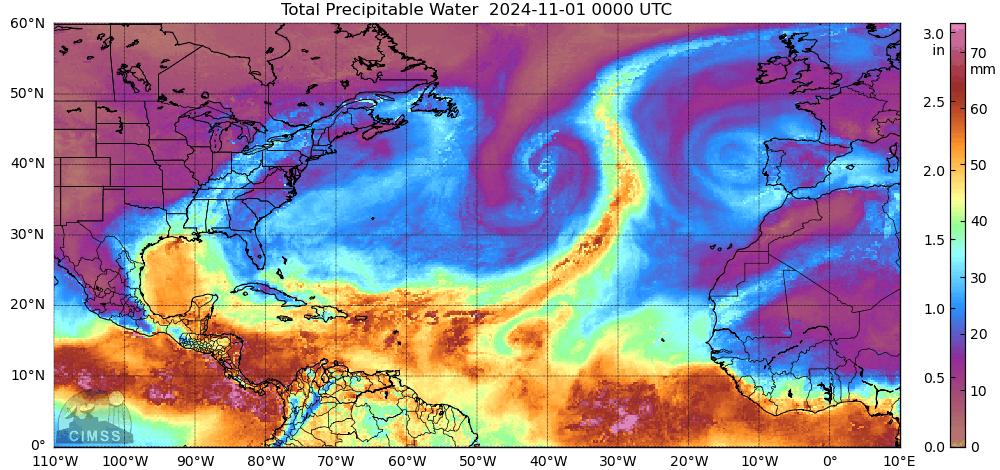
The area of rich moisture that is supporting Rafael’s convection has been over the western Caribbean since late October. The animation for November of TPW from the MIMIC site (online archive) is shown below. Note, however, the relative dryness over the Gulf of Mexico, where Rafael is forecast to be by week’s end. The storm would have to overcome a significant amount of dryness to remain intense.
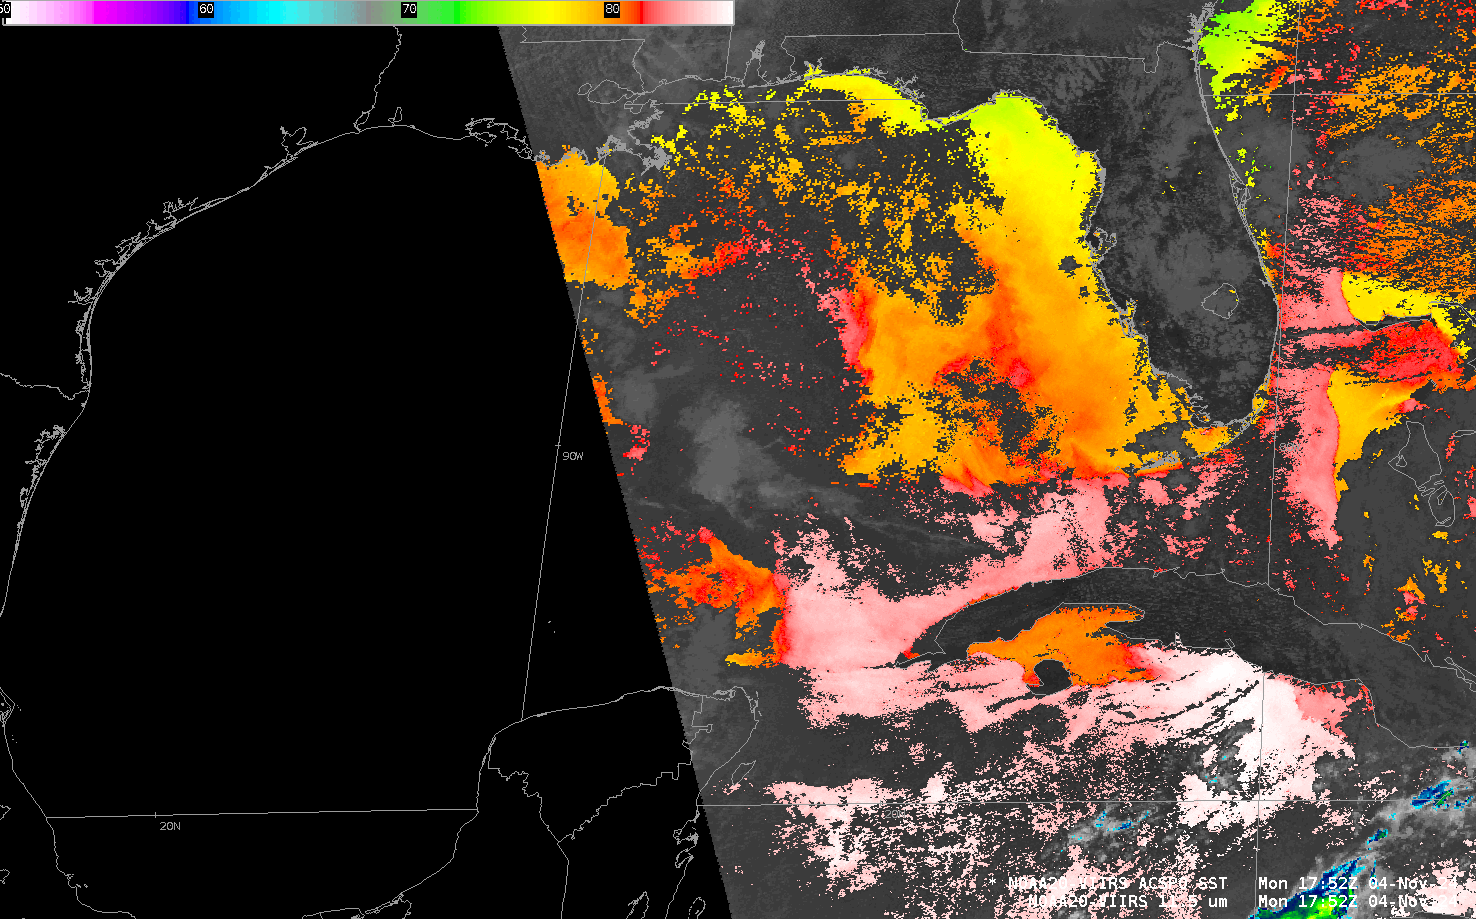
Advanced Clear-Sky Processor for Ocean (ACSPO) Sea Surface Temperatures from VIIRS, below, shown with I05 (11.45 µm) data (NOAA-20 data were downloaded at the CIMSS Direct Broadcast site and processed with CSPP software). Note the lack of convection over the Gulf of Mexico, and the water temperatures. Red in the SST enhancement below is approximately 80oF. Shelf waters are relatively cool.
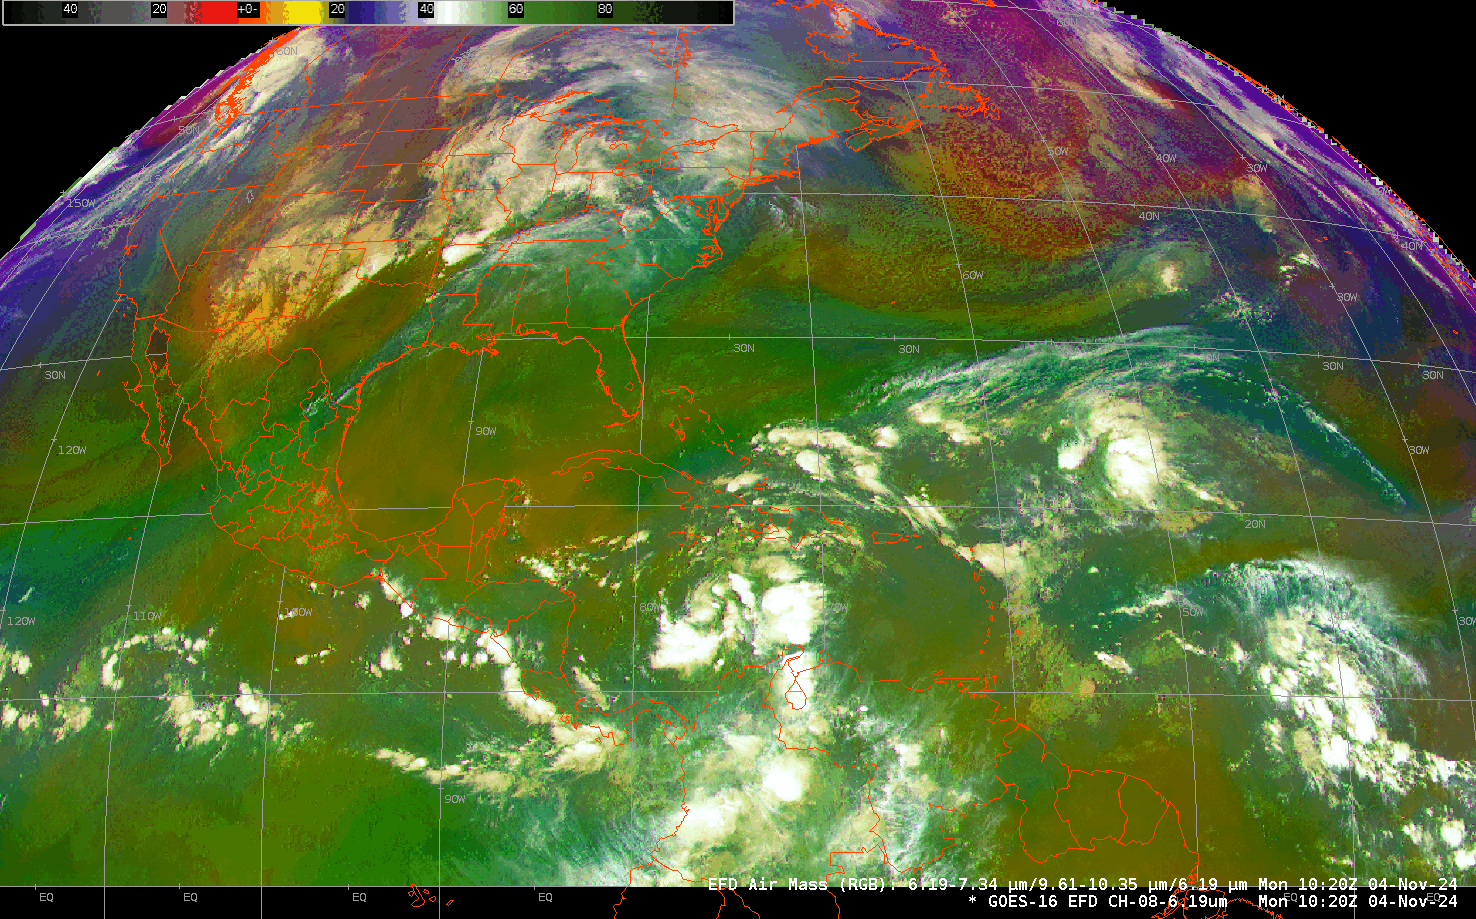
GOES-East airmass RGB imagery, below, shows Rafael developing within a moist airmass — that is, a green region within the RGB. As it moves northwestward, however, the environment becomes less favorable; this is indicated by regions with more orange. (Here is a Quick Guide on airmass RGB; here is another one)
===== Late 5 November Update =====
1-minute GOES-16 Clean Infrared Window (10.3 µm) images with an overlay of GLM Flash Points, from 1630 UTC on 5 November to 0130 UTC on 6 November (courtesy Scott Bachmeier, CIMSS) [click to play MP4 animation]
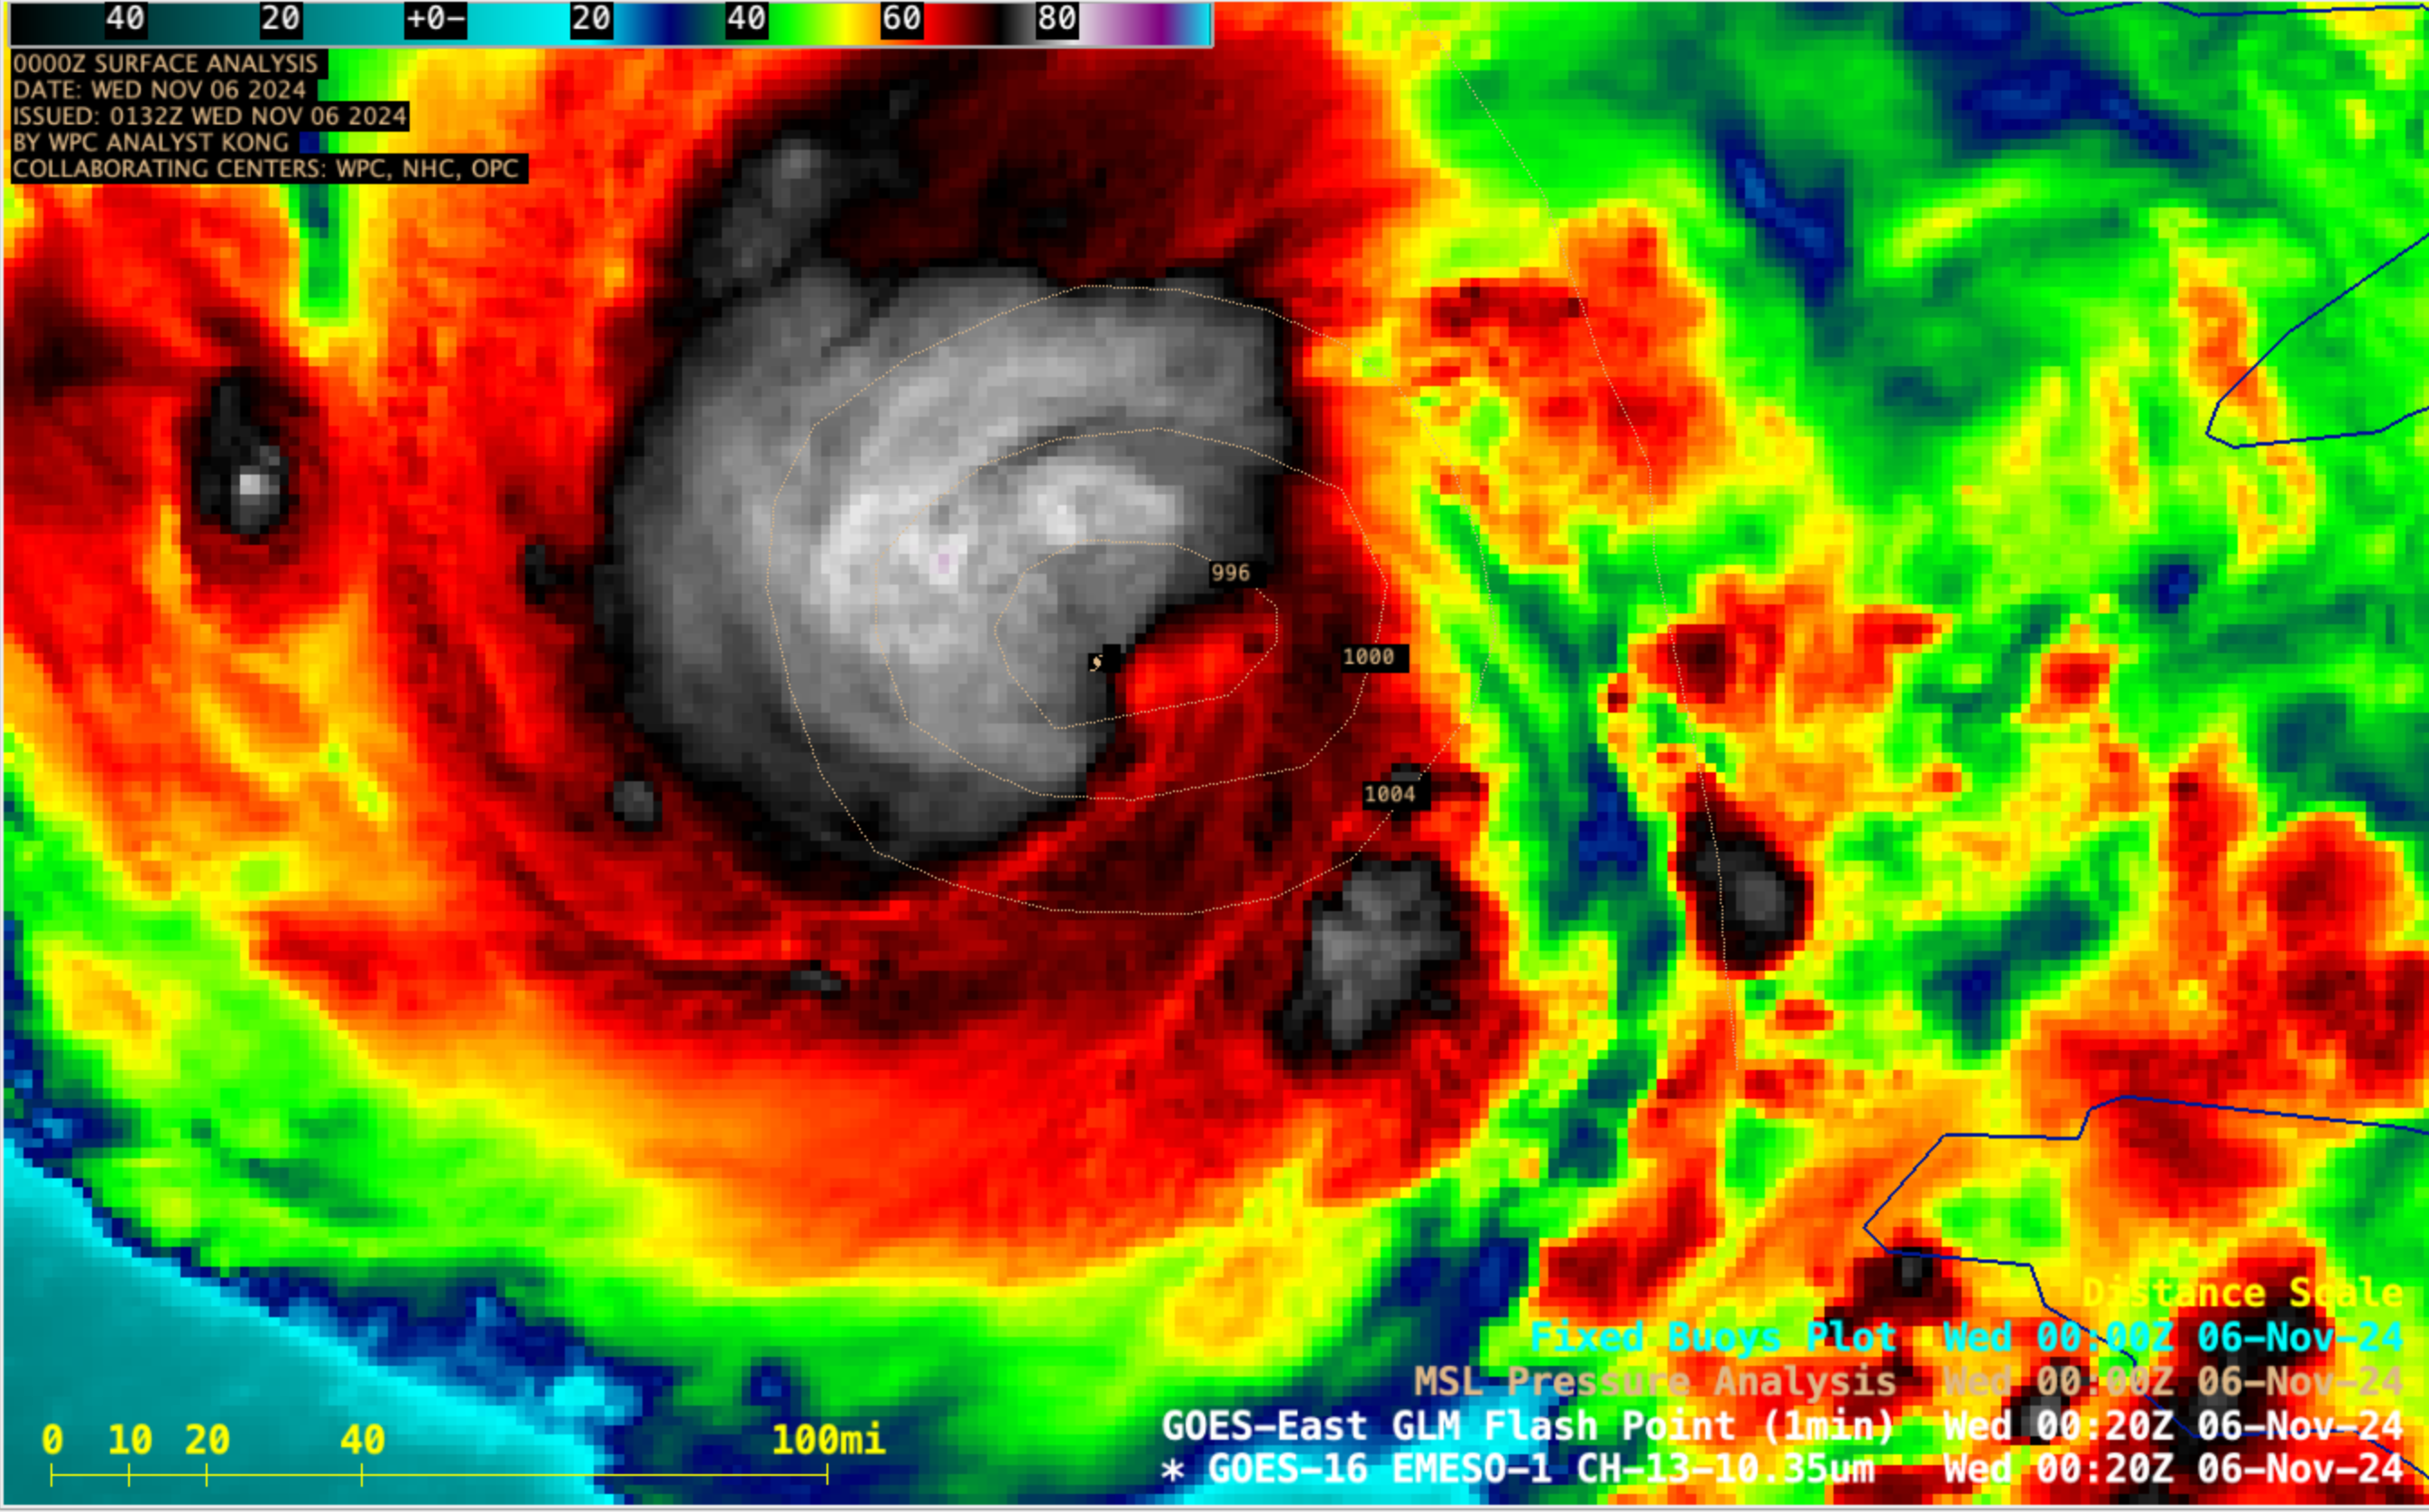
1-minute GOES-16 Infrared images (above) showed Tropical Storm Rafael as it intensified to a Category 1 Hurricane near the Cayman Islands at 0020 UTC on 06 November. Cloud-top infrared brightness temperatures associated with convective bursts near the center of Rafael were as cold as -91ºC; however, no GLM-detected lightning activity was seen with this convection during that 9-hour period.
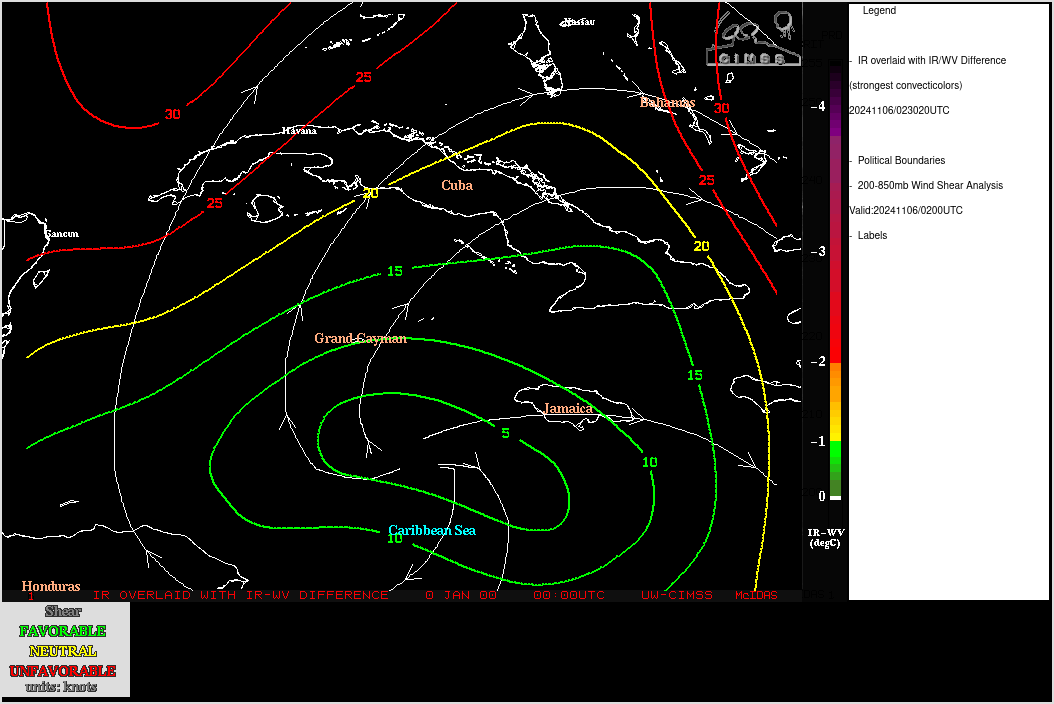
A GOES-16 Infrared/Water Vapor Difference product (below) included an overlay of contours and streamlines of deep-layer wind shear. Rafael continued to remain in an environment of favorably low shear — and tropical overshooting tops that were likely penetrating the local tropopause were highlighted by increasingly negative values of the Infrared/Water Vapor Difference product (reference).
GOES-16 Infrared/Water Vapor Difference product from 2100 UTC on 5 November to 0230 UTC on 6 November, with an overlay of 0200 UTC contours and streamlines of deep-layer wind shear
More information on Rafael is available from the National Hurricane Center. Interests in the northwest Caribbean and in the Gulf of Mexico should monitor the progress of this storm.
View only this post Read Less


