
MODIS 11.0 µm IR + GOES-12 10.7 µm IR + GOES-12 sounder Skin Temperature
Much of the central and southern Florida peninsula experienced temperatures at or below freezing on the morning of 22 January 2009. Surface air temperatures were as cold as 15º F at Archbold in the Tampa NWS County Warning Area (CWA), 16º F at Plymouth in the Melbourne CWA, and 23º F at Palmdale in the Miami CWA. A comparison of AWIPS images of the 1-km resolution MODIS 11.0 µm IR window channel, the 4-km resolution GOES-12 10.7 µm IR window channel, and the 10-km resolution GOES-12 sounder Skin Temperature product (above) showed that IR brightness temperatures and sounder skin temperature values of 32º F and colder (cyan to blue to purple colors) extended well south of Lake Okeechobee at 07:15 UTC (3:15 AM local time). The coldest MODIS IR / GOES-12 IR / GOES-12 Skin Temperature values at that time were -11.5º C (11.3º F) / -9.0º C (15.8º F) / -5.5º C (22.1º F), respectively.
An AWIPS image of the 1-km resolution MODIS Land Surface Temperature (LST) product over central Florida (below) revealed that the coldest LST values of 17.3 º F (purple color enhancement) were found just southwest of Leesburg (station identifier KLEE), along the border of Lake county and Sumter county.
")
MODIS Land Surface Temperature product (central Florida)
The MODIS Land Surface Temperature product over southern Florida (below) showed that LST values of 32º F and colder (darker blue color enhancement) were found as far south as the area east of Naples (station identifier KAPF). Note the relative warmth of Lake Okeechobee, were LST values of 55-56º F (red color enhancement) were seen.
")
MODIS Land Surface Temperature product (southern Florida)
An animation of the GOES-12 10.7 µm IR window imagery (below) showed the southward progression of below-freezing surface IR brightness temperatures during the night-time hours, as well as the warming of the Florida peninsula after sunrise on 22 January.

GOES-12 10.7 µm IR images

GOES-12 water vapor and IR images
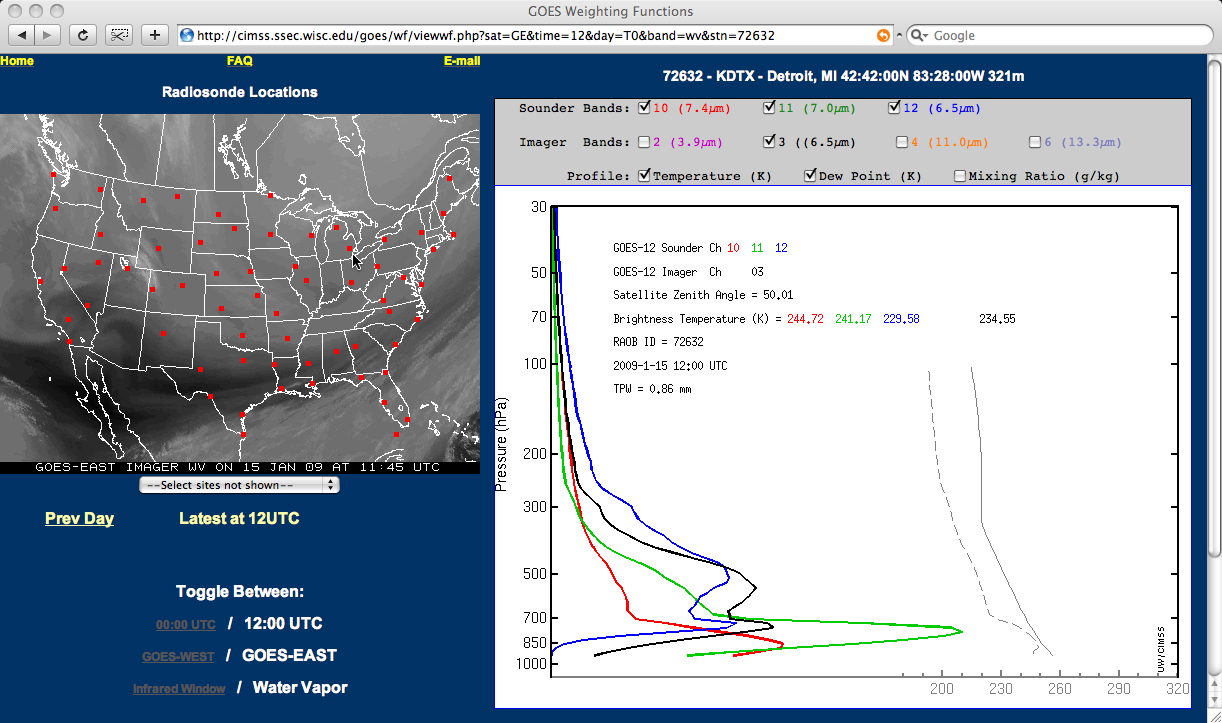
The air mass over Florida was dry enough to allow the 7.4 µm water vapor channel on the GOES-12 sounder to actually sense the surface (above; animation) — in this case, the weighting function (below) for the 7.4 µm water vapor channel (red plot) peaked at a very low altitude, allowing the thermal signal of the contrast between cold land and warm ocean to reach the satellite.
")
GOES-12 weighting functions (calculated using Miami rawinsonde data)
View only this post Read Less


")


