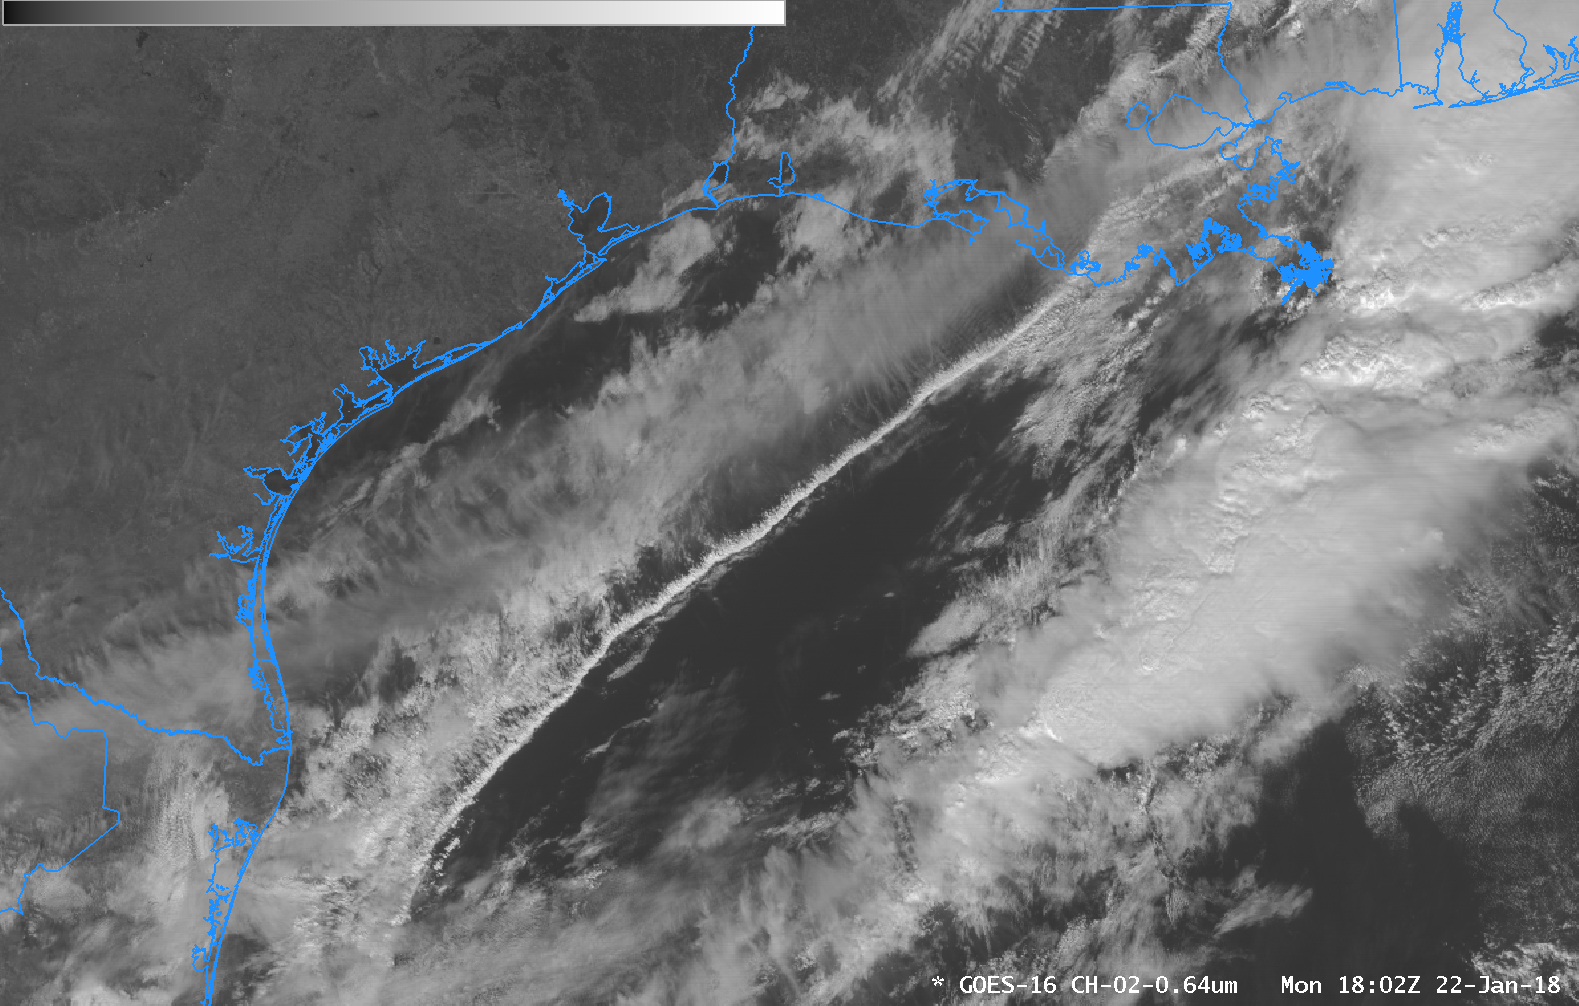
Visible GOES-16 Satellite Imagery over the northeastern Gulf of Mexico on 22 January 2018 showed the development of a Rope Cloud. Such features have been discussed before on the CIMSS Blog — here, here, here and here! Rope Clouds are handy features in satellite analysis over the ocean because they indicate distinctly where the surface cold front exists. Note that the WPC surface analysis, shown here for 1500 UTC, has the front in the same location as the rope cloud, with convection noted out in advance of the surface cold front. The hourly animation below, showing surface observations and the GOES-16 Red Visible (0.64 µm) Imagery, confirms the windshifts that were observed when the Rope Cloud/Cold Front passed any station.
Eruption of the Mayon Volcano in the Philippines
January 22nd, 2018 | Scott BachmeierMulti-spectral retrievals of the Ash Cloud Height (below) indicated that the ash reached altitudes of at least 10 km (dark blue).
A plot of rawinsonde data from nearby Legaspi at 00 UTC on 22 January (below) indicated that the 10 km altitude corresponded to a pressure of 285 hPa. A Suomi NPP VIIRS True-color RGB image from RealEarth (below) revealed some of the lower-altitude ash (shades of tan to brown) drifting toward the west at the satellite overpass time of 0507 UTC. Thermal anomalies — signatures of hot lava flows — are indicated by red dots.Blowing dust in Texas and Oklahoma
January 21st, 2018 | Scott Bachmeier
GOES-16 “Moisture” Infrared brightness temperature difference (10.3-12.3 µm) images, with hourly surface reports plotted in cyan [click to play animation]
GOES-16 “Red” Visible (0.64 µm) and Near-Infrared “Cirrus” (1.37 µm) images (below) also displayed blowing dust signatures; the surface visibility was restricted to 2-3 miles at some locations, with Big Spring briefly reporting only 1/4 mile from 20-21 UTC. The dust signature was apparent on the Cirrus imagery because this spectral band can be used to detect any airborne particles that are effective scatterers of light (such as cirrus ice crystals, volcanic ash, dust/sand or haze).
GOES-16 “Red” Visible (0.64 µm) images, with hourly reports of surface weather plotted in red and surface visibility (miles) plotted in red [click to play animation]
GOES-16 Near-Infrared “Cirrus” (1.37 µm) images, with hourly reports of surface weather plotted in red and surface visibility (miles) plotted in red [click to play animation]
![Terra MODIS Visible (0.65 µm), Cirrus (1.37 µm), Shortwave Infrared (3.7 µm) and Infrared Window (11.0 µm) images, with surface reports plotted in cyan [click to enlarge]](http://cimss.ssec.wisc.edu/satellite-blog/wp-content/uploads/2018/01/180121_1732utc_terra_modis_Visible_Cirrus_ShortwaveInfrared_InfraredWindow_TX_bldn_anim.gif)
Terra MODIS Visible (0.65 µm), Cirrus (1.37 µm), Shortwave Infrared (3.7 µm) and Infrared Window (11.0 µm) images, with surface reports plotted in cyan [click to enlarge]
![Aqua MODIS Visible (0.65 µm), Cirrus (1.37 µm), Shortwave Infrared (3.7 µm) and Infrared Window (11.0 µm) images, with surface reports plotted in cyan [click to enlarge]](http://cimss.ssec.wisc.edu/satellite-blog/wp-content/uploads/2018/01/180121_1912utc_aqua_modis_Visible_Cirrus_ShortwaveInfrared_InfraredWindow_TX_bldn_anim.gif)
Aqua MODIS Visible (0.65 µm), Cirrus (1.37 µm), Shortwave Infrared (3.7 µm) and Infrared Window (11.0 µm) images, with surface reports plotted in cyan [click to enlarge]
Ice dam in Lake Erie
January 19th, 2018 | Scott BachmeierGOES-16 “Red” Visible (0.64 µm) images, with hourly surface wind barbs plotted in yellow and wind gusts (knots) plotted in cyan [click to play animation]
A toggle between 250-meter resolution Terra MODIS True-color and False-color Red-Green-Blue (RGB) images from the MODIS Today site (below) provided a more detailed view of the Lake Erie ice dam and upwind drift ice at 1615 UTC. Snow and ice appear as shades of cyan in the False-color image, in contrast to supercooled water droplet clouds which are shades of white.
![Terra MODIS True-color and False-color RGB images [click to enlarge]](http://cimss.ssec.wisc.edu/satellite-blog/wp-content/uploads/2018/01/180119_1615utc_terra_modis_truecolor_falsecolor_anim.gif)
Terra MODIS True-color and False-color RGB images; red arrows denote the location of the ice dam [click to enlarge]