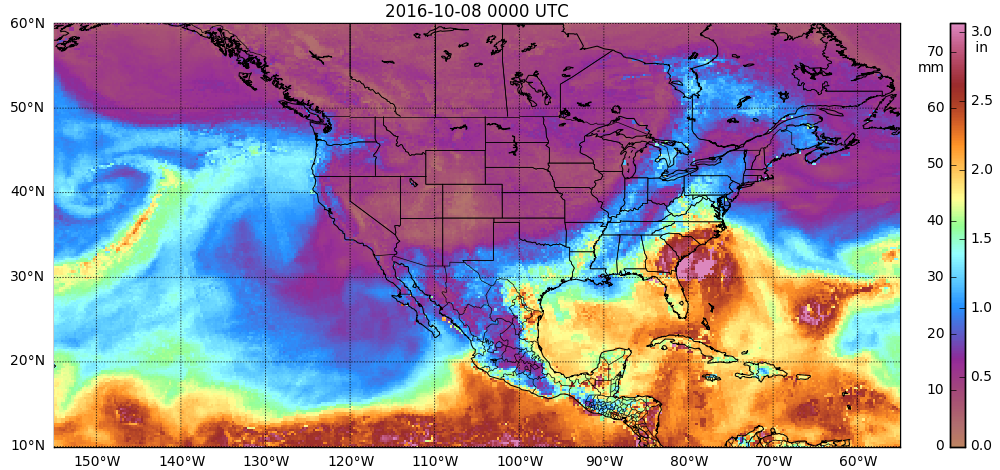
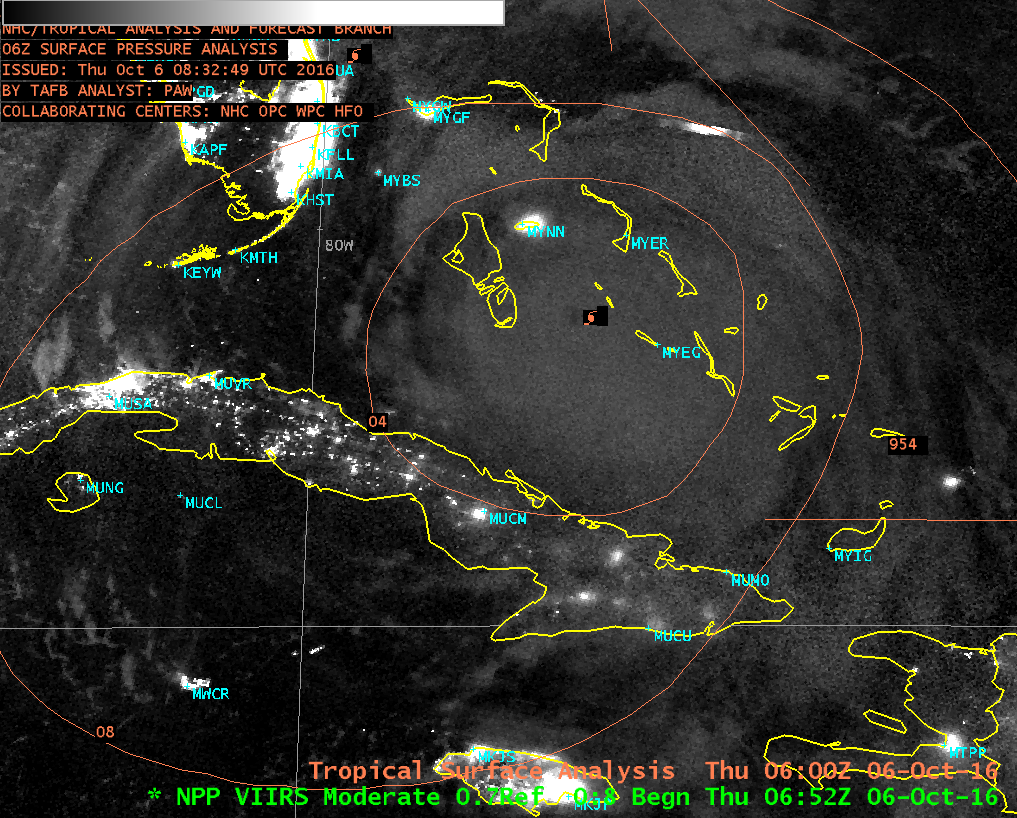
Hurricane Nicole
October 13th, 2016 | Scott BachmeierHurricane Matthew: heavy rainfall and flooding across the Southeast and Mid-Atlantic US
October 9th, 2016 | Scott Bachmeier![MIMIC Total Precipitable Water product, from 06 October/04 UTC to 08 October/16 UTC [click to play MP4 animation]](http://cimss.ssec.wisc.edu/satellite-blog/wp-content/uploads/2016/10/comp20161008.000000_tpw.png)
MIMIC Total Precipitable Water product, from 06 October/04 UTC to 08 October/16 UTC [click to play MP4 animation]
Matthew set numerous records for intensity, longevity, and landfall (summary) — an animation of hourly GOES-13 Water Vapor (6.5 µm) images covering the 11-day period from 12 UTC on 28 September to 12 UTC on 09 October is shown below (also available as a large 113 Mbyte animated GIF). The CIMSS Tropical Cyclones site posted GOES-13 Visible (0.63 µm) animations from the individual days of 03 October, 04 October, 05 October, 06 October, 07 October, and 08 October.
The combination of high winds and flooding led to widespread power outages, with over 2 million homes and businesses without power. A comparison of nighttime Suomi NPP VIIRS Day/Night Band (0.7 µm) images from 28 September (before Mattthew arrived) and 09/10 October (after the passage of Matthew) showed a notable reduction in the glow of city lights in areas with no power (below; images courtesy of William Straka, SSEC). Note that the presence of patchy clouds on all 3 images tended to diffuse or even obscure the appearance of city lights below, depending on the thickness of the cloud layer(s).![Suomi NPP VIIRS Day/Night Band (0.7 µm) images on 28 September, 09 October and 10 October [click to enlarge]](http://cimss.ssec.wisc.edu/satellite-blog/wp-content/uploads/2016/10/160928_161009_161010_suomi_npp_viirs_Day_Night_Band_Southeast_US_power_outages_Hurricane_Matthew_anim.gif)
Suomi NPP VIIRS Day/Night Band (0.7 µm) images on 28 September, 09 October and 10 October [click to enlarge]

JPSS River Flood product produced with Suomi NPP data, 1817 UTC on 11 October 2016 (Click to enlarge)
A sequence of 1 pre-Matthew (06 September) and 3 post-Matthew (09, 10 and 12 October) Terra/Aqua MODIS false-color RGB images from the SSEC MODIS Today site (below) also helped to highlight areas of flooding (darker shades of blue, especially notable along river valleys) that resulted from the heavy rainfall.
Matthew along the east coast of Florida
October 7th, 2016 | Scott LindstromHurricane Matthew is on a path that parallels the coast of Florida, with the center remaining just offshore. GOES-13 Visible imagery from a 1-hour time period this morning, above, shows the continued development of convection around the eyewall and the motion of convective bands inland. GOES-13 Visible images with hourly surface winds and wind gusts (in knots) are shown below. The highest wind gust recorded along the central Florida coast was 107 mph (NWS Melbourne PNS).
GOES-13 Visible (0.63 um) images, with hourly surface winds and gusts in knots [Click to play animation]

Morphed Microwave Imagery of Matthew showing Strongest Convection, 1200 UTC 06 October to 1100 UTC 07 October 2016 (Click to enlarge)
Infrared imagery from GOES-13, below, also shows the coldest cloud tops to the east of the eye (indicated by the arrow in the image).
GOES-13 Infrared (10.7 µm) Imagery, 1355 UTC. The flashing arrow points to Matthew’s eye (Click to enlarge)
A longer animation of GOES-13 Infrared Window (10.7 um) images with hourly surface winds and wind gusts (in knots) is shown below (MP4 | animated GIF).
A toggle between Suomi NPP VIIRS Visible (0.64 um) and Infrared Window (11.45 um) images at 1751 UTC is shown below; Matthew was a Category 3 hurricane at that time.Hurricane Matthew southeast of Florida
October 6th, 2016 | Scott LindstromHurricane Matthew moved through the Bahamas overnight, slowly organizing and strengthening to Category 4 intensity after its interaction with the high terrain of the Greater Antilles (Note that Day/Night Band Imagery from overnight on 6 October — from this Blog Post — shows that city lights are back on in Port-au-Prince Haiti as recovery proceeds in that country). The three images above show the evolution of the storm from 0345 UTC to 1145 UTC on 6 October. A warm eye is present, but it is not a cloud-free eye.
The GOES-13 satellite continued to be in Rapid Scan Operations (RSO) mode, providing images as frequently as every 5-7 minutes. An animation of Infrared Window (10.7 µm) imagery is shown below (MP4 | animated GIF). Nassau, Bahamas (station identifier MYNN) experienced a wind gust of 74 knots at 13 UTC.
A higher-resolution view of the eye was provided by a Suomi NPP VIIRS Infrared Window (11.45 µm) image at 0645 UTC, below. GOES-13 Visible Imagery from early in the morning on 6 October, below (MP4 | animated GIF), confirms the diagnosis of a cloudy eye. The center of the storm is moving northwestward between Andros Island to the west and New Providence Island to the east (Nassau, the capitol of the Bahamas, is on New Providence Island).Matthew is forecast to reach the coast of Florida within 24 hours. For the latest information, consult the website of the National Hurricane Center. Additional information is available here.