

Pacific Hurricane Fausto Continues Westward Trek
Earlier this week, we discussed the development of Fausto, a Pacific tropical system that formed south of Mexico. As expected, the storm has intensified to hurricane strength. Current projections (as of 1500 UTC, 5:00 AM HST) are for it to pass directly over the Hawaiian islands on Tuesday 28 July into Wednesday 29 July. Fortunately, the forecasts show the system weakening to a tropical storm before it reaches Hawaii, but the potential impacts for such a system are still quite significant given the potential for heavy rainfall. Here’s the most recent cone plot from the National Hurricane Center depicting Fausto’s expected track over the next five days.

The GOES-18 (GOES West) Band 13 infrared window imagery shows how Fausto has organized since the Blog last looked at it a few days ago. On Monday the 20th, it had a well-defined circulation but no eye was present in the infrared and even in the microwave it was somewhat challenging to identify exactly where the circulation was centered. Here on Friday 24 August, that’s no longer the case, as can be seen in the loop below.

If we take a close look at that loop, we seen that the eye is a little ragged and irregular. Compare this to when Bavi was at its greatest strength two weeks ago: its eye was almost perfectly symmetric. The strong correlation between hurricane form and its intensity is the heart of the Dvorak Technique for tropical cyclone intensity estimation. CIMSS has been a pioneer in developing automated methods of obtaining cyclone strength from satellites. The Advanced Dvorak Technique (ADT) assesses key parameters of the cyclone from infrared satellite imagery and thus can produce a continuous time series of cyclone intensity so long as there’s an accurate assessment of the position of the center of circulation. Here’s a time series of Fausto’s strength as calculated by ADT. Based on this, Fausto was a borderline Cat 2/Cat 3 event in during teh time shown in the above animation.

Since the development of ADT, CIMSS has continued to develop more advanced methods of retrieving tropical cyclone intensity from satellite observations. The D-MINT product is a deep learning algorithm that combines geostationary satellite data with microwave imagers and sounders from polar-orbiting satellites. Because it relies on the more temporally-infrequent microwave observations it doesn’t have the temporal continuity of ADT, but the enhanced inputs can contribute to a more accurate and reliable estimate, and each observation has an associated uncertainty with it. Here’s the D-MINT time series for Fausto.

With many different automated methods for cyclone strength estimation, it is convenient to see these methods together. The CIMSS SATCON product takes estimates from several different sources and produces a weighted average consensus value. Here, we see a consensus of around 95 knots as of the most recent estimates.

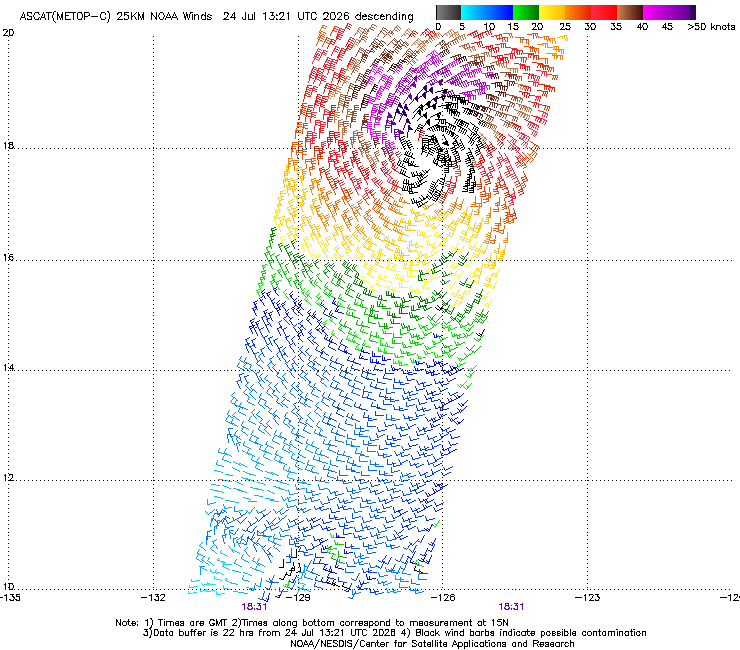
Scatterometry and synthetic aperture radars also provide compelling views of the structure of tropical cyclones. The wide spacing of the scatterometer swaths in the tropics can sometimes prove frustrating as the center of a cyclone can frequently be in the gaps. However, the most recent MetOp-C ASCAT scatterometer overpass was dead on and captured the wind structure perfectly. Note that the observed wind speed tops out at 50 kts, much lower than the automated wind speed estimates described above. This is a limit of the instrument itself and thus we cannot rely on it for exact measurements of wind speed within the core of a tropical storm. However, it is still quite valuable to see the overall distribution of winds and the general flow patterns around the center of circulation.
Synthetic aperture radar (SAR) winds can provide much more detail on the wind speed of a tropical system, with higher maximum values and much higher spatial resolution than the ASCAT method seen above. Below is a plot we see courtesy of NOAA STAR. Here we see winds approaching 100 kts on the north side of the eye. This provides an excellent depiction of somethingwe expect: in the northern Hemisphere, winds on the right side of the eye relative to the direction of motion are faster than those on the left side. This is because the winds on the right side are abetted by the motion of the storm itself while those on the south side are counteracted by storm motion. Note that the SAR product doesn’t directly show wind direction; the SAR technique can only be used for the magnitude of the wind, not its direction. The STAR plot embeds modeled wind vectors to bring context about wind direction to the plot.

Current forecasts show that Fausto is near its peak intensity and weakening is expected over the next few days. Some additional notes from the National Hurricane Center said in its 5:00 AM HST (1500 UTC) discussion:
However, it is worth noting that the guidance has
struggled to capture the trends in Fausto's intensity over the past
few days.  Nonetheless, decreasing water temperatures and drier air
should cause the cyclone to gradually lose strength, and an increase
in westerly vertical wind shear early next week will likely aid in
that weakening trend.  The NHC intensity forecast lies near the
middle of the guidance envelope, and shows steady weakening through
the period.  There is relatively high confidence that Fausto will be
a tropical storm when it is in the vicinity of the Hawaiian Islands.