Elevated Optical Depth from Two Very Different Sources
The GOES-19 view of the Northern Hemisphere on the morning of 3 June 2025 showed enhanced aerosol optical depth (AOD) across much of its domain. Large regions of elevated AOD are ceen in the eastern half of the continental United States extending out into the western Atlantic Ocean, while the eastern Atlantic, especially off the coast of north Africa, also shows very high AOD levels. However, the causes of these regions of high aerosol content are very different, and satellites can be used to discern just how these regions differ.

First, a word about AOD observations from satellite. The AOD is calculated using multiple wavelengths between 0.4 and 2.25 microns. In essence, the clear-sky reflectance that a satellite expects to see based on time of day, sun angle, and the like is calculated for several different AODs. Changing the amount of aerosols in the sky impacts the amount of reflectance, and the satellite observations of reflectance are compared to the simulated counterparts. The simulation with the best match represents the observed AOD. Since this product depends on visible and near-infrared wavelengths, it is only available during daylight hours. Furthermore, solar glint can dramatically impact the assumed and calculated reflectance values; as a result, a circle of excluded values is clearly present in the above image. You can easily monitor AOD values from the CSPP Geosphere site.
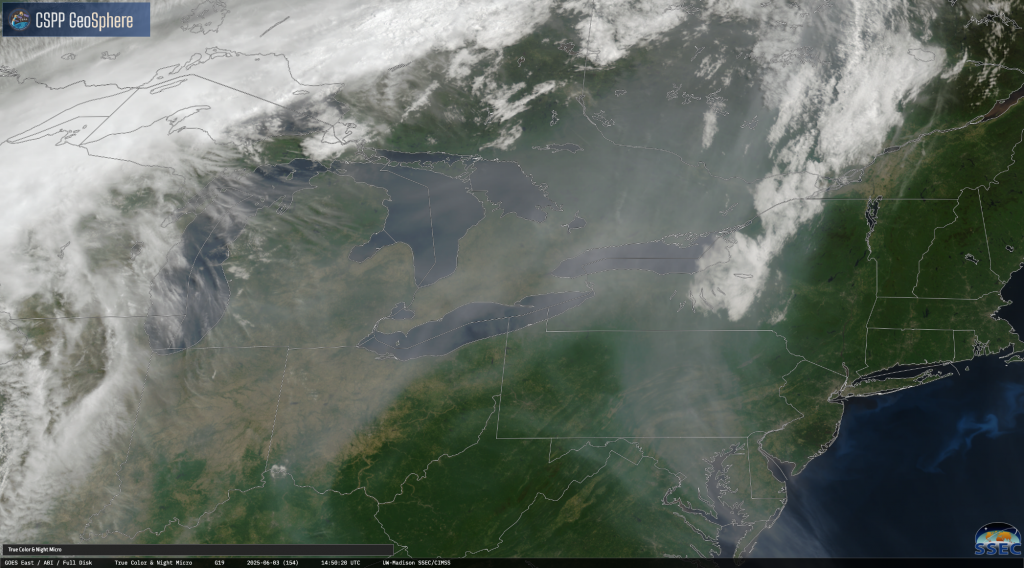
As frequent readers of the Blog know, wildfires in south-central Canada are having a significant impact on the air quality in the eastern continental United States. However, the local impacts of the smoke have been highly variable. NOAA’s High Resolution Rapid Refresh (HRRR) model can be run in a smoke mode that identifies locations and predicts the trajectories of smoke in three dimensions. For example, the GOES-19 true color view over the lower peninsula of Michigan and southern Ontario clearly shows the strong presence of smoke.
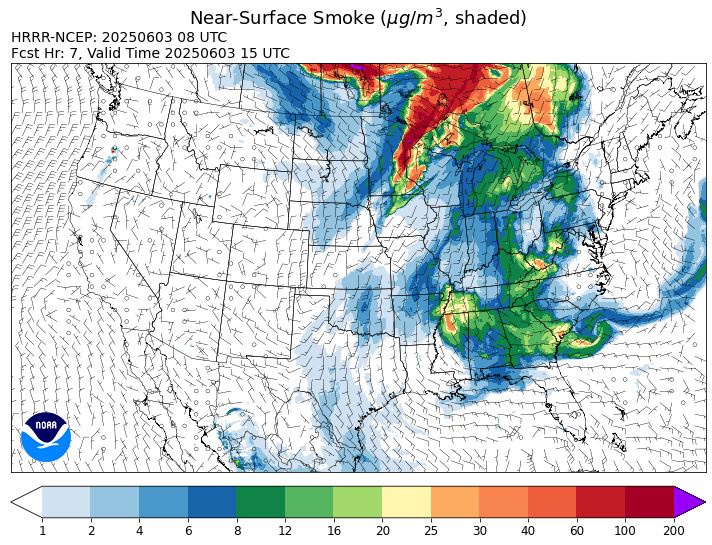
The vertically integrated smoke product from HRRR quantifies the total column smoke content. The model clearly captures the extent of the smoke, with some of the highest concentrations found in this Michigan/Ontario region.

However, surface visibilities aren’t that strongly impacted in this region. The ASOS observation for Detroit Wayne County International Airport at 1500 UTC (11:00 AM) indicated that visibility was 9 miles. Since the visibility sensors only observe a maximum of 10 miles, this meant that the visibility was only slightly affected relative to normal. It turns out that the people of this area were relatively lucky: a lack of mixing meant that the smoke remained lofted and that local air quality was largely unaffected. The HRRR smoke forecast of surface level reflects this.
By contrast, Duluth, Minnesota, on the western tip of Lake Superior, is located at the heart of the band of elevated near-surface smoke. Its ASOS observation at the same time confirms this, with visibility only 3 miles.
As noted above, the the continental US and western Atlantic aren’t the only places where GOES-19 is viewing high aerosol loads. The eastern Atlantic adjacent to Africa is also registering high values. However, instead of smoke, this is caused by Saharan Dust being blown out to sea. Given that this is on the extreme edge of the GOES-19 field of view, the pixels can appear somewhat distorted when remapped.
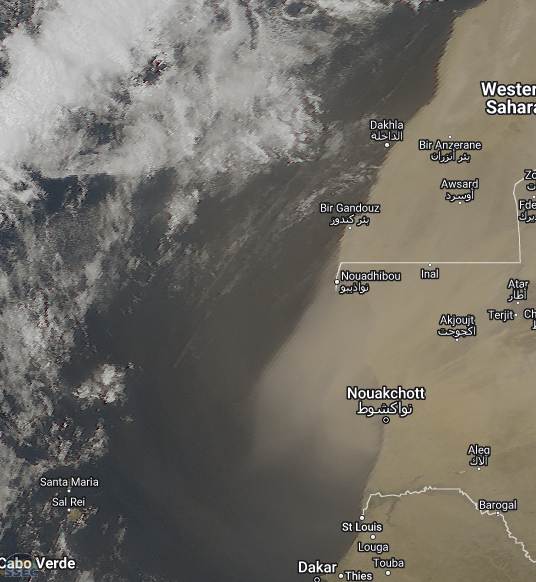
However, when viewed by the Flexible Combined Imager (FCI) instrument aboard EUMETSAT’s now-operational Meteosat-12 satellite, the structure of the dust becomes much more clear. With a deployment over 0 degrees of longitude, Meteosat-12 is well-situated to capture events in Africa, and this dust protrusion is no exception.

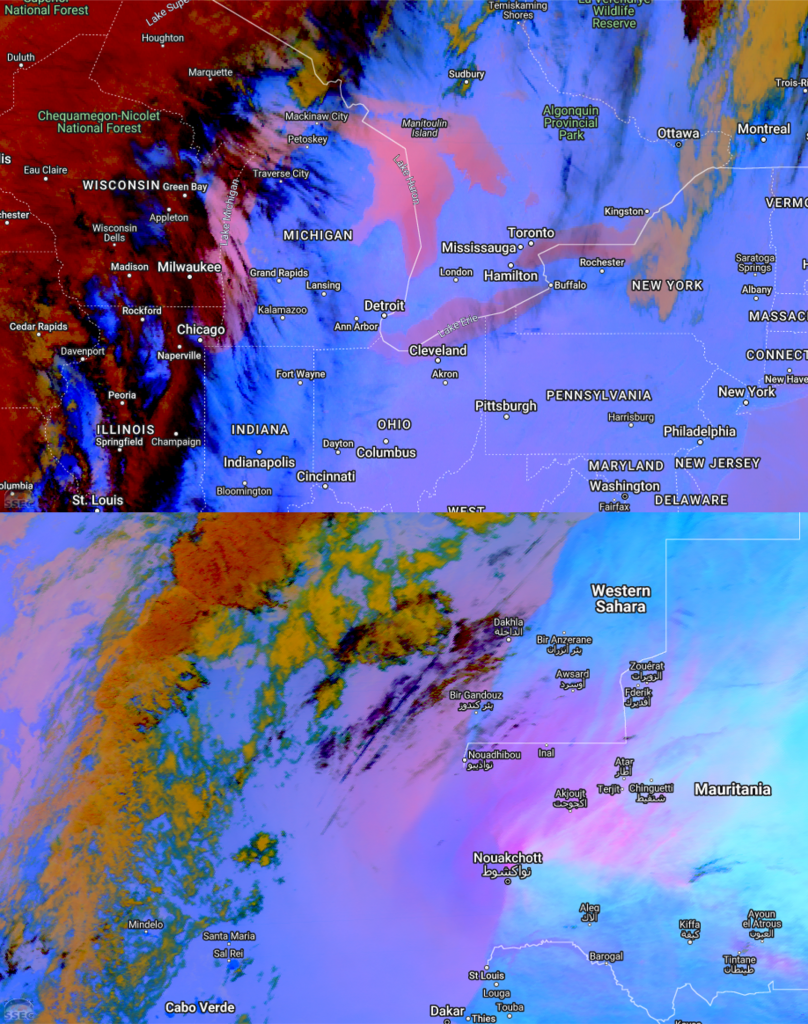
We can examine the differences in the Dust RGB (quick guide here) between North America and Africa to see if there’s any insight we can glean from the radiative perspective. The North American image (top panel) does not seem to show much signal at all. The Great Lakes appear to be salmon colored, largely a function of cloud free skies and relatively cool lake surface temperatures. By contrast, the dust over Mauritania appears as a bright fuchsia color, since dust exhibits large 12.3–10.3 differences and the underlying surface is warm.