Tropical Cyclone Kirrily in the Coral Sea
2.5-minute JMA Himawari-9 Red Visible (0.64 µm, top) and Clean Infrared Window (10.4 µm, bottom) images, from 2102 UTC on 23 January to 0742 UTC on 24 January [click to play animated GIF | MP4]
Himawari-9 Infrared Window (11.2 µm) images from the CIMSS Tropical Cyclones site (below) showed that Tropical Cyclone Kirrily was moving through an environment of low deep-layer wind shear (in contrast to the high values of shear that were affecting Invest 90P on 20 January).
JMA Himawari-9 Infrared Window (11.2 µm) images, with contours and streamlines of deep-layer wind shear at 0000 UTC on 24 January [click to enlarge]
===== 25 January Update ====
2.5-minute JMA Himawari-9 Red Visible (0.64 µm, top) and Clean Infrared Window (10.4 µm, bottom) images, from 0302 UTC to 1312 UTC on 25 January [click to play animated GIF | MP4]
A plot of surface report data from Townsville (below) depicted a pressure minimum from 1120-1200 UTC (during landfall), with a maximum wind gust of 50 kts at 0942 UTC (prior to landfall).
Plot of surface report data from Townsville [click to enlarge]
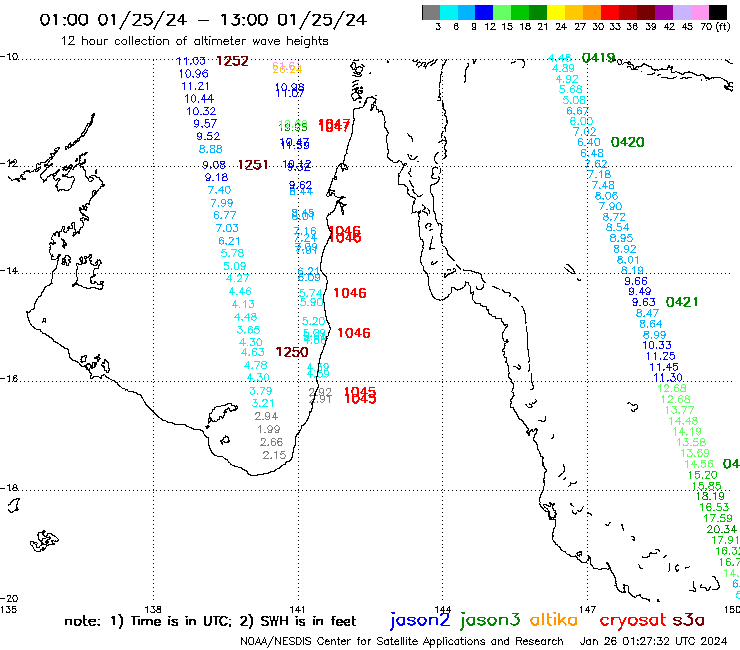
Jason-3 altimeter Significant Wave Heights at 0421 UTC
Around the time of landfall, ASCAT winds from Metop-B and Metop-C (below) were in the 40-50 knot range near the coast.
ASCAT winds from Metop-C at 1125 UTC and Metop-B at 1211 UTC
A toggle between daytime (pre-landfall) and nighttime (post-landfall) Suomi-NPP VIIRS Day/Night Band (0.7 µm) images is shown below.
Suomi-NPP VIIRS Day/Night Band (0.7 µm) images, before and after the landfall of Cyclone Kirrily [click to enlarge]