Blowing dust across the Canary Islands and Atlantic Ocean
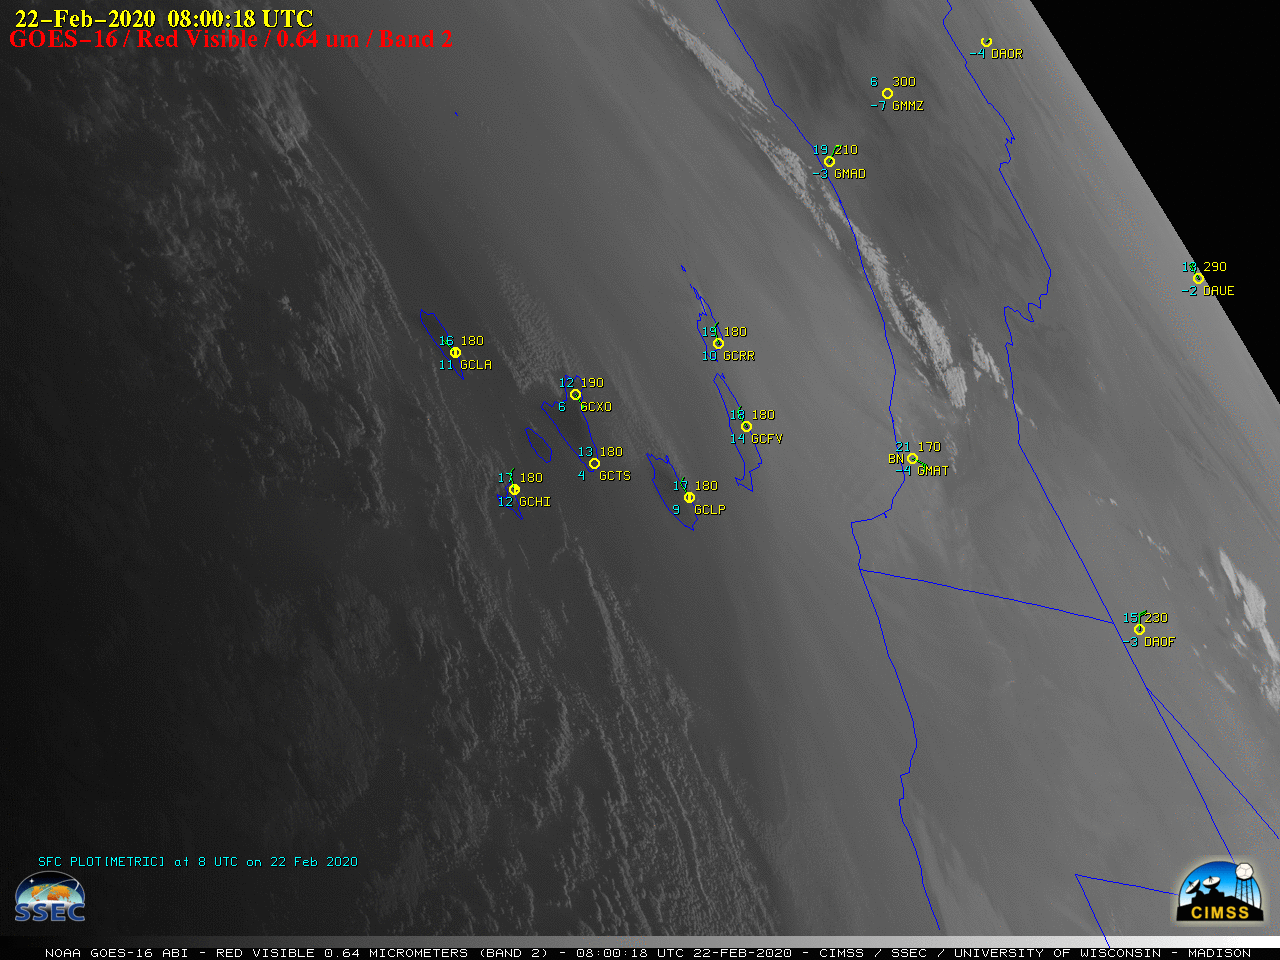
GOES-16 “Red” Visible (0.64 µm) images, with plots of hourly surface reports [click to play animation | MP4]
GOES-16 Dust Red-Green-Blue (RGB) images spanning the period 0800 UTC on 22 February to 2100 UTC on 23 February (below) provided a continuous day/night visualization of the first dust plume (shades of pink/magenta). During the day on 23 February, a second dust plume could be seen emerging from below a patch of mid/high-altitude clouds. The RGB images were created using Geo2Grid.
![GOES-16 Dust RGB images [click to play animation | MP4]](https://cimss.ssec.wisc.edu/satellite-blog/images/2020/02/200222_200223_goes16_dustRGB_Canary_Islands_anim.gif)
GOES-16 Dust RGB images [click to play animation | MP4]
![VIIRS True Color RGB images from Suomi NPP and NOAA-20 [click to enlarge]](https://cimss.ssec.wisc.edu/satellite-blog/images/2020/02/200222_200223_suomiNPP_noaa20_viirs_trueColorRGB_Canary_Islands_anim.gif)
VIIRS True Color RGB images from Suomi NPP and NOAA-20 [click to enlarge]
![925 hPa wind speed anomaly during the period 00 UTC on 22 February to 00 UTC on 24 February [click to enlarge]](https://cimss.ssec.wisc.edu/satellite-blog/images/2020/02/200222_200223_925hPa_windSpeedAnomaly_anim.gif)
925 hPa wind speed anomaly during the period 00 UTC on 22 February to 00 UTC on 24 February [click to enlarge]
===== 24 February Update =====
![GOES-16 Dust RGB images [click to play animation | MP4]](https://cimss.ssec.wisc.edu/satellite-blog/images/2020/02/200224_goes16_dustRGB_Canary_Islands_anim.gif)
GOES-16 Dust RGB images [click to play animation | MP4]
In addition to the Dust RGB, signatures of the airborne sand/dust were also evident in GOES-16 Split Window Difference (10.3-12.3 µm) and Split Cloud Top Phase (11.2-8.4 µm) imagery (below). This arises from the fact that silicates (sand/dust particles) have different energy absorption characteristics at varying wavelengths.
![GOES-16 Dust RGB, Split Window Difference (10.3-12.3 µm) and Split Cloud Top Phase (11.2-8.4 µm) [click to play animation | MP4]](https://cimss.ssec.wisc.edu/satellite-blog/images/2020/02/200224_goes16_dustRGB_splitWindowDifference_splitCloudTopPhase_anim.gif)
GOES-16 Dust RGB, Split Window Difference (10.3-12.3 µm) and Split Cloud Top Phase (11.2-8.4 µm) images [click to play animation | MP4]
![Panel 1: TROPOMI Aerosol Index Panel 2: TROPOMI Aerosol layer height (meters) Panel 3: Meteosat-11 Natural Color RGB Panel 4: Meteosat-11 Dust RGB [click to enlarge]](https://cimss.ssec.wisc.edu/satellite-blog/images/2020/02/AfricaDustTropomiMsg022420.jpg)
TROPOMI Aerosol Index (top left), TROPOMI Aerosol layer height in meters (top right), Meteosat-11 Natural Color RGB (bottom left) and Meteosat-11 Dust RGB (bottom right) [click to enlarge]
![GOES-16 Split Window Difference image, with plots of available NUCAPS profile points [click to enlarge]](https://cimss.ssec.wisc.edu/satellite-blog/images/2020/02/dust_swd_nucaps-20200224_160018.png)
GOES-16 Split Window Difference (10.3-12.3 µm) image, with plots of available NUCAPS profile points [click to enlarge]
![Profiles of NUCAPS temperature and dew point data for Points 1-9 [click to enlarge]](https://cimss.ssec.wisc.edu/satellite-blog/images/2020/02/200224_nucaps_profiles_dust_anim.gif)
Profiles of NUCAPS temperature and dew point data for Points 1-9 [click to enlarge]