Bomb cyclone makes landfall along the Oregon/California coast
![GOES-17 Low-level (7.3 µm), Mid-level (6.9 µm) and Upper-level (6.2 µm) Water Vapor images, with 3-hourly plots of surface fronts [click to play animation | MP4]](https://cimss.ssec.wisc.edu/satellite-blog/wp-content/uploads/sites/5/2019/11/191126_goes17_waterVapor_PacNW_anim.gif)
GOES-17 Low-level (7.3 µm), Mid-level (6.9 µm) and Upper-level (6.2 µm) Water Vapor images, with surface fronts plotted in cyan and buoy locations plotted in red [click to play animation | MP4]
GOES-17 “Red” Visible (0.64 µm) images of the storm are shown below — the Mean Sea Level Pressure anomaly was 4-5 sigma below the climatological mean as the rapidly-deepening midlatitude cyclone made landfall. Similarly, 925 hPa wind speed anomaly was 3-5 sigma above the climatological mean. The system had transitioned to a warm seclusion phase by 00 UTC, as seen in a comparison of Visible and Water Vapor images at that time.
![GOES-17 "Red" Visible (0.64 µm) images, with 3-hourly plots of surface fronts [click to play animation | MP4]](https://cimss.ssec.wisc.edu/satellite-blog/wp-content/uploads/sites/5/2019/11/191126_goes17_visible_PacNW_anim.gif)
GOES-17 “Red” Visible (0.64 µm) images, with surface fronts plotted in cyan and buoy locations plotted in red [click to play animation | MP4]

GOES-17 “Red” Visible (0.64 µm) images, with hourly plots of surface wind barbs and gusts in knots [click to play animation | MP4]
![GOES-17 "Red" Visible (0.64 µm) images [click to play animation | MP4]](https://cimss.ssec.wisc.edu/satellite-blog/wp-content/uploads/sites/5/2019/11/191126_goes17_visible_1minute_PacNW_anim.gif)
GOES-17 “Red” Visible (0.64 µm) images [click to play animation | MP4]
![NOAA-15 AVHRR Shortwave Infrared (3.7 µm) image at 0217 UTC [click to enlarge]](https://cimss.ssec.wisc.edu/satellite-blog/wp-content/uploads/sites/5/2019/11/191127_0217utc_noaa15_shortwaveInfrared_observations_windGusts_OR_CA_anim.gif)
NOAA-15 AVHRR Shortwave Infrared (3.7 µm) image at 0217 UTC, with plots of 02 UTC surface reports (cyan/yellow) and wind gusts (in knots, red) [click to enlarge]
![Time series of surface data at Crescent City, California [click to enlarge]](https://cimss.ssec.wisc.edu/satellite-blog/wp-content/uploads/sites/5/2019/11/191126_KCEC_SFCMG.GIF)
Time series of surface data at Crescent City, California [click to enlarge]
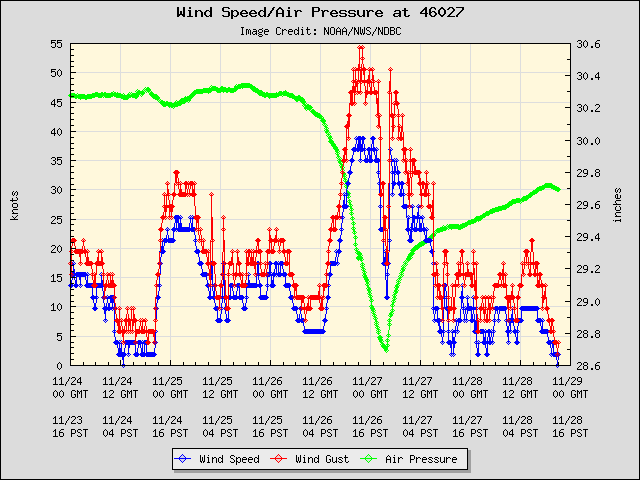
Plots of Wind Speed (blue), Wind Gust (red) and Air Pressure (green) from Buoy 46027
The OR/CA storm peaked pressure-wise with a central pressure of 970 hPa/28.64″ at 7 pm PST before slowly weakening. Here are its impacts thus far: pic.twitter.com/U4uHH0CBVW
— NWS WPC (@NWSWPC) November 27, 2019
Advanced Scatterometer (ASCAT) passes returned widespread #gale (yellow) and #storm (dark brown) force winds, w/highest #hurricane force retrievals to 75 kt southwest of the low center (brightest reds)! Animation overlays the satellite sensed winds atop visible imagery #MarineWx pic.twitter.com/HDVQgQgwor
— NWS OPC (@NWSOPC) November 26, 2019