Unusual early ice loss in the Bering Sea
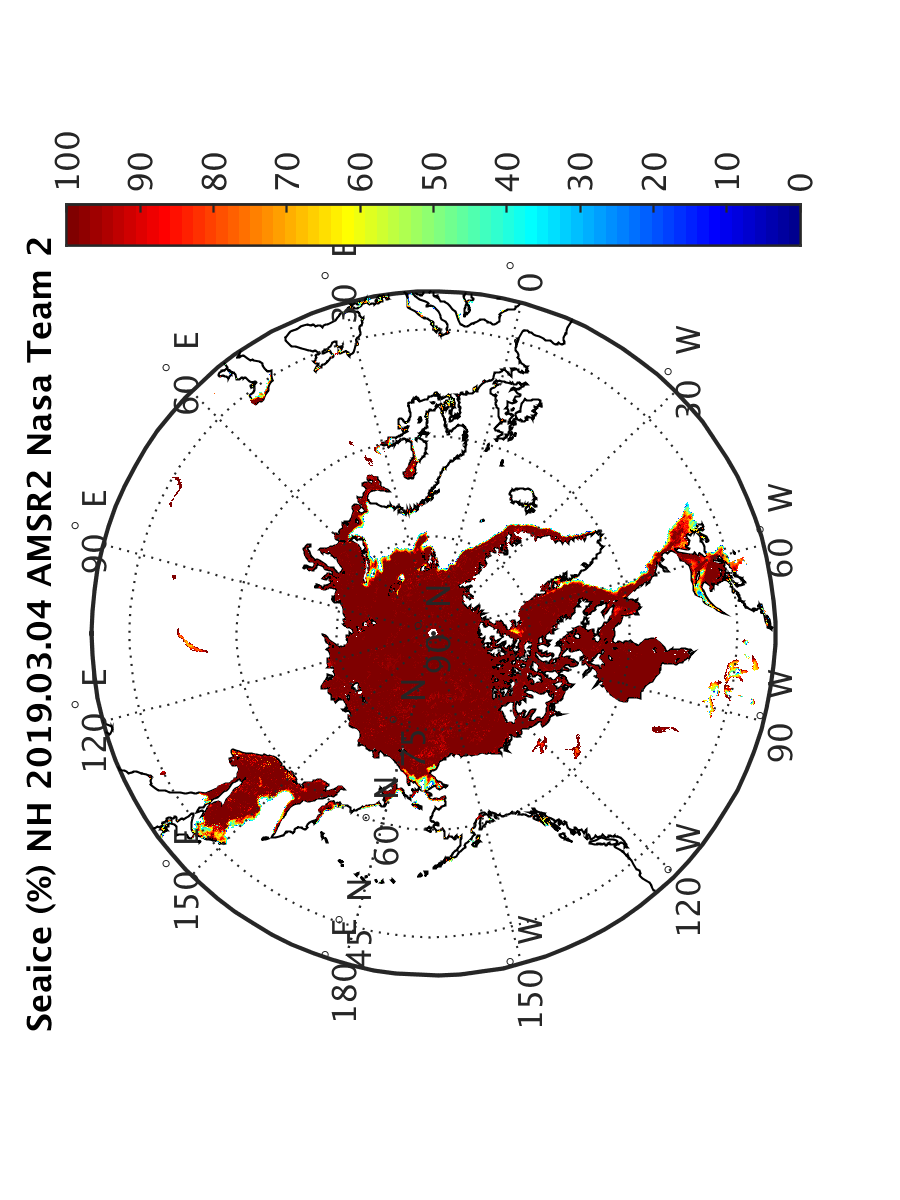
![GCOM-W2 AMSR2 Sea Ice Concentration, 01 February - 09 March 2019 [click to play animation | MP4]](https://cimss.ssec.wisc.edu/satellite-blog/wp-content/uploads/sites/5/2019/03/190201_190309_gcomw2_amsr2_seaIceConcentration_anim.gif)
GCOM-W1 AMSR2 Sea Ice Concentration, 01 February – 09 March 2019 [click to play animation | MP4]
Minimal cloudiness on 28 February allowed the northward flow of ice through the Bering Strait to be seen on GOES-17 (GOES-West) “Red” Visible (0.64 µm) images (below).
GOES-17 “Red” Visible (0.64 µm) images [click to play animation | MP4]
Bering Sea ice extent for Mar 02 from @NSIDC data (210000 km²) is the lowest daily #seaice extent of record for the entire month of March & only 29% of 1981-2010 average. Previous lowest 214000 km² on Mar 09, 2018. #Arctic #akwx @Climatologist49 @ZLabe @YJRosen @ArcticResearch pic.twitter.com/IzjwGXELCL
— Rick Thoman (@AlaskaWx) March 3, 2019
Sea ice in the Bering Sea began the month of February with a near record low extent, and then near record southerly winds blew from a region of much above normal SSTs. On the left panel, red is southerly winds > +2.5 std. dev. above average. @AlaskaWx @IARC_Alaska pic.twitter.com/cUh6CdQqhd
— Brian Brettschneider (@Climatologist49) March 8, 2019