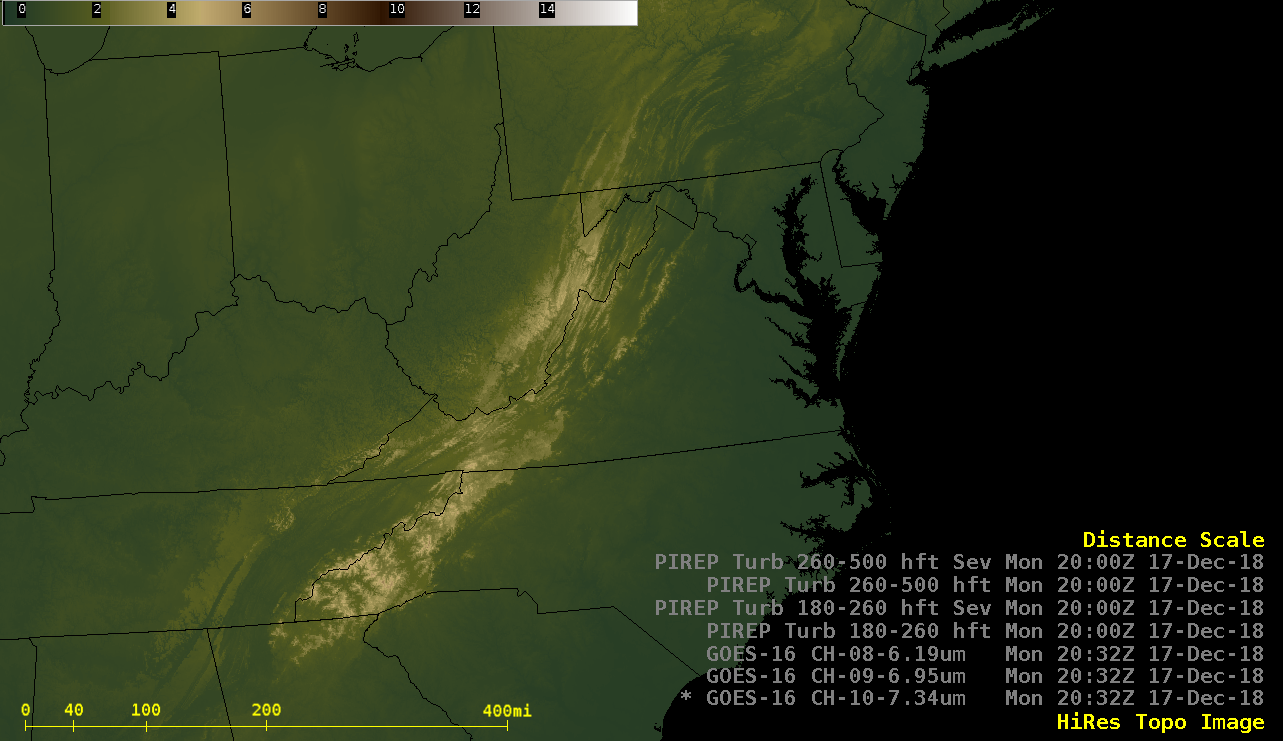
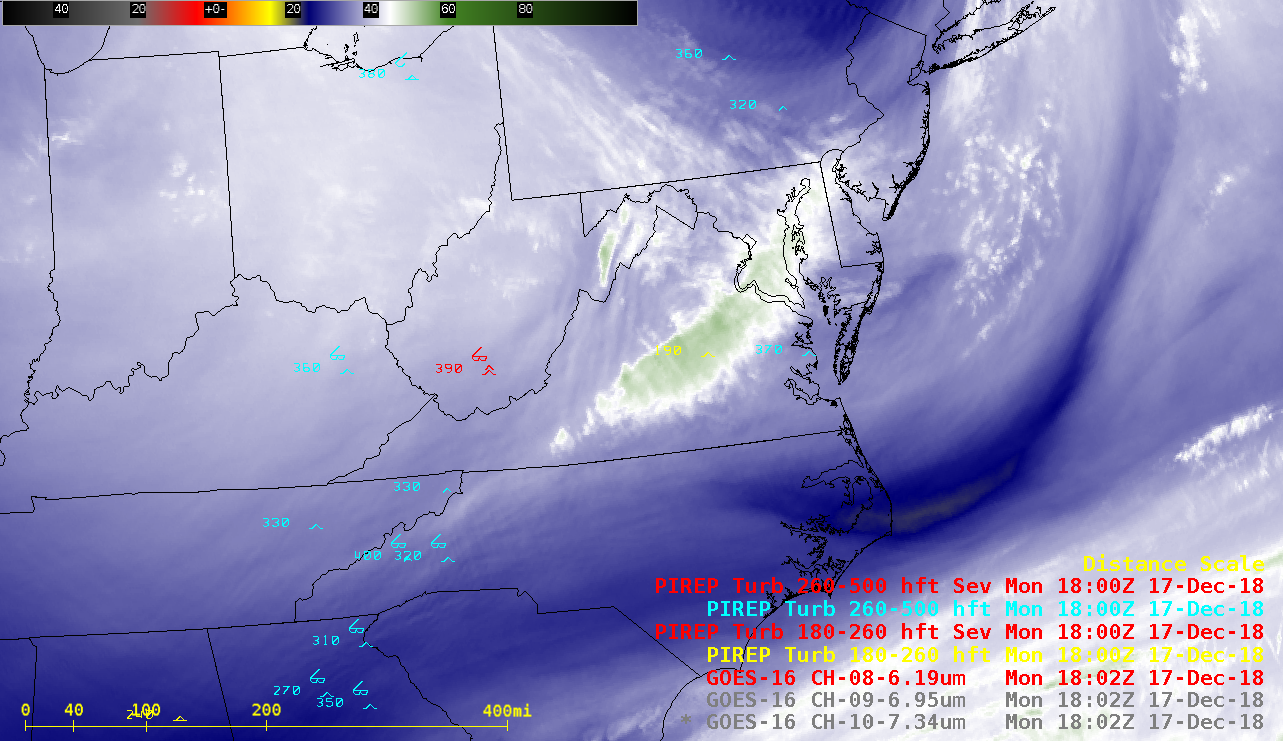
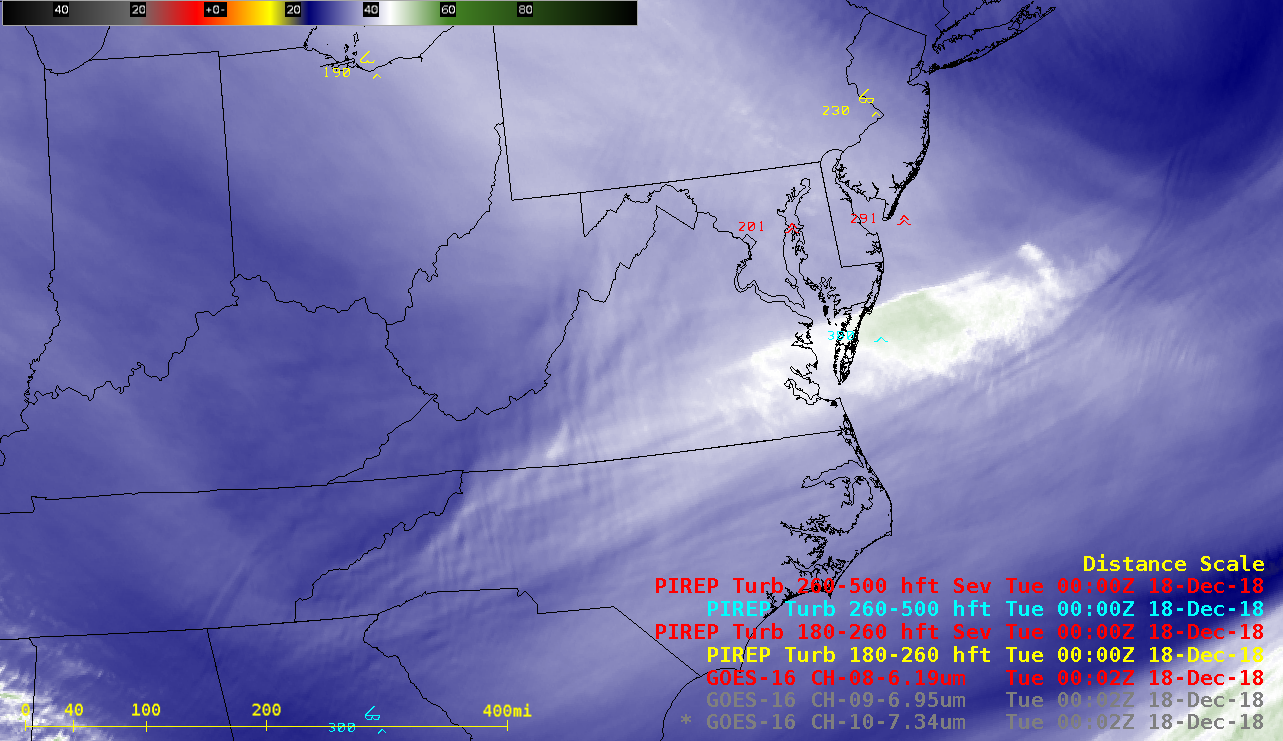
Orographic standing wave cloud over the Mid-Atlantic states
![Topography + GOES-16 Low-level (7.3 µm), Mid-level (6.9 µm) and Upper-level (6.2 µm) Water Vapor images, with pilot reports of turbulence [click to play MP4 animation]](https://cimss.ssec.wisc.edu/satellite-blog/wp-content/uploads/sites/5/2018/12/va_wv9-20181217_181216.png)
Topography + GOES-16 Low-level (7.3 µm), Mid-level (6.9 µm) and Upper-level (6.2 µm) Water Vapor images, with pilot reports of turbulence [click to play MP4 animation]
A comparison of GOES-16 Mid-level Water Vapor, Cloud Top Phase and Cloud Top Height products at 2007 UTC (below) indicated that this wave cloud was composed of Cirrus with maximum cloud tops around 30,000 feet.
![GOES-16 Mid-level Water Vapor (6.9 µm), Cloud Top Phase and Cloud Top Height products [click to enlarge]](https://cimss.ssec.wisc.edu/satellite-blog/wp-content/uploads/sites/5/2018/12/181217_2007utc_goes16_waterVapor_cloudTopPhase_cloudTopHeight_anim.gif)
GOES-16 Mid-level Water Vapor (6.9 µm), Cloud Top Phase and Cloud Top Height products [click to enlarge]
![GOES-16 Mid-level Water Vapor (6.9 µm) image at 2102 UTC, showing the orientation of a nortwest-southeast cross section [click to enlarge]](https://cimss.ssec.wisc.edu/satellite-blog/wp-content/uploads/sites/5/2018/12/va_wv9_xsec_baseline-20181217_210216.png)
GOES-16 Mid-level Water Vapor (6.9 µm) image at 2102 UTC, showing the orientation of a northwest-southeast cross section [click to enlarge]
![Northwest-southeast cross section of RUC40 model Relative Humidity, Wind Speed and Adiabatic Omega [click to enlarge]](https://cimss.ssec.wisc.edu/satellite-blog/wp-content/uploads/sites/5/2018/12/va_ruc_xsec-20181217_210000.png)
Northwest-southeast cross section of RUC40 model Relative Humidity, Wind Speed and Adiabatic Omega [click to enlarge]
![GOES-16 Mid-level Water Vapor (6.9 µm) images, with RAP40 model 250 hPa isotachs and deformation vectors [click to play animation | MP4]](https://cimss.ssec.wisc.edu/satellite-blog/wp-content/uploads/sites/5/2018/12/181217_goes16_waterVapor_250windSpeed_250Deformation_anim.gif)
GOES-16 Mid-level Water Vapor (6.9 µm) images, with RAP40 model 250 hPa isotachs and deformation vectors [click to play animation | MP4]
![NOAA-20 VIIRS True Color RGB and Infrared Window (11.45 µm) images [click to enlarge]](https://cimss.ssec.wisc.edu/satellite-blog/wp-content/uploads/sites/5/2018/12/181217_1825utc_noaa20_viirs_truecolor_infraredWindow_VA_anim.gif)
NOAA-20 VIIRS True Color RGB and Infrared Window (11.45 µm) images [click to enlarge]
They are standing wave clouds. I think the orientation is not exactly parallel because of the faster flow to the north results in a greater downwind displacement than to the south.
Study on the phenomena: https://t.co/5BpB5IZPOs
Here’s a forecast guide: https://t.co/57fDmHaOhD— Jonathan Blaes (@jlblaes) December 18, 2018
A comparison of 1812 UTC Aqua MODIS Visible (0.65 µm), Infrared Window (11.0 µm), Near-Infrared “Cirrus” (1.37 µm) and Water Vapor (6.7 µm) images with plots of maximum temperatures on 17 December (below) revealed that high temperatures were confined to the upper 50s F beneath the wave cloud, in contrast to low 60s F on either side where incoming solar radiation was not diminished.
![Aqua MODIS Visible (0.65 µm), Infrared Window (11.0 µm), Near-Infrared "Cirrus" (1.37 µm) and Water Vapor (6.7 µm) images, with plots of maximum temperatures on 17 December [click to enlarge]](https://cimss.ssec.wisc.edu/satellite-blog/wp-content/uploads/sites/5/2018/12/181217_1812utc_aqua_modis_visible_infrared_cirrus_waterVapor_MaxTemperatures_anim.gif)
Topography + Aqua MODIS Visible (0.65 µm), Infrared Window (11.0 µm), Near-Infrared “Cirrus” (1.37 µm) and Water Vapor (6.7 µm) images, with plots of maximum temperatures on 17 December [click to enlarge]