Pyrocumulonimbus cloud in South Africa
![Meteosat-11 Visible (0.8 µm), Shortwave Infrared (3.92 µm) and Longwave Infrared Window (10.8 µm) images [click to play animation | MP4]](https://cimss.ssec.wisc.edu/satellite-blog/wp-content/uploads/sites/5/2018/10/181029_meteosat11_visible_shortwaveInfrared_infraredWindow_South_Africa_pyrocb_anim.gif)
Meteosat-11 Visible (0.8 µm, top), Shortwave Infrared (3.92 µm, center) and Longwave Infrared Window (10.8 µm, bottom) images [click to play animation | MP4]
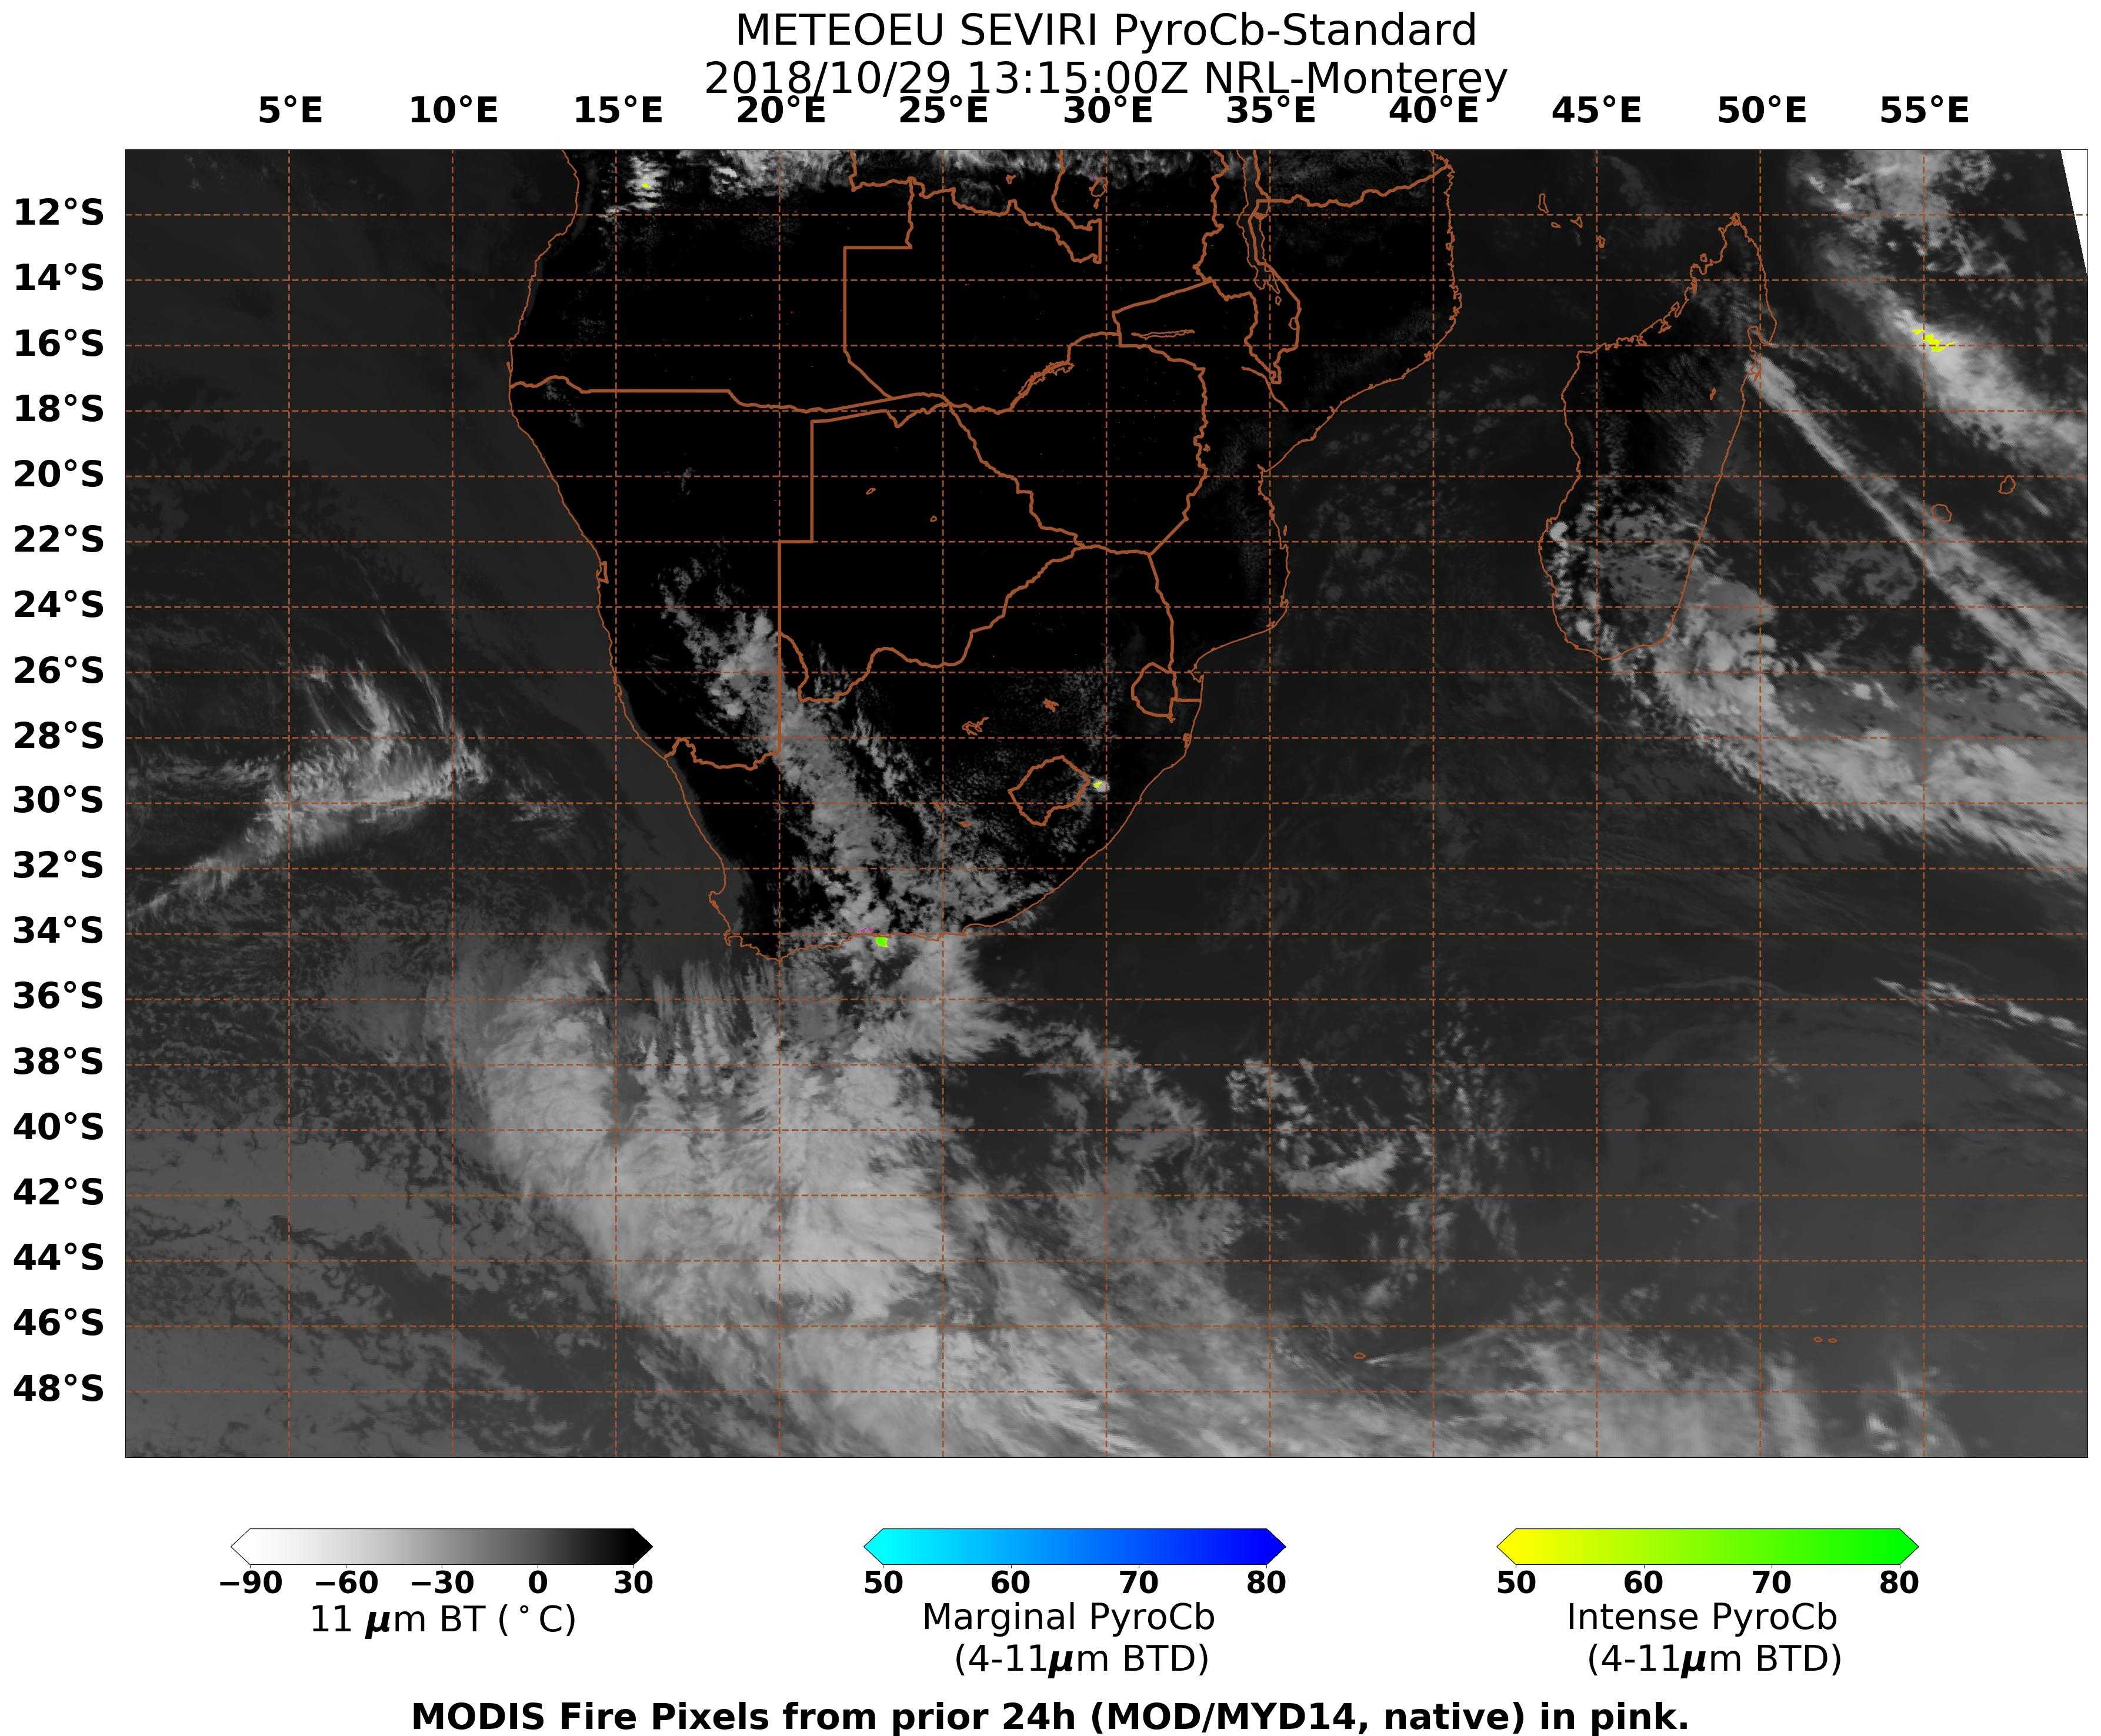
Zooming out a bit to follow the southeastward drift of the pyroCb cloud (below), the coldest cloud-top 10.8 µm infrared brightness temperature (BT) was -61ºC (darker red enhancement) at 1315 UTC — then the cloud tops remained in the -55 to -59ºC range (orange enhancement) for the next 6 hours or so. Leveraging the large difference between cold 10.8 µm and warm 3.92 µm BTs, NRL calculates a pyroCb index, which classified this feature as an “intense pyroCb” (1315 UTC | animation). The coldest 10.8 µm cloud-top BT of -61ºC roughly corresponds to an altitude of 13.5 km based on 12 UTC rawinsonde data from Port Elizabeth (plot | list).
![Meteosat-11 Shortwave Infrared (3.92 µm, left) and Longwave Infrared Window (10.8 µm, right) images [click to play animation | MP4]](https://cimss.ssec.wisc.edu/satellite-blog/wp-content/uploads/sites/5/2018/10/181029_meteosat11_shortwaveInfrared_infraredWindow_South_Africa_pyrocb_anim.gif)
Meteosat-11 Shortwave Infrared (3.92 µm, left) and Longwave Infrared Window (10.8 µm, right) images [click to play animation | MP4]
![NOAA-19 AVHRR imagery at 1420 UTC [click to enlarge]](https://cimss.ssec.wisc.edu/satellite-blog/wp-content/uploads/sites/5/2018/10/181029_1420utc_noaa19_South_Africa_pyrocb.jpg)
NOAA-19 AVHRR imagery at 1420 UTC [click to enlarge]
![Suomi NPP VIIRS True Color RGB image [click to enlarge]](https://cimss.ssec.wisc.edu/satellite-blog/wp-content/uploads/sites/5/2018/10/181029_snpp_viirs_tc_Africa.jpeg)
Suomi NPP VIIRS True Color RGB image [click to enlarge]
![NOAA-20 VIIRS True Color RGB image [click to enlarge]](https://cimss.ssec.wisc.edu/satellite-blog/wp-content/uploads/sites/5/2018/10/181030_1118utc_noaa20_viirs_truecolor_South_Africa_smoke_anim.gif)
NOAA-20 VIIRS True Color RGB image [click to enlarge]
![Time series plot of of surface observations from George [click to enlarge]](https://cimss.ssec.wisc.edu/satellite-blog/wp-content/uploads/sites/5/2018/10/181028_181030_FAGG_SFCMG.GIF)
Time series plot of of surface observations from George [click to enlarge]