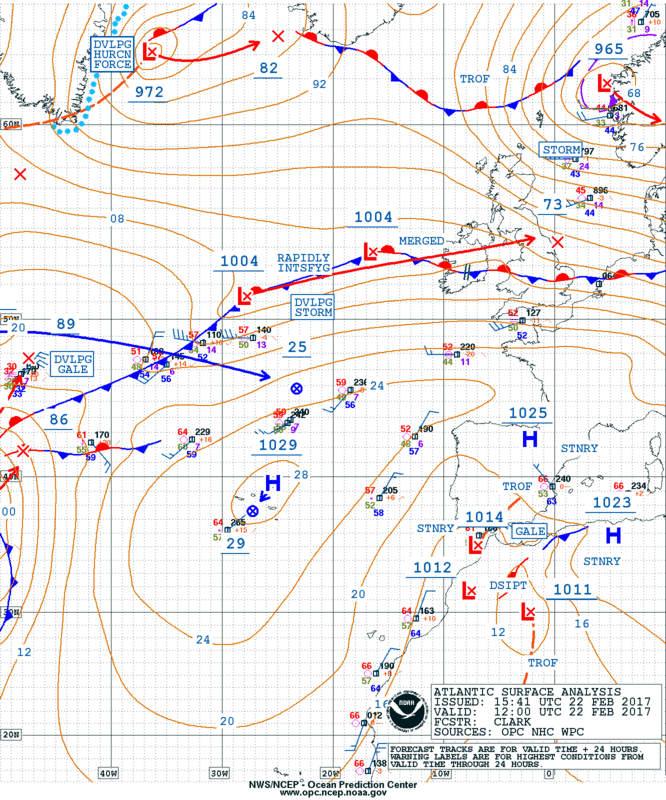
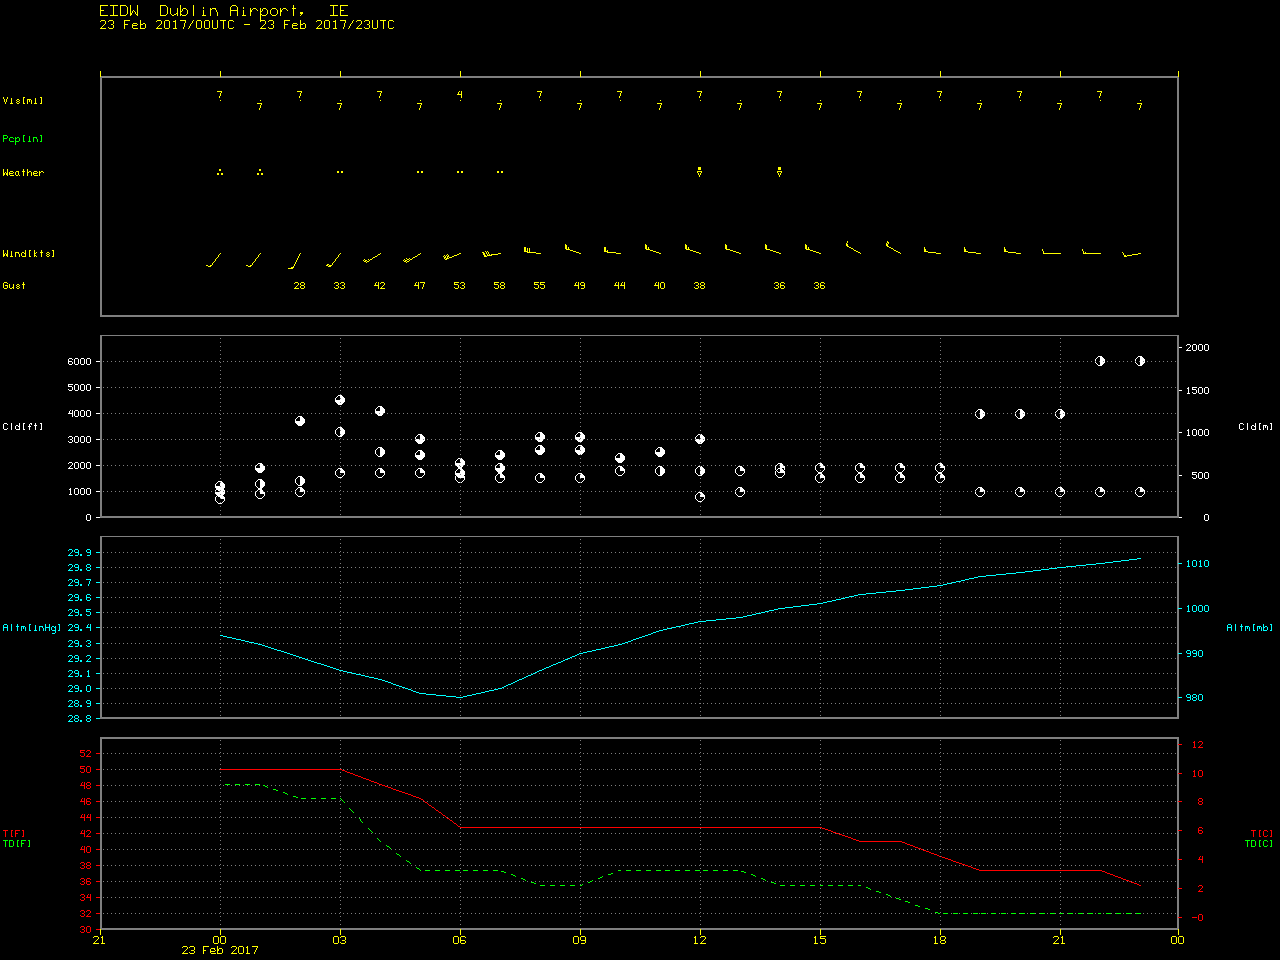
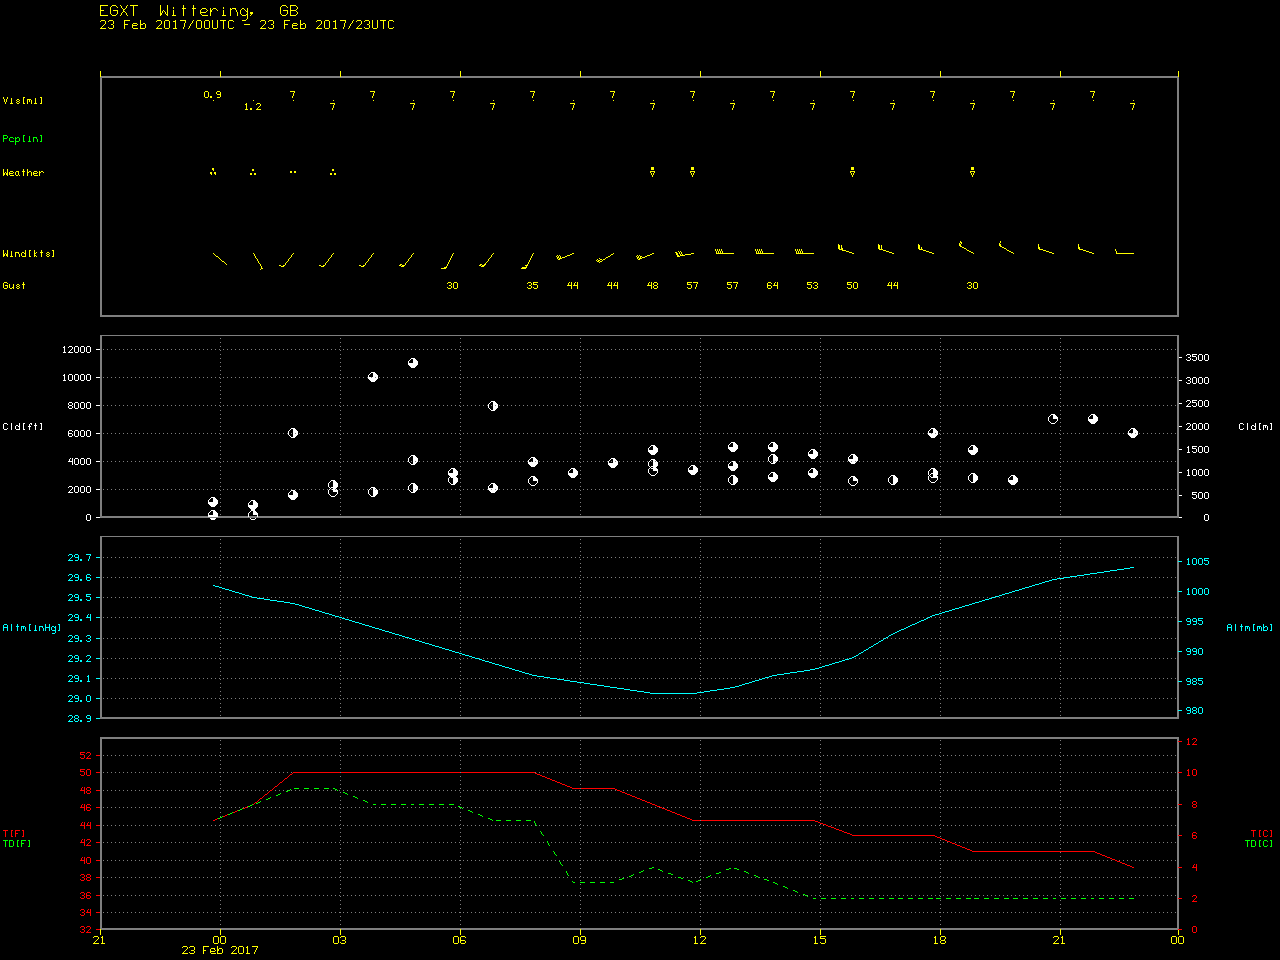
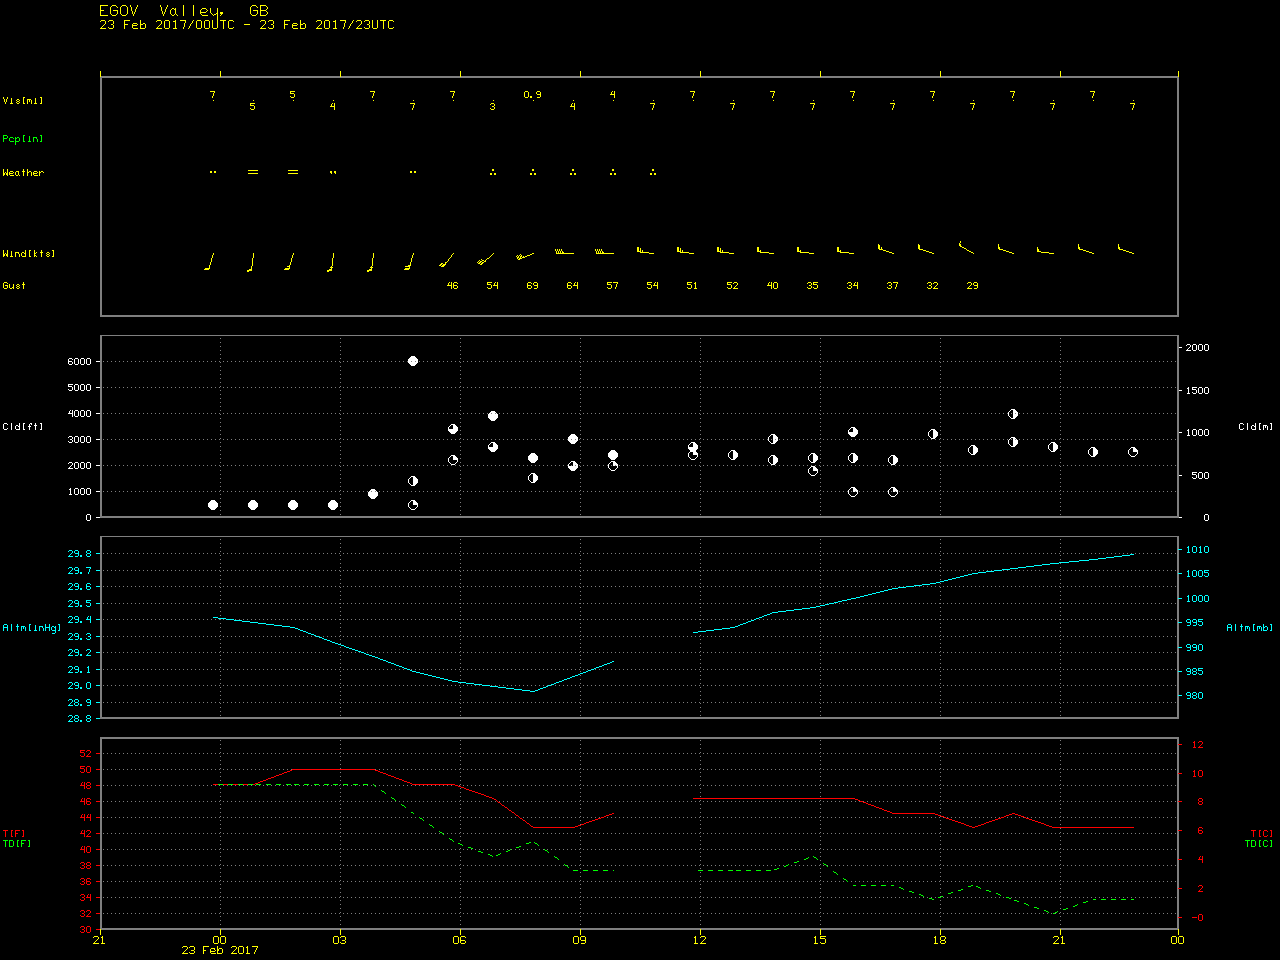
Storm “Doris” affects the British Isles
![Meteosat-10 Water Vapor (6.25 µm) images, with hourly surface wind gusts in knots [click to play animation]](https://cimss.ssec.wisc.edu/satellite-blog/wp-content/uploads/sites/5/2017/02/170223_meteosat10_water_vapor_Storm_Doris_anim.gif)
Meteosat-10 Water Vapor (6.25 µm) images, with hourly surface wind gusts in knots [click to play animation]
The corresponding daylight Meteosat-10 High Resolution Visible (0.8 µm) images (below) revealed better detail of the various cloud structures associated with the storm.
![Meteosat-10 High Resolution Visible (0.8 µm) images, with hourly surface wind gusts in knots [click to play animation]](https://cimss.ssec.wisc.edu/satellite-blog/wp-content/uploads/sites/5/2017/02/170223_meteosat10_visible_Storm_Doris_anim.gif)
Meteosat-10 High Resolution Visible (0.8 µm) images, with hourly surface wind gusts in knots [click to play animation]
![Terra MODIS (1039 UTC), Aqua MODIS (1226 UTC) and Suomi NPP VIIRS (1248 UTC) true-color RGB images [click to enlarge]](https://cimss.ssec.wisc.edu/satellite-blog/wp-content/uploads/sites/5/2017/02/170223_modis_viirs_truecolor_Storm_Doris_anim.gif)
Terra MODIS (1039 UTC), Aqua MODIS (1226 UTC) and Suomi NPP VIIRS (1248 UTC) true-color RGB images [click to enlarge]