Tehuano wind event

GOES-17 (left) and GOES-16 (right) “Red” Visible (0.64 µm) images, with plots of surface wind barbs (speed in knots) [click to play animation | MP4]
The GOES-16 Aerosol Optical Depth product (below) showed lightly enhanced AOD values toward the outer edges of the swath of Tehuano winds. Note the gap in the product during the afternoon hours, when large amounts of sun glint were present.
![GOES-16 Aerosol Optical Depth product [click to play animation | MP4]](https://cimss.ssec.wisc.edu/satellite-blog/wp-content/uploads/sites/5/2019/03/190305_goes16_aerosolOpticalDepth_Tehuano_anim.gif)
GOES-16 Aerosol Optical Depth product [click to play animation | MP4]
![GOES-16 Dust Detection product [click to play animation | MP4]](https://cimss.ssec.wisc.edu/satellite-blog/wp-content/uploads/sites/5/2019/03/190305_goes16_dustDetection_Tehuano_anim.gif)
GOES-16 Dust Detection product [click to play animation | MP4]
![GOES-16 Aerosol Optical Depth product, with plots of available NUCAPS sounding profiles [click to enlarge]](https://cimss.ssec.wisc.edu/satellite-blog/wp-content/uploads/sites/5/2019/03/tehuano_nucaps_points-20190305_184530.png)
GOES-16 Aerosol Optical Depth product, with plots of available NUCAPS sounding profiles [click to enlarge]
![Comparison of Dry (D) and Moist (M) NUCAPS soundings [click to enlarge]](https://cimss.ssec.wisc.edu/satellite-blog/wp-content/uploads/sites/5/2019/03/190305_1948utc_nucaps_dry_moist_soundings_Tehuano_anim.gif)
Comparison of Dry (D) and Moist (M) NUCAPS soundings [click to enlarge]
![NOAA-20 VIIRS True Color Red-Green-Blue (RGB) image [click to enlarge]](https://cimss.ssec.wisc.edu/satellite-blog/wp-content/uploads/sites/5/2019/03/190305_noaa20_viirs_truecolor_Tehuano.png)
NOAA-20 VIIRS True Color Red-Green-Blue (RGB) image [click to enlarge]
===== 06 March Update =====
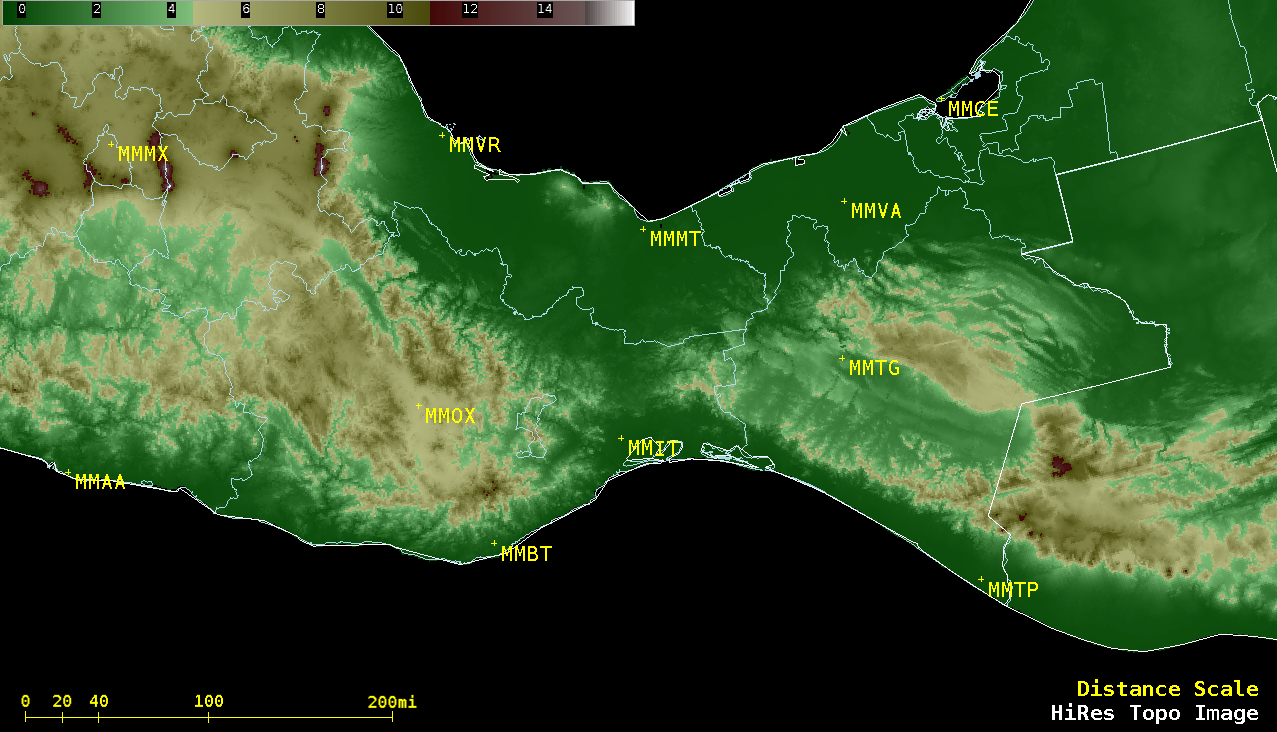
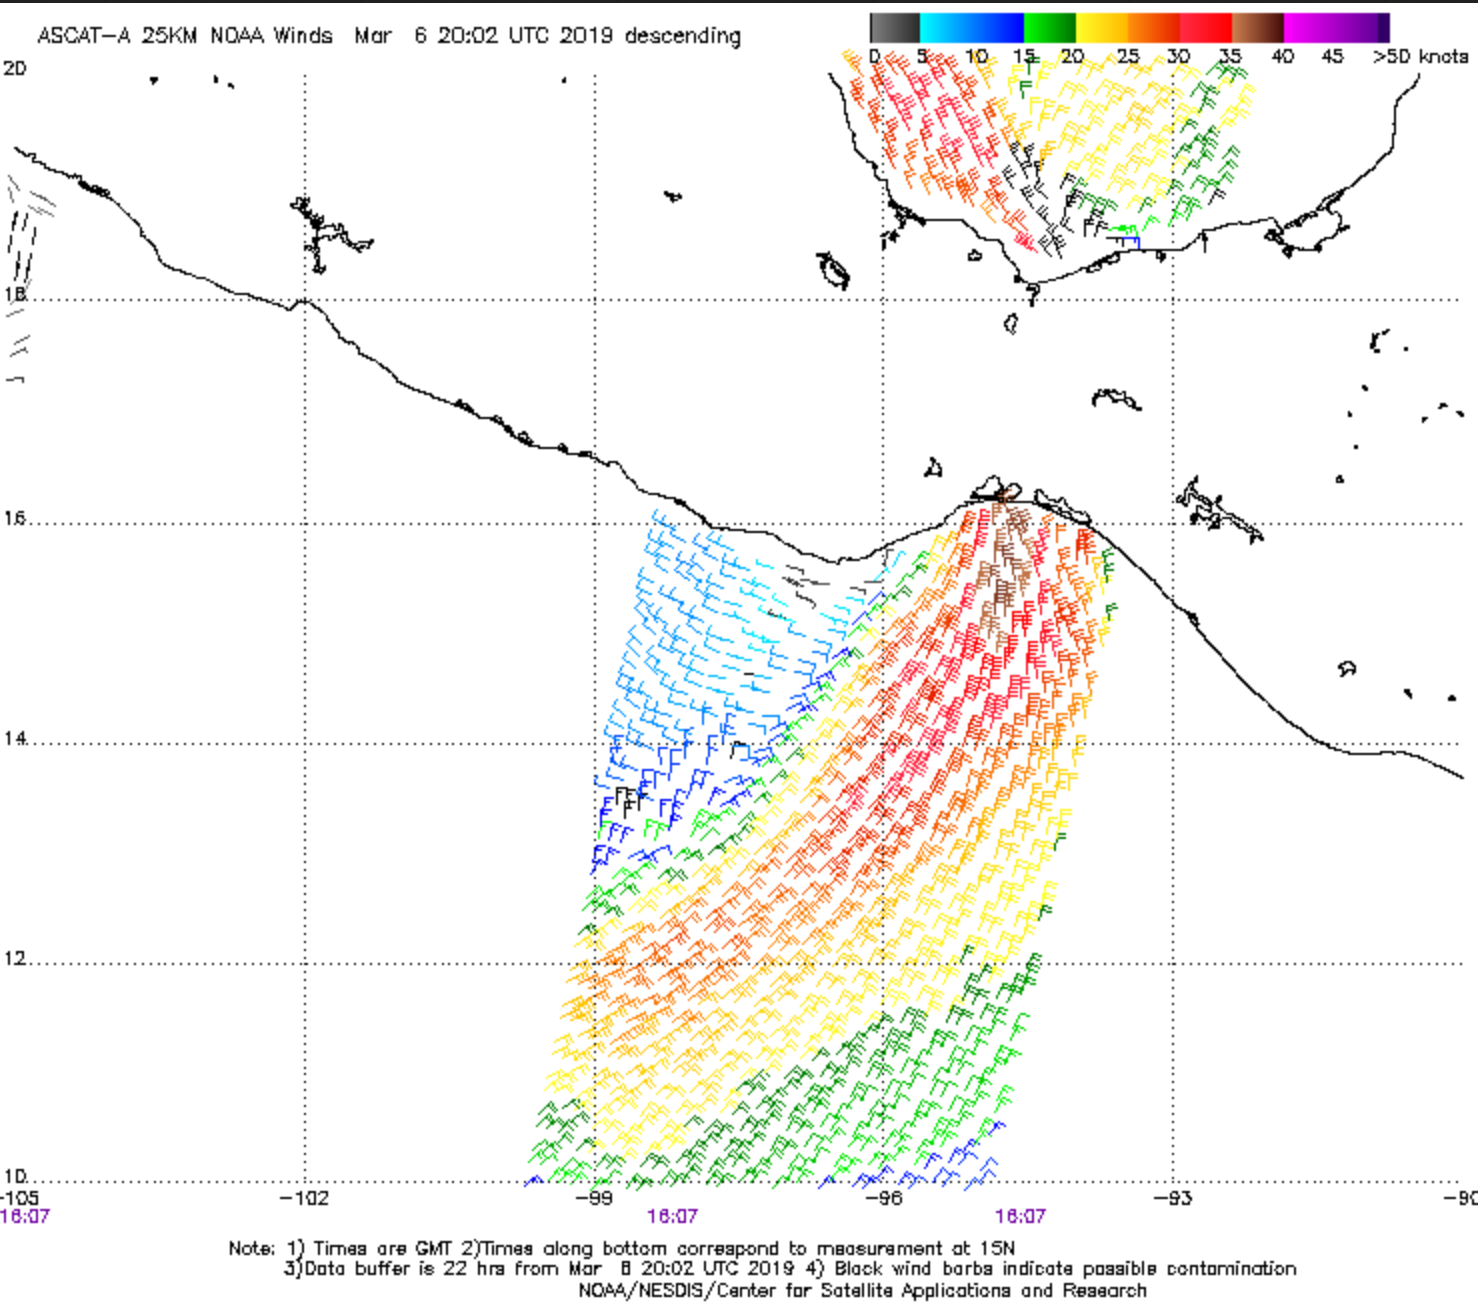
![GOES-16 Shortwave Infrared (3.9 µm) image, with Metop-A ASCAT winds [click to enlarge]](https://cimss.ssec.wisc.edu/satellite-blog/wp-content/uploads/sites/5/2019/03/tehuano_ascat_swir-20190306_040030.png)
GOES-16 Shortwave Infrared (3.9 µm) image, with Metop-A ASCAT winds [click to enlarge]
![GOES-16 Shortwave Infrared (3.9 µm) image, with Metop-A ASCAT winds [click to enlarge]](https://cimss.ssec.wisc.edu/satellite-blog/wp-content/uploads/sites/5/2019/03/tehuano_swir_ascat-20190306_160030.png)
GOES-16 Shortwave Infrared (3.9 µm) image, with Metop-A ASCAT winds [click to enlarge]
![GOES-16 Shortwave Infrared (3.9 µm) images [click to play animation | MP4]](https://cimss.ssec.wisc.edu/satellite-blog/wp-content/uploads/sites/5/2019/03/190306_goes16_shortwaveInfrared_Tehuano_anim.gif)
GOES-16 Shortwave Infrared (3.9 µm) images [click to play animation | MP4]
![GOES-17 (left) and GOES-16 (right) "Red" Visible (0.64 µm) images, with plots of surface wind barbs (speed in knots) [click to play animation | MP4]](https://cimss.ssec.wisc.edu/satellite-blog/wp-content/uploads/sites/5/2019/03/190306_goes17_goes16_visible_Tehuano_anim.gif)
GOES-17 (left) and GOES-16 (right) “Red” Visible (0.64 µm) images, with plots of surface wind barbs (speed in knots) [click to play animation | MP4]
![GOES-16 "Red" Visible (0.64 µm) images + Dust Detection product [click to play animation | MP4]](https://cimss.ssec.wisc.edu/satellite-blog/wp-content/uploads/sites/5/2019/03/190306_goes16_visible_dustDetection_anim.gif)
GOES-16 “Red” Visible (0.64 µm) images + Dust Detection product [click to play animation | MP4]
![Suomi NPP VIIRS True Color RGB image [click to enlarge]](https://cimss.ssec.wisc.edu/satellite-blog/wp-content/uploads/sites/5/2019/03/190306_1930utc_suomiNPP_viirs_truecolor_Tehuano.png)
Suomi NPP VIIRS True Color RGB image [click to enlarge]