Tornado outbreak in Alabama and Georgia
GOES-16 “Red” Visible (0.64 µm) images, with SPC storm reports plotted in red [click to play animation | MP4]
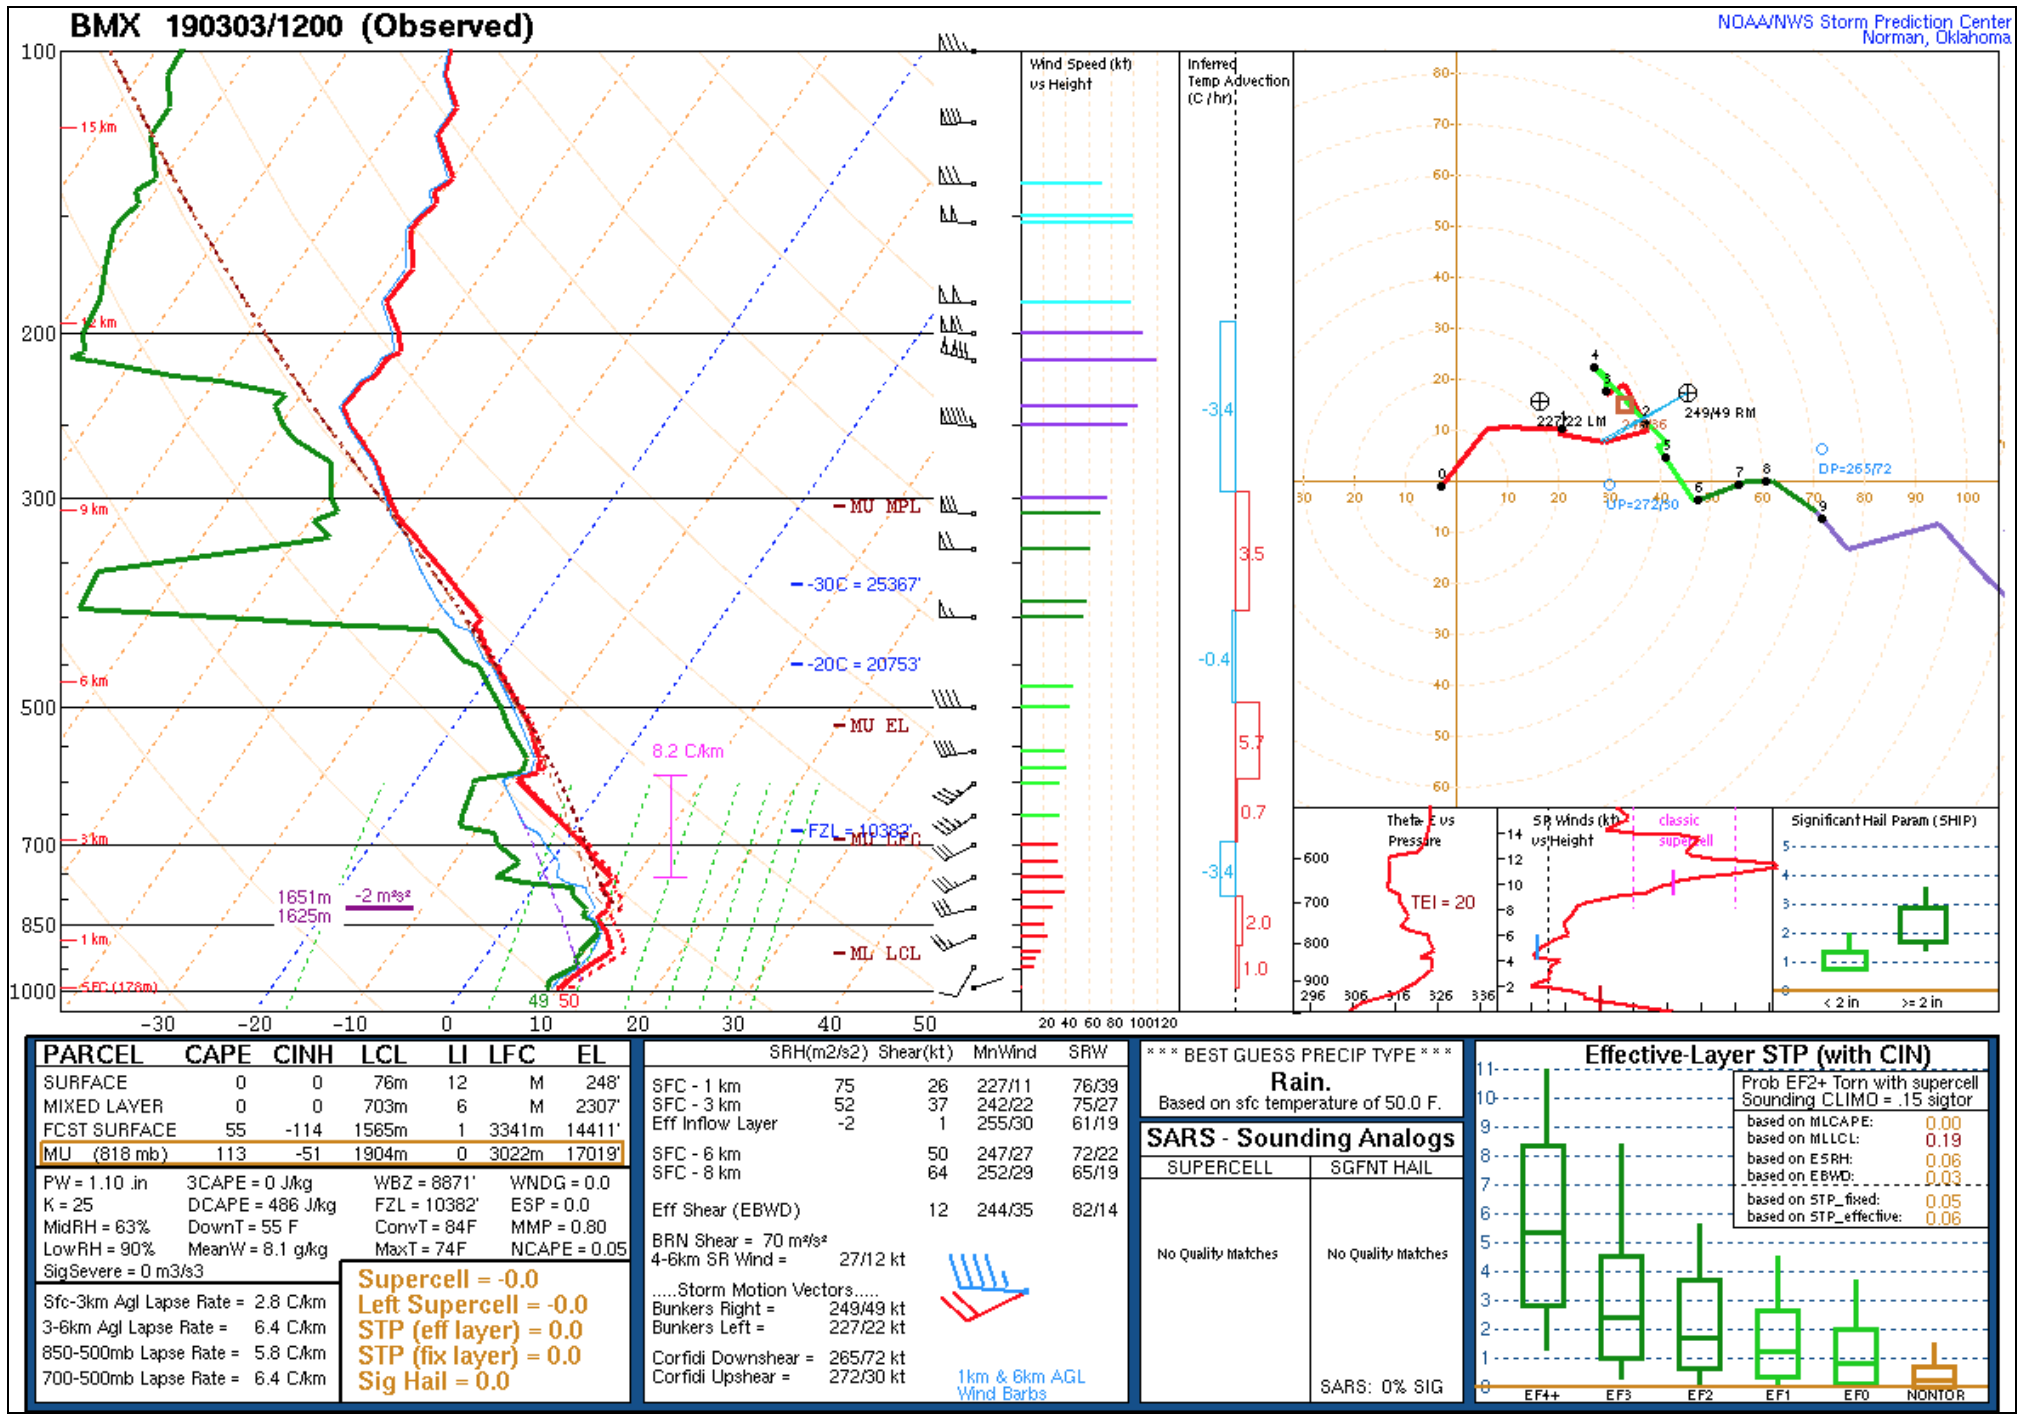
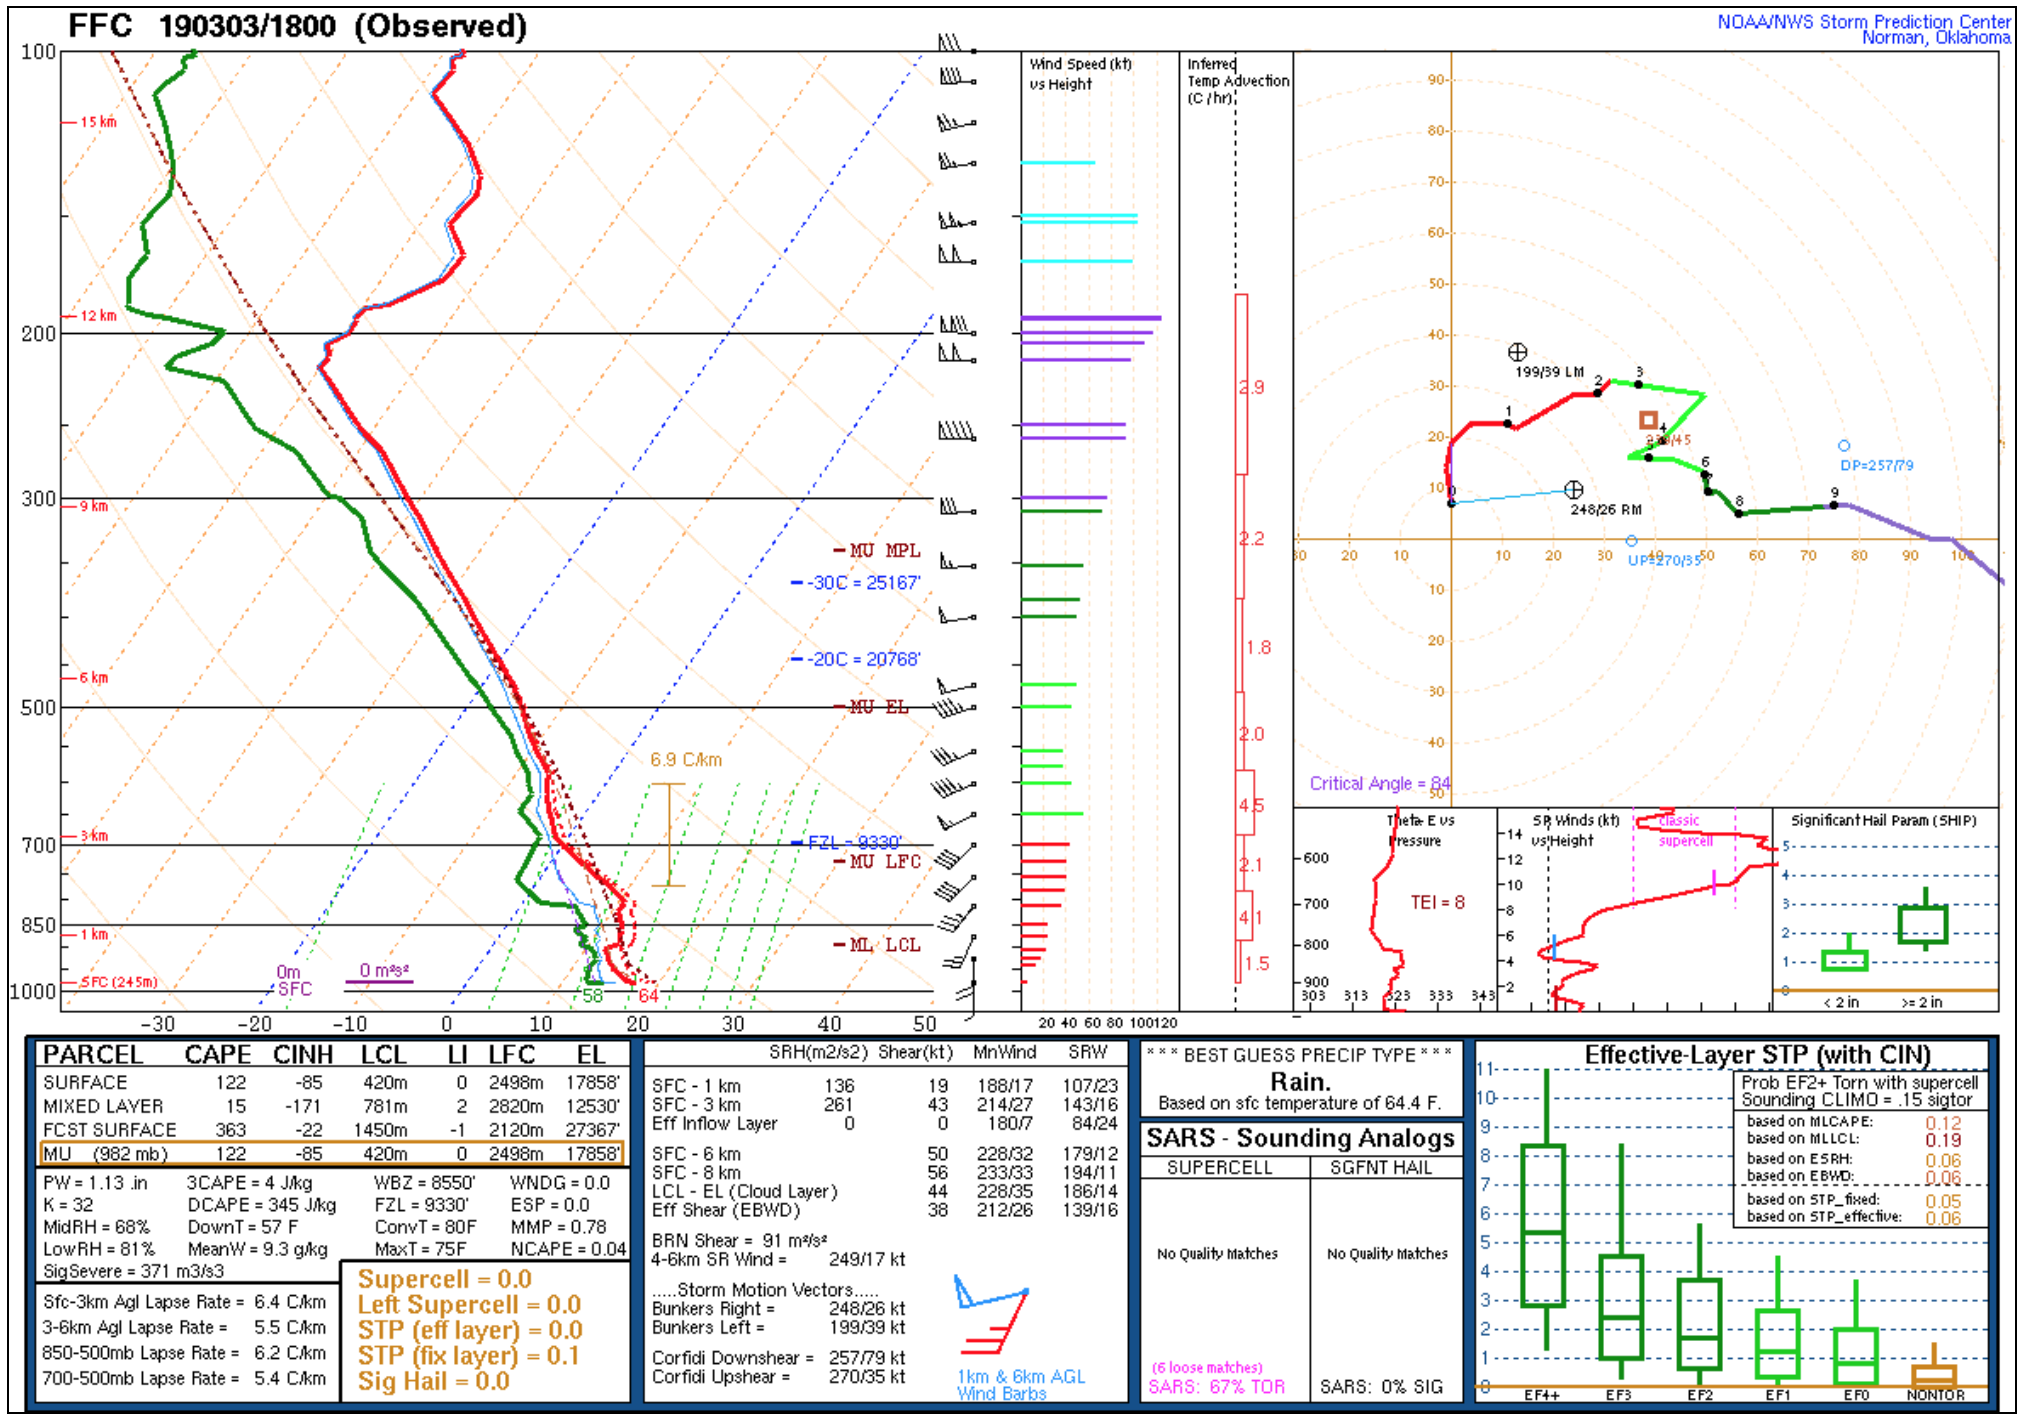
The corresponding GOES-16 “Clean” Infrared Window (10.3 µm) images are shown below. Cloud-top infrared brightness temperatures cooled to around -70ºC (darker black enhancement) with many of the stronger storms — judging from rawinsonde data from Birmingham, Alabama (at 12 UTC) and Peachtree City, Georgia (at 18 UTC), this roughly corresponded to an air parcel rising significantly past the tropopause to an altitude of at least 15 km.
![GOES-16 "Clean" Infrared Window (10.3 µm) images, with SPC storm reports plotted in red [click to play animation | MP4]](https://cimss.ssec.wisc.edu/satellite-blog/wp-content/uploads/sites/5/2019/03/190303_goes16_infrared_spcStormReports_AL_GA_anim.gif)
GOES-16 “Clean” Infrared Window (10.3 µm) images, with SPC storm reports plotted in cyan [click to play animation | MP4]
![GOES-16 "Clean" Infrared Window (10.3 µm) images, with SPC storm reports plotted in cyan [click to play animation | MP4]](https://cimss.ssec.wisc.edu/satellite-blog/wp-content/uploads/sites/5/2019/03/190303_goes16_visible_infrared_spcStormReports_Lee_County_AL_anim.gif)
GOES-16 “Red” Visible (0.64 µm, left) and “Clean” Infrared Window (10.3 µm, right) images, with SPC storm reports plotted in red/cyan — Lee County, Alabama is outlined in solid blue, with other affected counties in dashed blue [click to play animation | MP4]
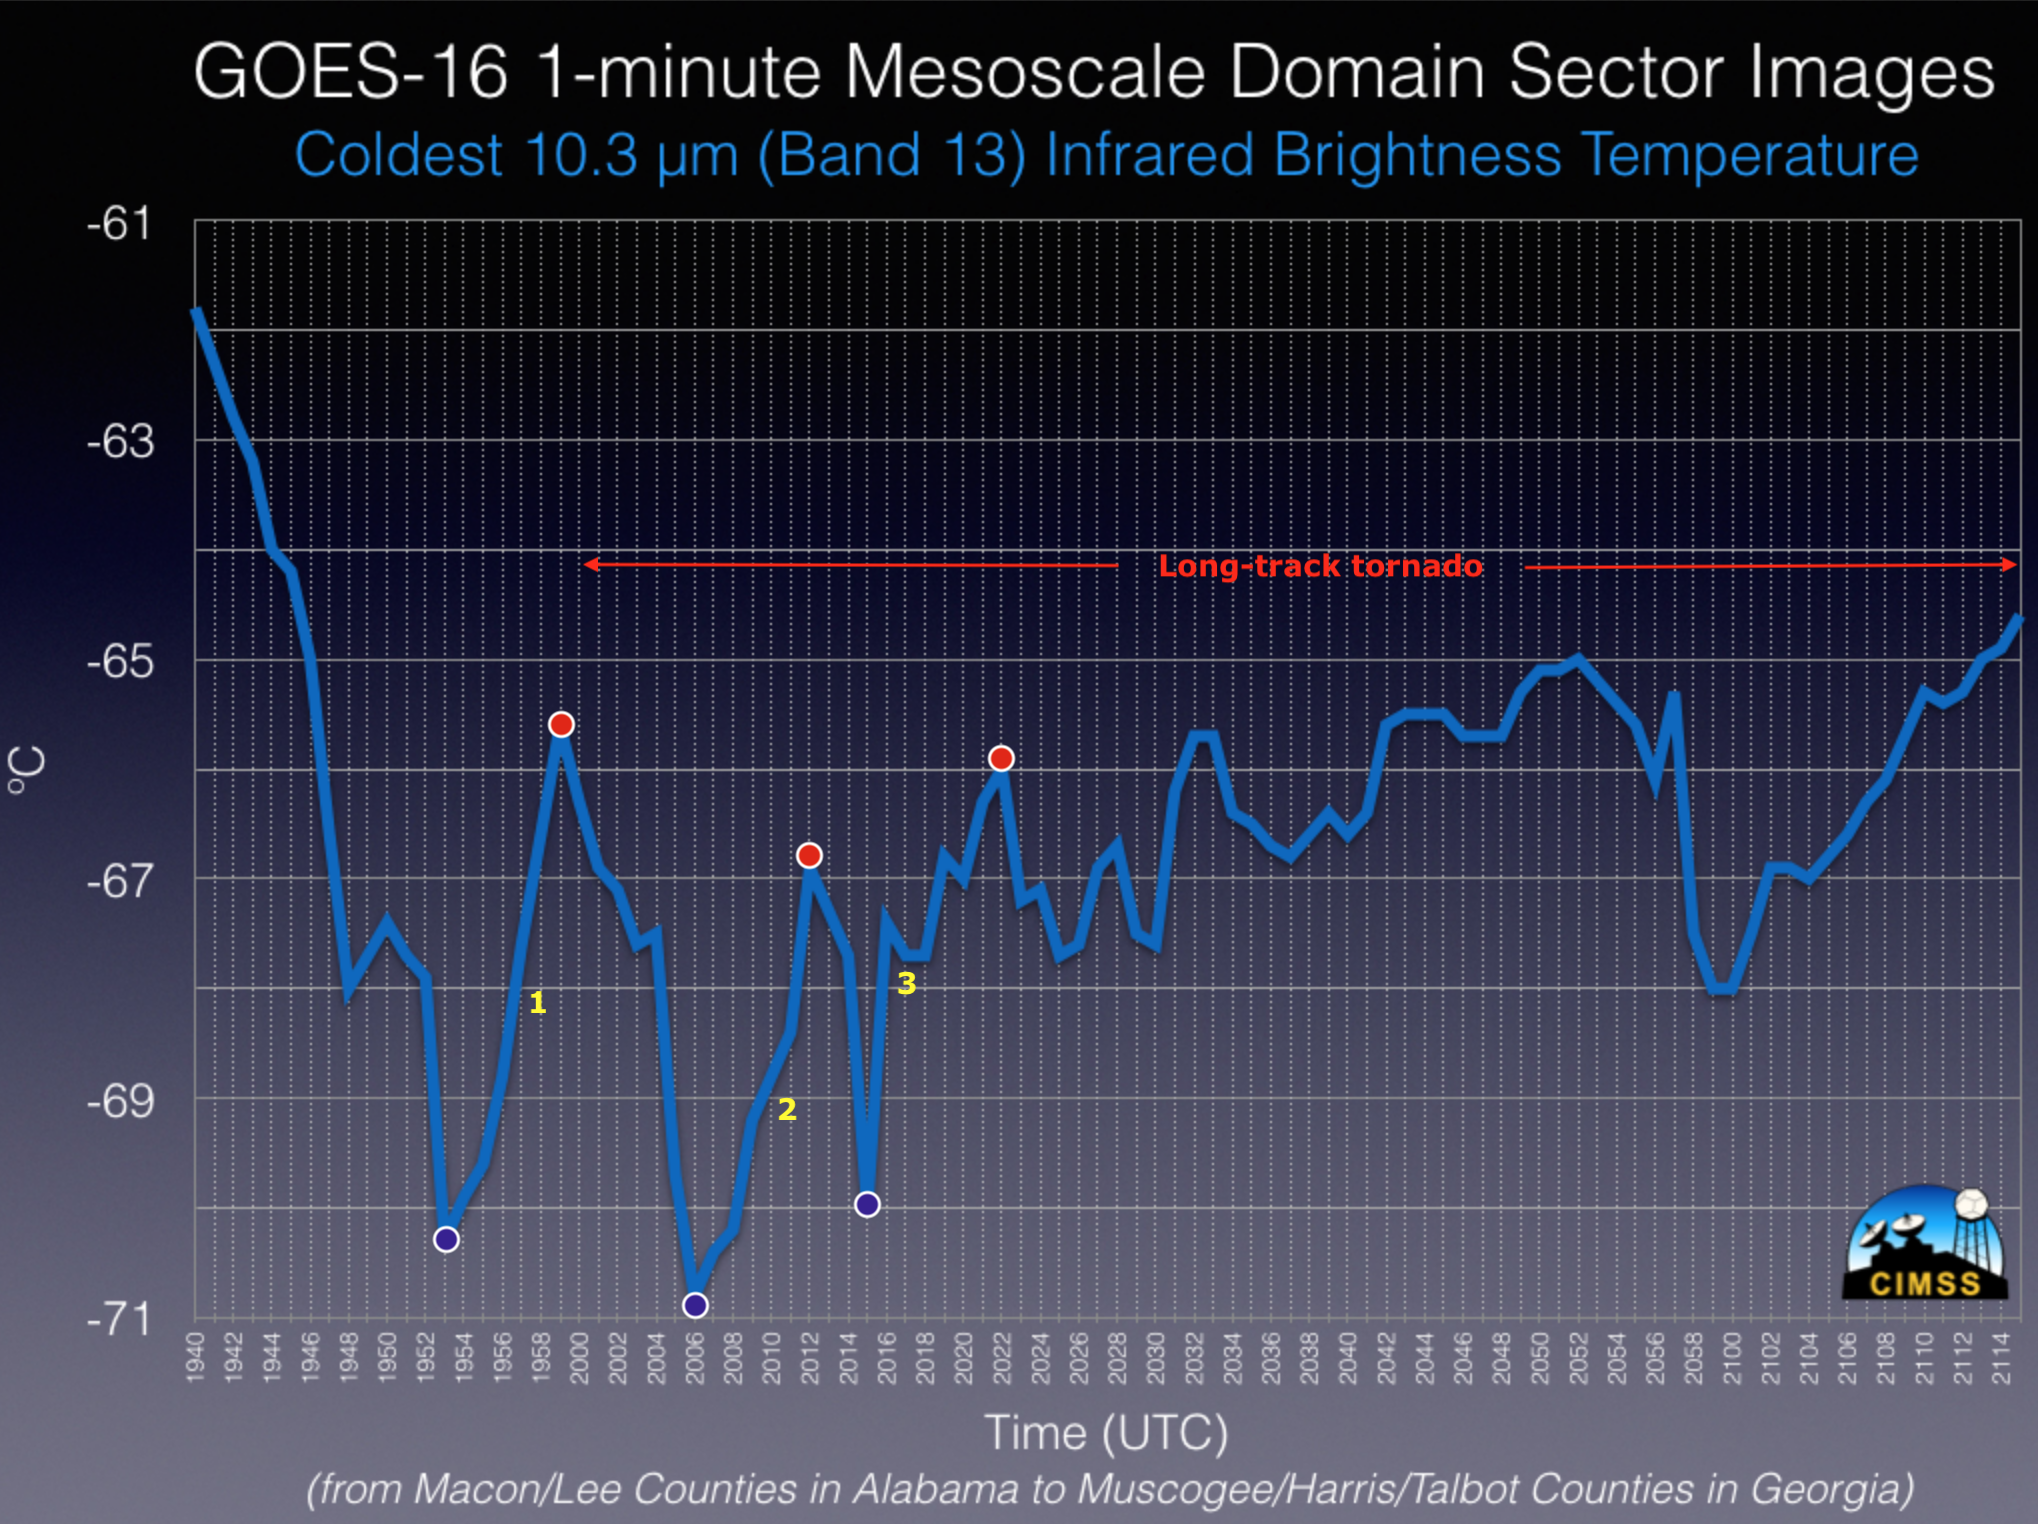
Plot of the coldest GOES-16 “Clean” Infrared Window (10.3 µm) overshooting top brightness temperatures, 2040-2115 UTC [click to enlarge]
![MRMS MergedReflectivity composite, with countours of the ProbSevere parameter [click for link to HWT blog post]](https://cimss.ssec.wisc.edu/satellite-blog/wp-content/uploads/sites/5/2019/03/190303_1942utc_prosevere_AL_GA.png)
MRMS MergedReflectivity composite, with countours of the ProbSevere parameter [click for link to HWT blog post]
![Aqua MODIS Visible (0.65 µm), Infrared Window (11.0 µm) and Total Precipitable Water images at 1836 UTC [click to enlarge]](https://cimss.ssec.wisc.edu/satellite-blog/wp-content/uploads/sites/5/2019/03/190303_1836utc_aqua_modis_visible_infrared_totalPrecipitableWater_AL_GA_anim.gif)
Aqua MODIS Visible (0.65 µm), Infrared Window (11.0 µm) and Total Precipitable Water images at 1836 UTC [click to enlarge]
![Suomi NPP VIIRS Day/Night Band (0.7 µm) image, with plots of available NUCAPS soundings [click to enlarge]](https://cimss.ssec.wisc.edu/satellite-blog/wp-content/uploads/sites/5/2019/03/viirs_vis_AL_GA-20190303_184532.png)
Suomi NPP VIIRS Day/Night Band (0.7 µm) image, with plots of available NUCAPS soundings [click to enlarge]
![NUCAPS sounding over southwestern Georgia [click to enlarge]](https://cimss.ssec.wisc.edu/satellite-blog/wp-content/uploads/sites/5/2019/03/190303_1850utc_nucaps_GA.png)
NUCAPS sounding over southwestern Georgia [click to enlarge]
![GOES-16 All Sky CAPE product [click to play animation]](https://cimss.ssec.wisc.edu/satellite-blog/wp-content/uploads/sites/5/2019/03/190303_goes16_allSkyCAPE_anim.gif)
GOES-16 All Sky CAPE product [click to play animation]
===== 05 March Update =====
![Comparison between Terra MODIS True Color and False Color RGB images on 24 February and 05 March 2019 [click to enlarge]](https://cimss.ssec.wisc.edu/satellite-blog/wp-content/uploads/sites/5/2019/03/190224_190305_terra_modis_truecolor_falsecolor_Lee_County_AL_anim.gif)
Comparison between Terra MODIS True Color and False Color RGB images on 24 February and 05 March 2019 [click to enlarge]
Sentinel-2 True Color images (below) provided a higher-resolution view of the tornado damage path. Imagery courtesy of Sentinel Hub.
![Sentinel-2 True Color RGB images from 24 February and 06 March [click to enlarge]](https://cimss.ssec.wisc.edu/satellite-blog/wp-content/uploads/sites/5/2019/03/190306_sentinel2_truecolor_AL_GA_tornado_damage_path_anim.gif)
Sentinel-2 True Color RGB images from 24 February and 06 March [click to enlarge]
The path of the #tornado that hit #Alabama last March 3 is clearly visible from images of #Sentinel2 ?. pic.twitter.com/GLatHrIQ5r
— Annamaria Luongo (@annamaria_84) March 7, 2019
34 tornadoes have been confirmed across Alabama, the Florida panhandle, Georgia and South Carolina from the Sunday March 3, 2019 outbreak. One tornado tracked for nearly 69 miles across AL (EF-4) into GA (EF-3). There were 1 EF-4, 1 EF-3, 7 EF-2, 19 EF-1 and 6 EF-0 tornadoes. pic.twitter.com/qjSQV5poKw
— NWS Eastern Region (@NWSEastern) March 6, 2019