Tropical Storm Gordon
![NOAA-20 Day/Night Band (0.7 µm) and Infrared Window (11.45 µm) images [click to enlarge]](https://cimss.ssec.wisc.edu/satellite-blog/wp-content/uploads/sites/5/2018/09/180903_0636utc_noaa20_DayNightBand_InfraredWindow_ptc7_anim.gif)
NOAA-20 VIIRS Day/Night Band (0.7 µm) and Infrared Window (11.45 µm) images at 0636 UTC [click to enlarge]
![Suomi NPP VIIRS Day/Night Band (0.7 µm) and Infrared Window (11.45 µm) images [click to enlarge]](https://cimss.ssec.wisc.edu/satellite-blog/wp-content/uploads/sites/5/2018/09/180903_0726utc_suomiNPP_DayNightBand_InfraredWindow_ptc7_anim.gif)
Suomi NPP VIIRS Day/Night Band (0.7 µm) and Infrared Window (11.45 µm) images at 0726 UTC [click to enlarge]
The storm became better organized and increased in intensity, and was named Tropical Storm Gordon at 1205 UTC. Animations of GOES-16 (GOES-East) “Red” Visible (0.64 µm) and “Clean” Infrared Window (10.3 µm) (below) showed Gordon as it moved across far southern Florida (where heavy rain and flash flooding occurred) and into the Gulf of Mexico during the daytime hours.
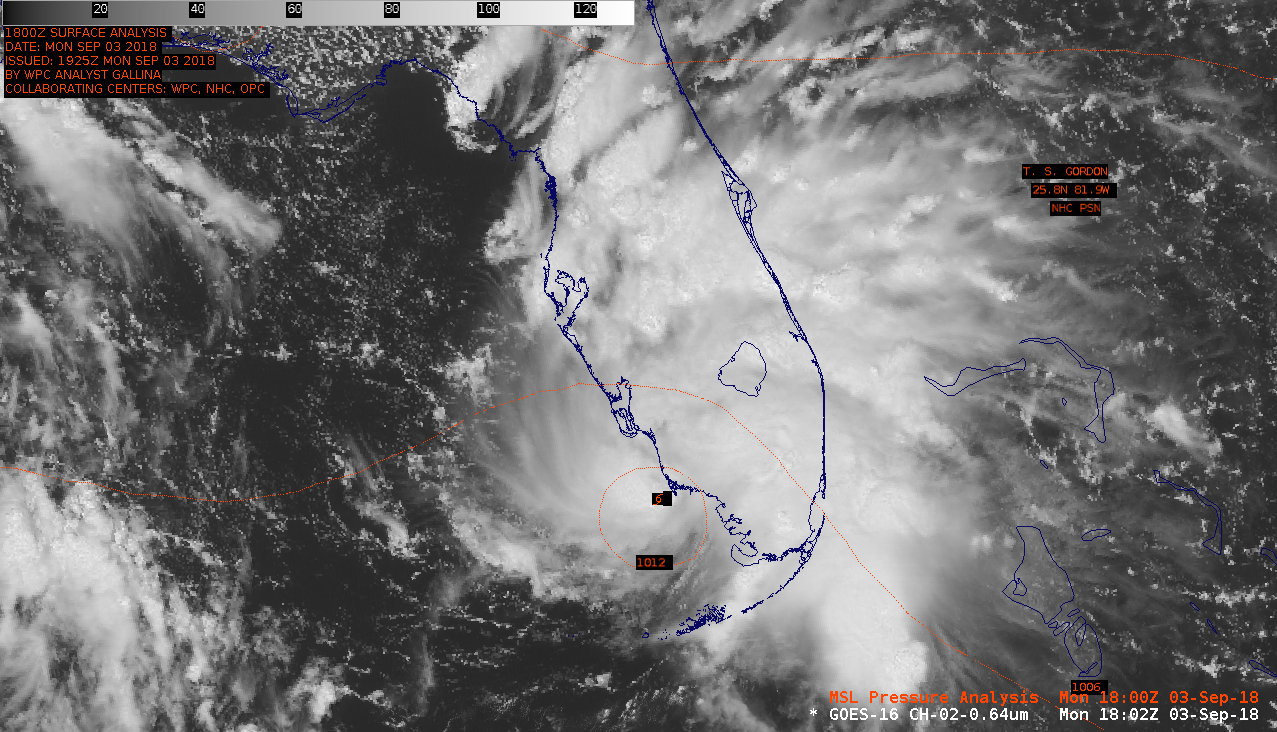
GOES-16 “Red” Visible (0.64 µm) images [click to play MP4 animation]
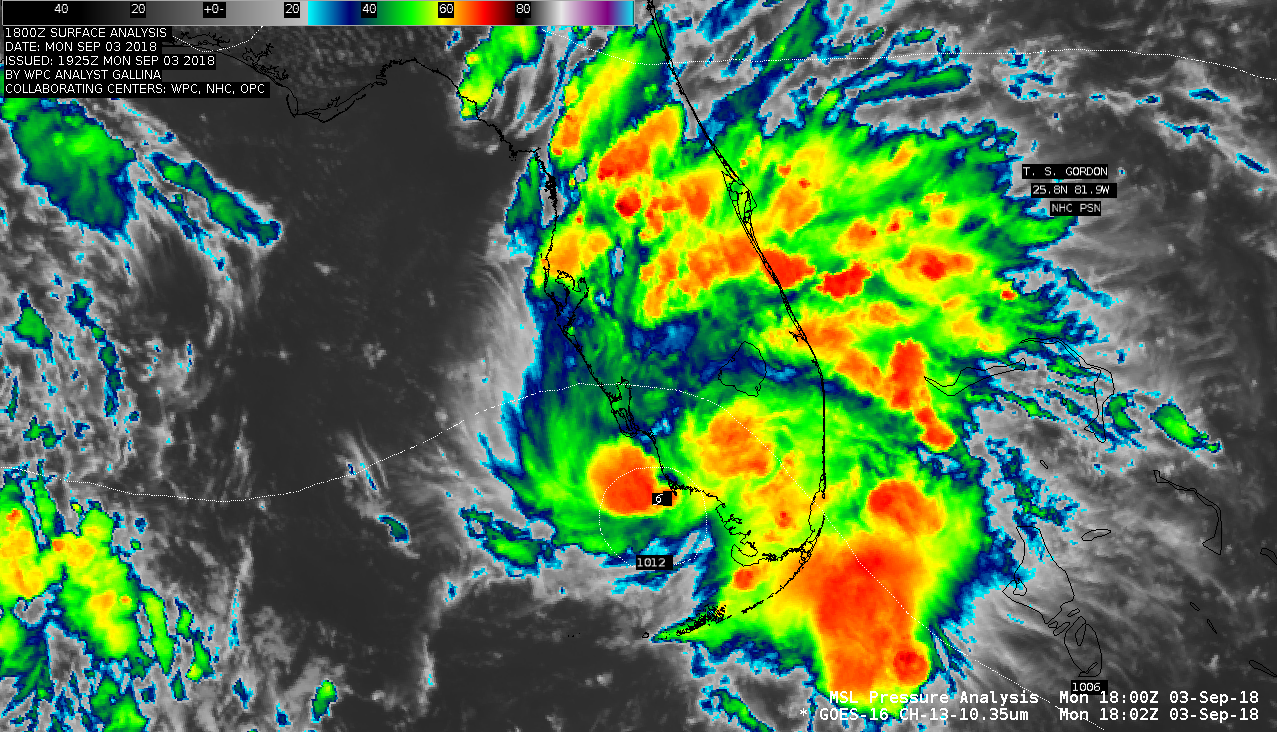
GOES-16 “Clean” Infrared Window (10.3 µm) images [click to play MP4 animation]
===== 04 September Update =====
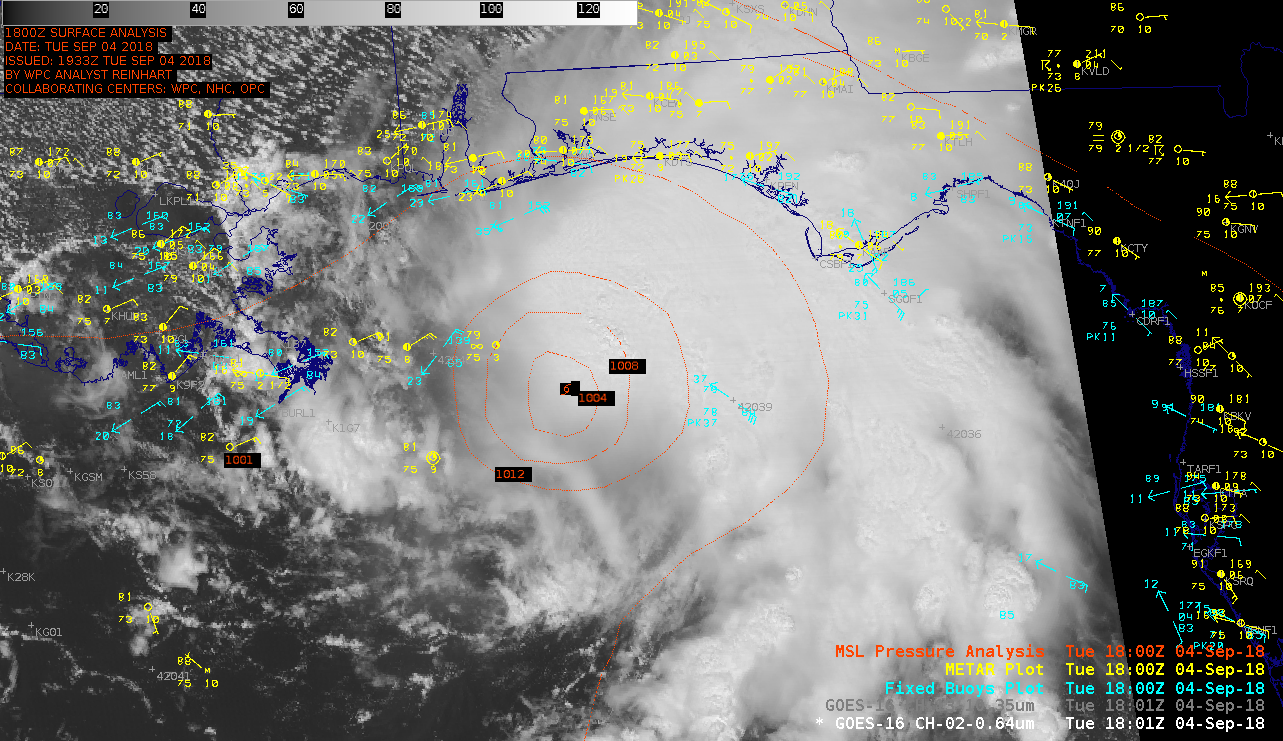
GOES-16 “Red” Visible (0.64 µm) images [click to play MP4 animation]
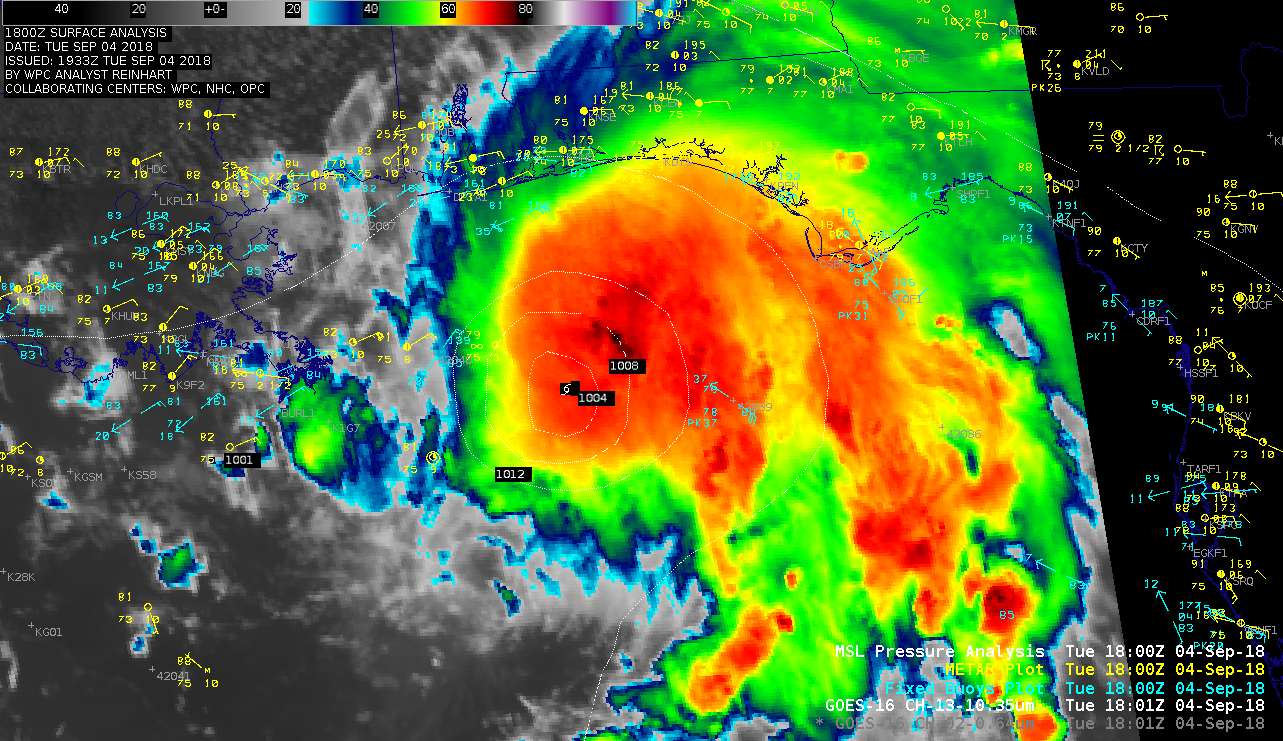
GOES-16 “Clean” Infrared Window (10.3 µm) images [click to play MP4 animation]
![GOES-16 Rain Rate product [click to play MP4 animation]](https://cimss.ssec.wisc.edu/satellite-blog/wp-content/uploads/sites/5/2018/09/gordon_rr-20180904_180035.png)
GOES-16 Rain Rate product [click to play MP4 animation]
![GOES-16 Rain Rate product with Metop ASCAT winds [click to enlarge]](https://cimss.ssec.wisc.edu/satellite-blog/wp-content/uploads/sites/5/2018/09/gordon_rr_ascat-20180904_161535.png)
GOES-16 Rain Rate product with Metop-A ASCAT winds [click to enlarge]