Flash flooding in southern Wisconsin
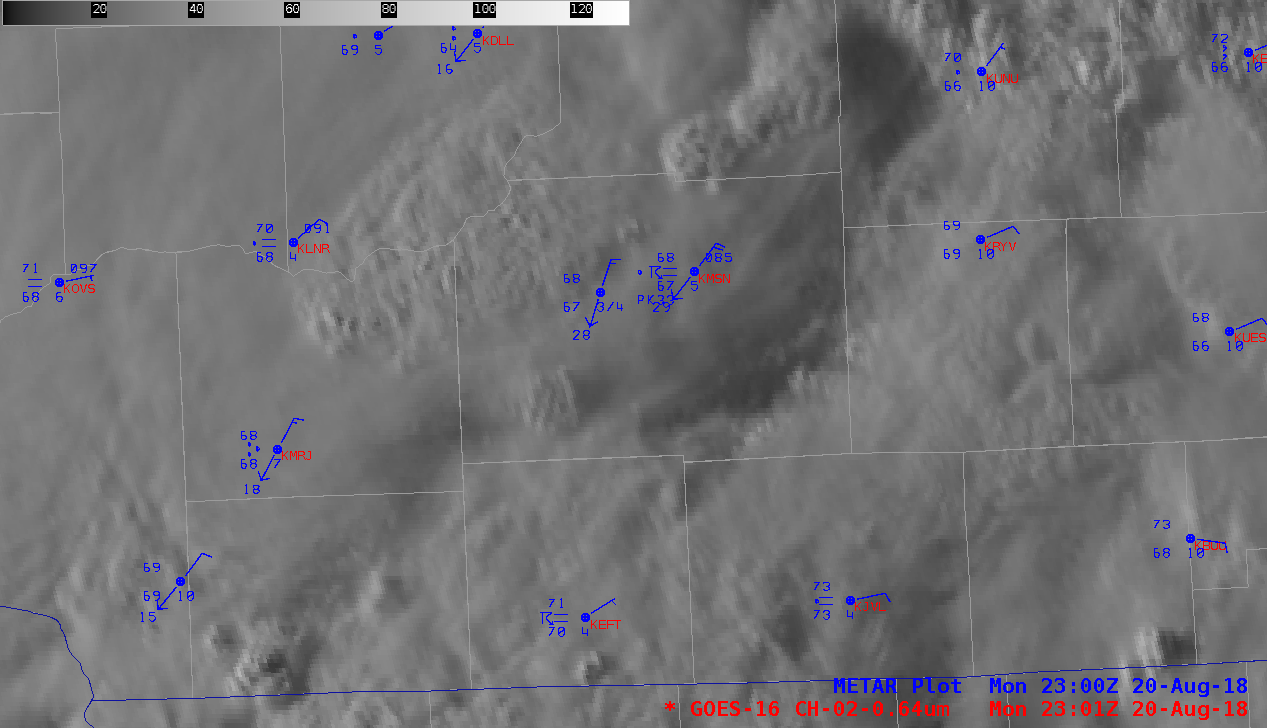
GOES-16 “Red” Visible (0.64 µm) images, with hourly plots of surface reports [click to play MP4 animation]
The corresponding 1-minute GOES-16 “Clean” Infrared Window (10.3 µm) imagery (below) showed that cloud-top brightness temperatures were generally in the -50º to -60ºC range with these initial areas of convection.
![GOES-16 Infrared images [click to play animation]](https://cimss.ssec.wisc.edu/satellite-blog/wp-content/uploads/sites/5/2018/08/msn_ir-20180820_230109.png)
GOES-16 “Clean” Infrared Window (10.3 µm) images, with hourly plots of surface reports [click to play animation]
GOES-16 “Clean” Infrared Window (10.3 µm) images, with hourly plots of surface reports [click to play MP4 animation]
![GOES-16 Mid-level Water Vapor (6.9 µm) images [click to play MP4 animation]](https://cimss.ssec.wisc.edu/satellite-blog/wp-content/uploads/sites/5/2018/08/msn_wv-20180820_165731.png)
GOES-16 Mid-level Water Vapor (6.9 µm) images [click to play MP4 animation]
![Composite of GOES-16 Water Vapor (6.9 µm) imagery and Total Precipitable Water product [click to play MP4 animation]](https://cimss.ssec.wisc.edu/satellite-blog/wp-content/uploads/sites/5/2018/08/msn_tpw-20180820_200732.png)
Composite of GOES-16 Water Vapor (6.9 µm) imagery and Total Precipitable Water derived product [click to play MP4 animation]
![GOES-16 AllSky Total Precipitable Water product [click to play animation | MP4]](https://cimss.ssec.wisc.edu/satellite-blog/wp-content/uploads/sites/5/2018/08/180820_21_goes16_allsky_tpw_anim.gif)
GOES-16 All-Sky Total Precipitable Water product [click to play animation | MP4]
![Aqua MODIS Total Precipitable Water product [click to enlarge]](https://cimss.ssec.wisc.edu/satellite-blog/wp-content/uploads/sites/5/2018/08/MODIS_TPW_20180820_1943.png)
Aqua MODIS Total Precipitable Water product [click to enlarge]
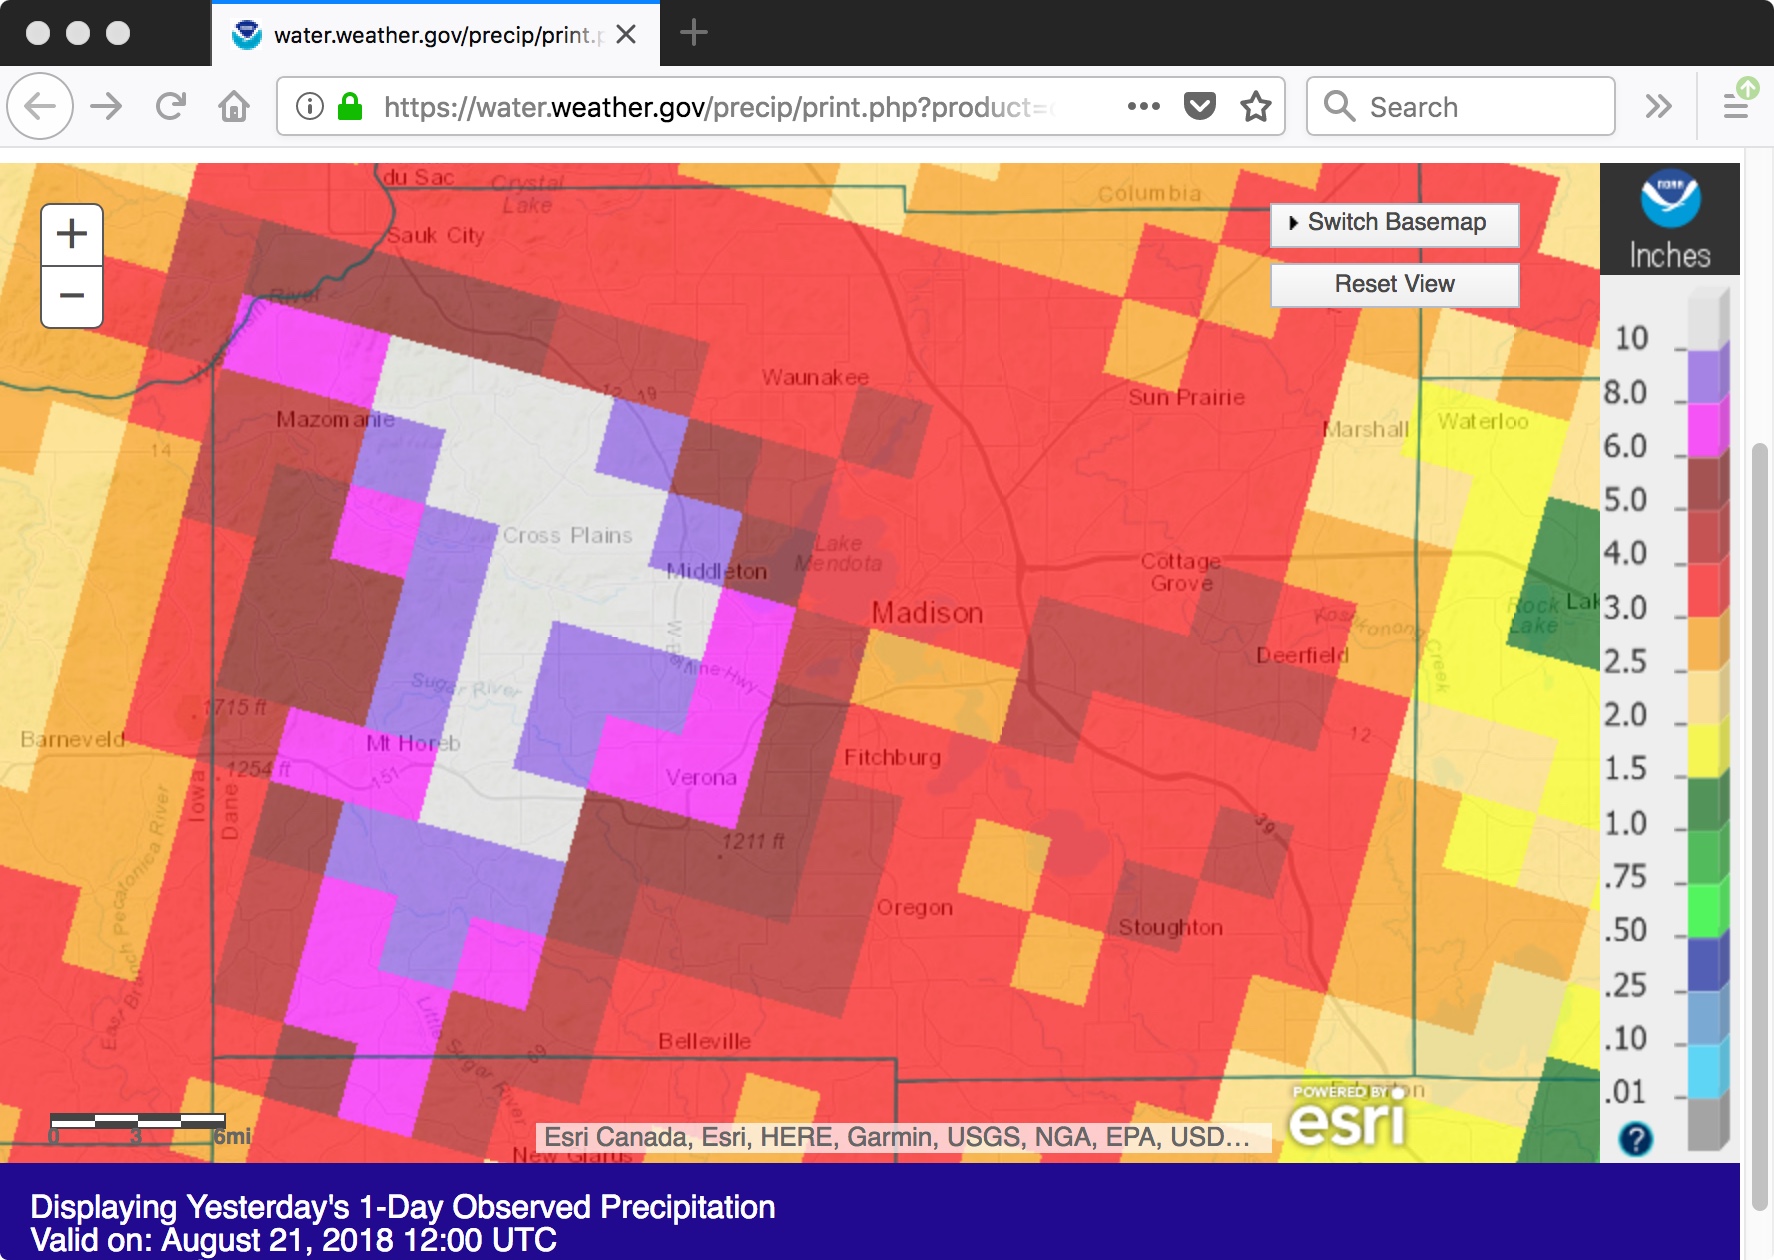
Pheasant Branch Creek flows into the northwest corner of Lake Mendota, which crested at 852.3 feet on the morning of 22 August. This was the third highest lake elevation on record — and the highest level on record for so late in the calendar year. Portions of the University of Wisconsin – Madison campus adjacent to the lake experienced some impacts due to the high water, as shown on the map below. There were also several road closures in Madison due to high water.
![Map of flood impacts for portions of the UW-Madison campus adjacent to the southwestern shoreline of Lake Mendota [click to enlarge]](https://cimss.ssec.wisc.edu/satellite-blog/wp-content/uploads/sites/5/2018/08/180821_Lake_Mendota_flood_area.jpeg)
Map of flood impacts for portions of the UW-Madison campus adjacent to the southwestern shoreline of Lake Mendota [click to enlarge]
100-YEAR #FLOOD LEVEL REACHED!
Lake #Waubesa reached a level of 847.01′ late this afternoon. This surpasses the 100-year level of 847.00 feet. Waubesa’s record level was set on June 17, 2008 at 847.22 feet. Other area lakes are also close to 100-year levels. #MadisonWI #yahara pic.twitter.com/FfroP567nh— Clean Lakes Alliance (@cleanlakes) August 22, 2018