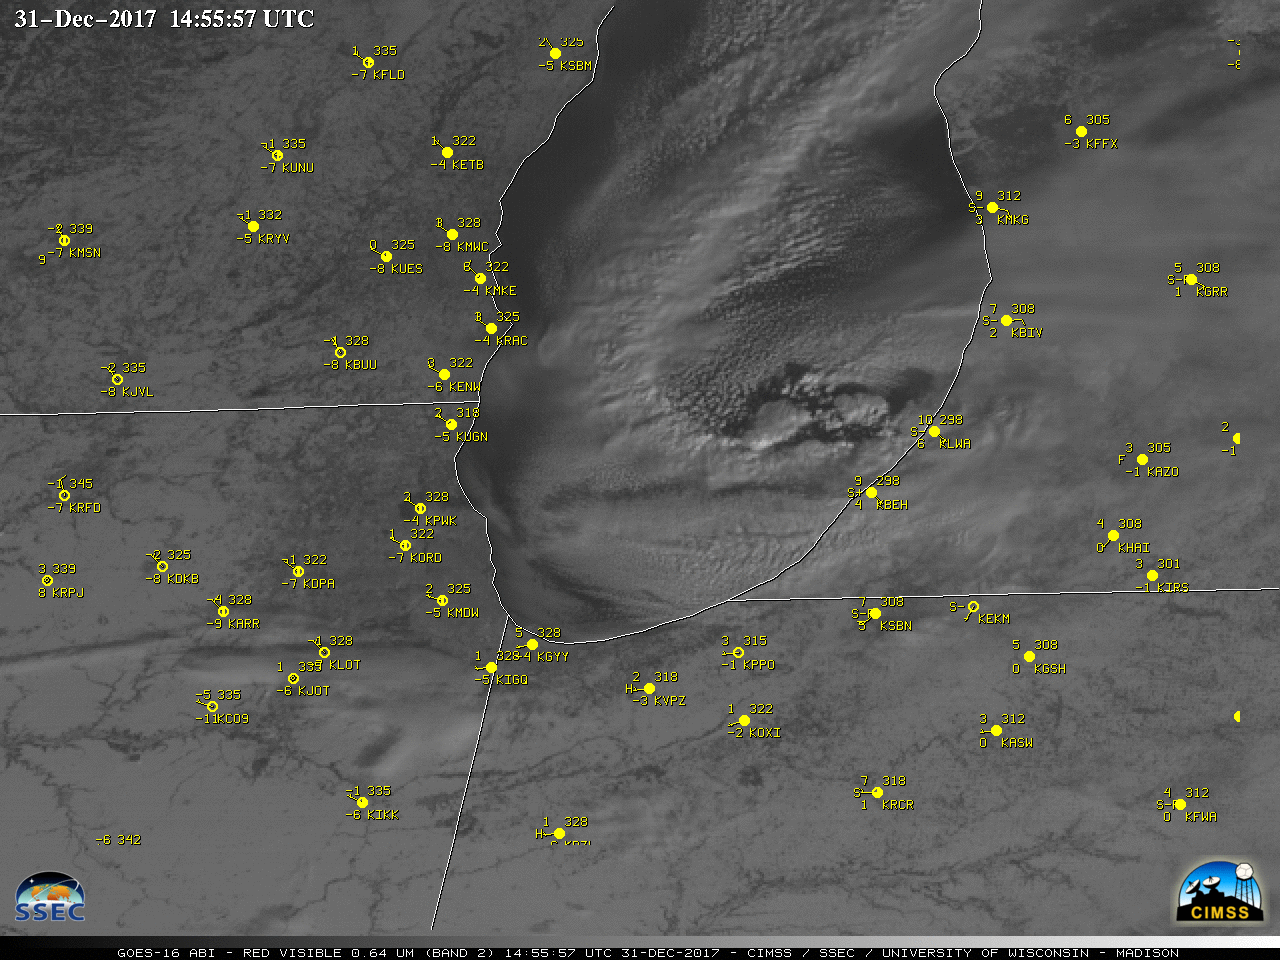
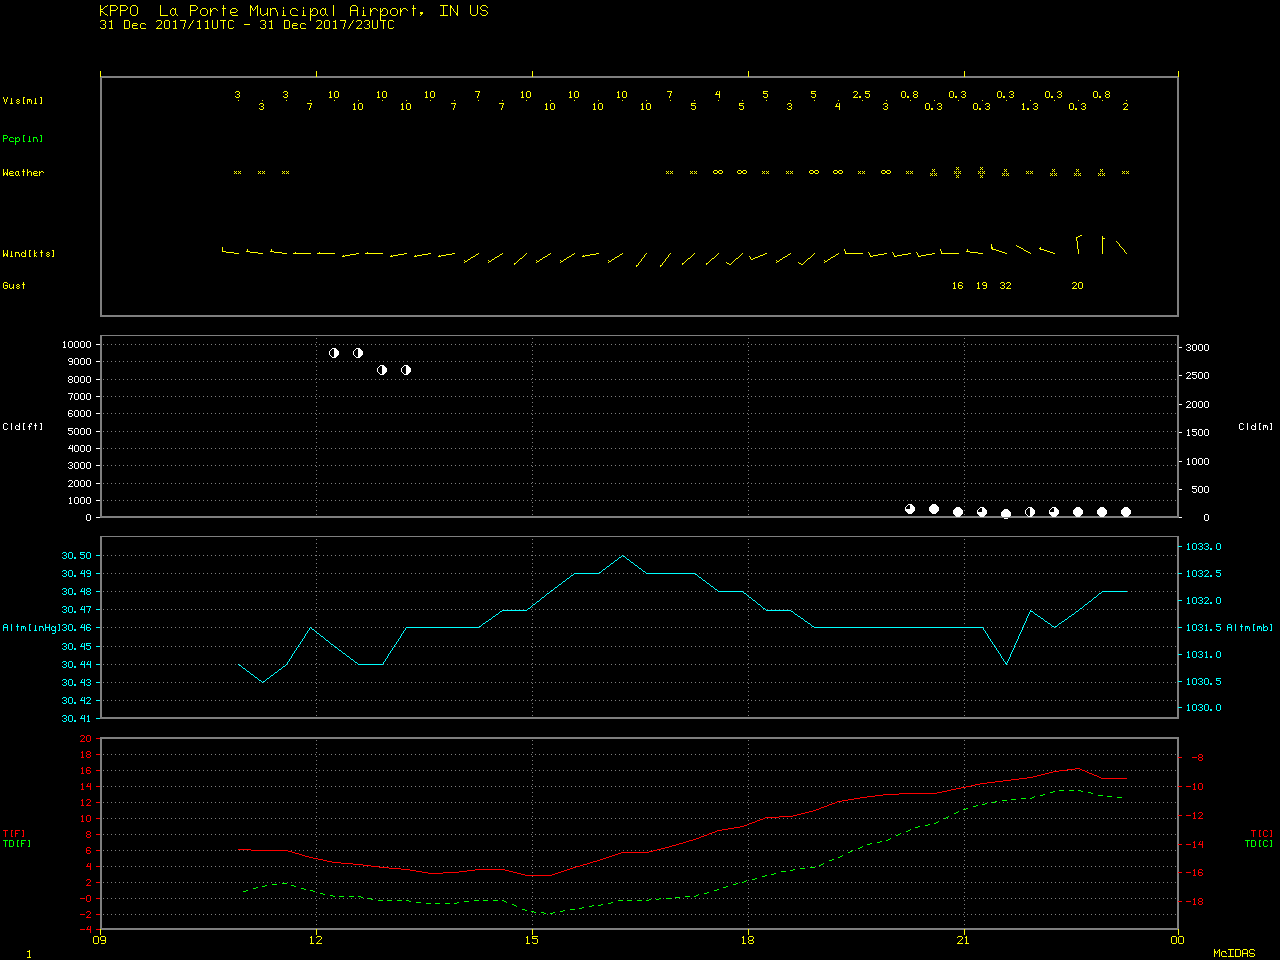
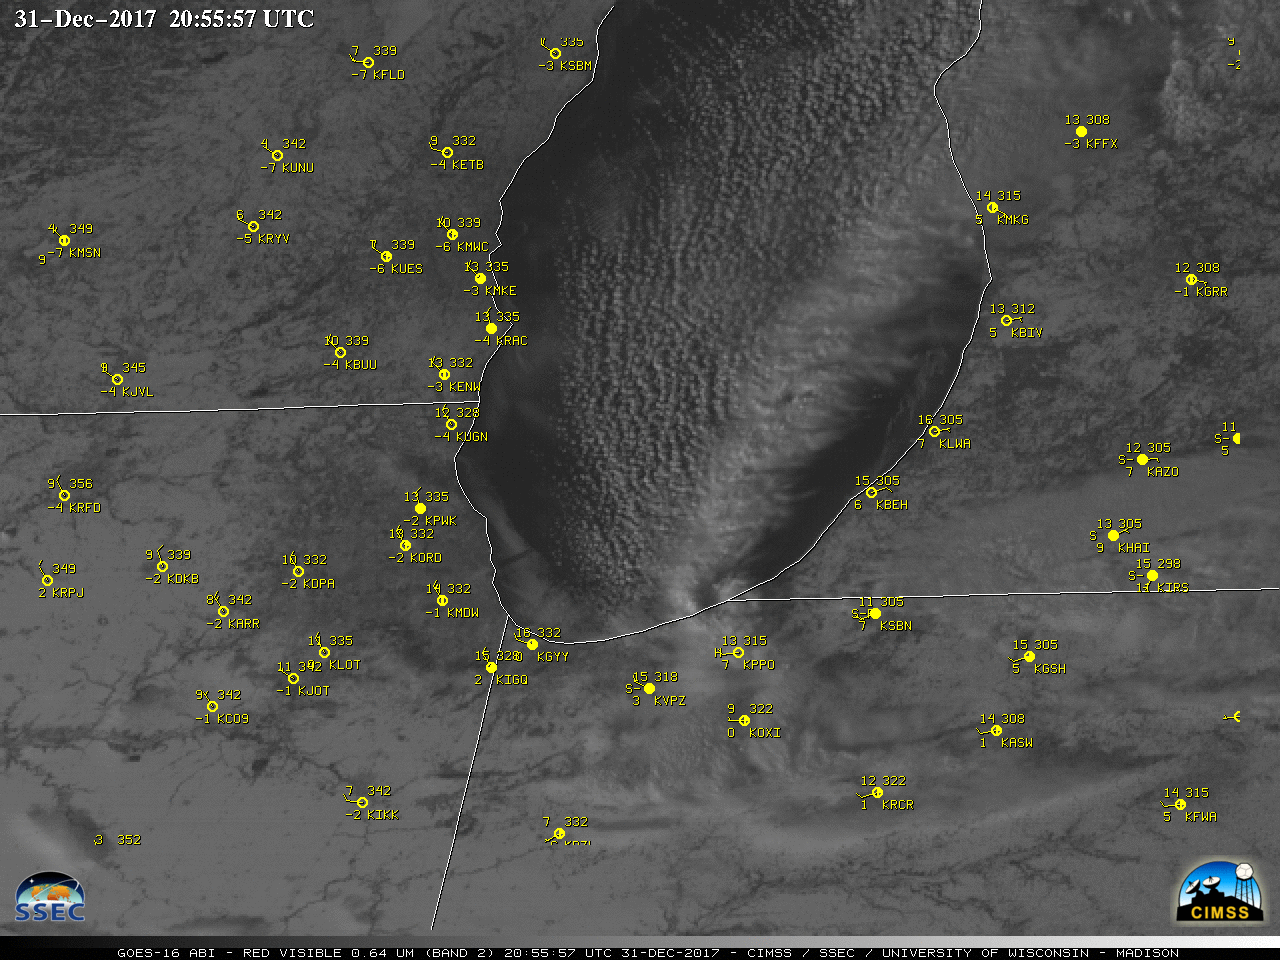
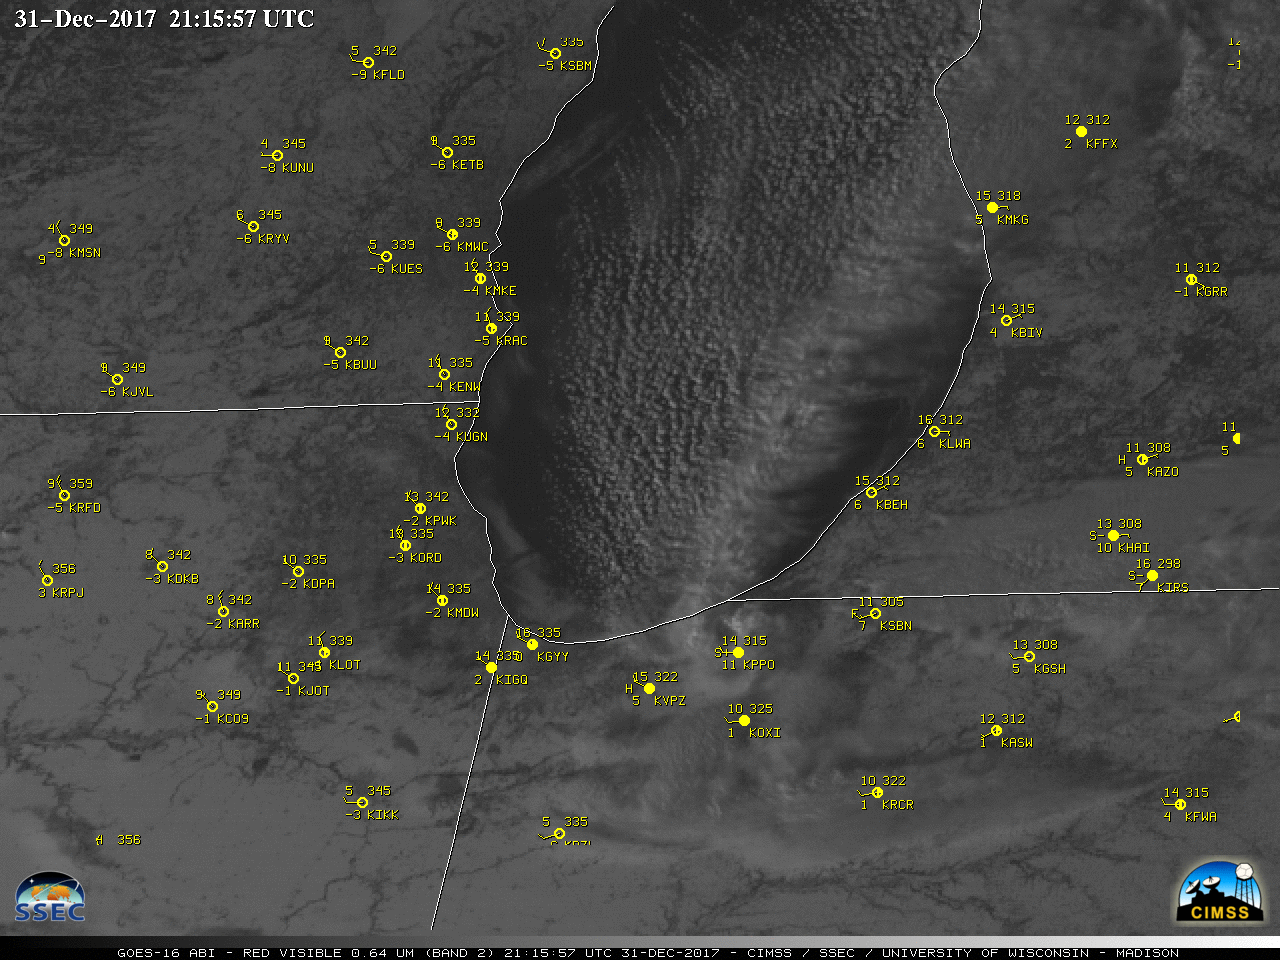
Lake Michigan Mesovortex
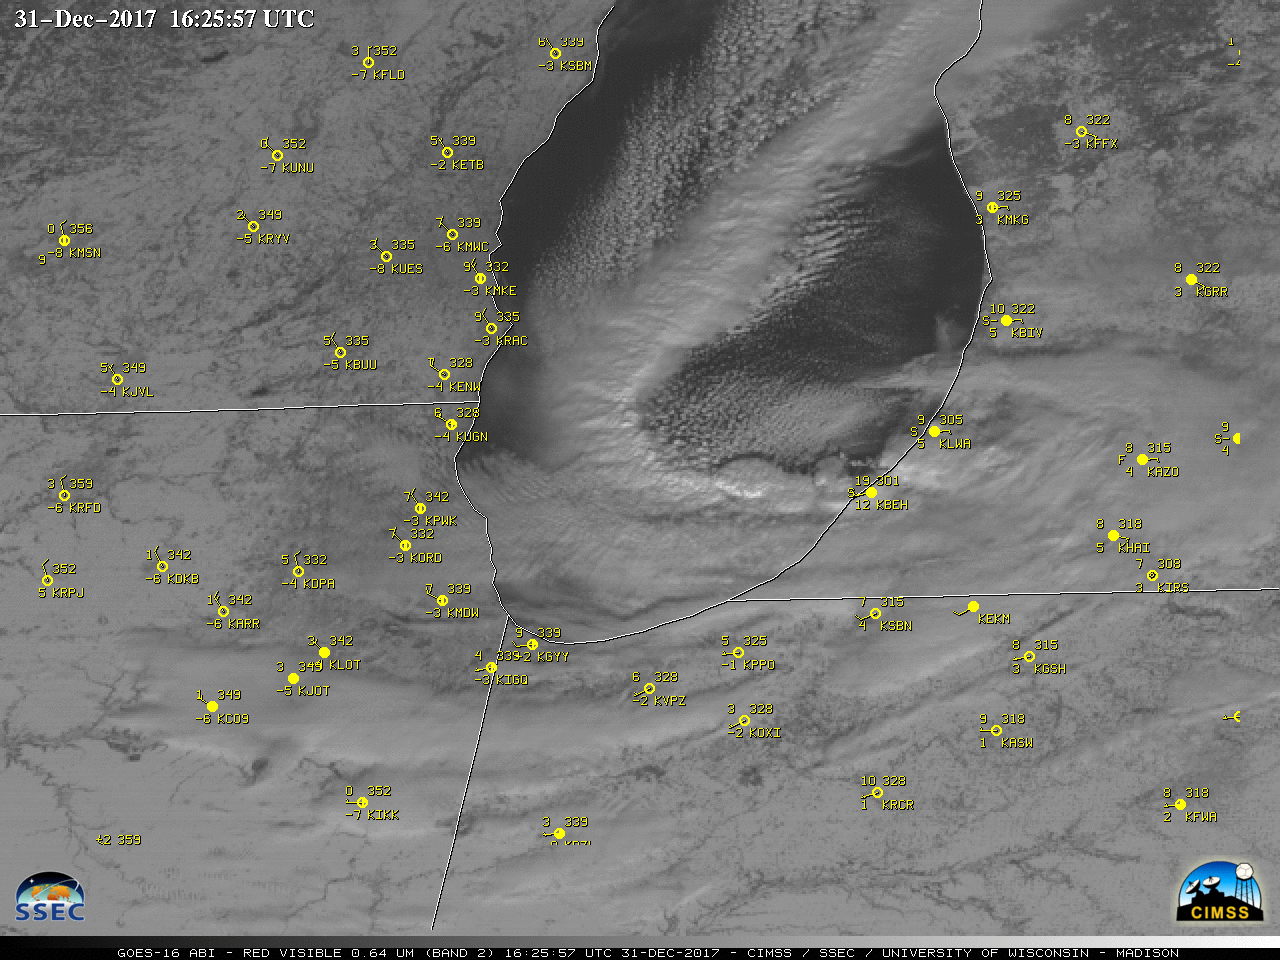
1-minute GOES-16 “Red” Visible (0.64 µm) images, with hourly surface reports plotted in yellow [click to play MP4 animation]
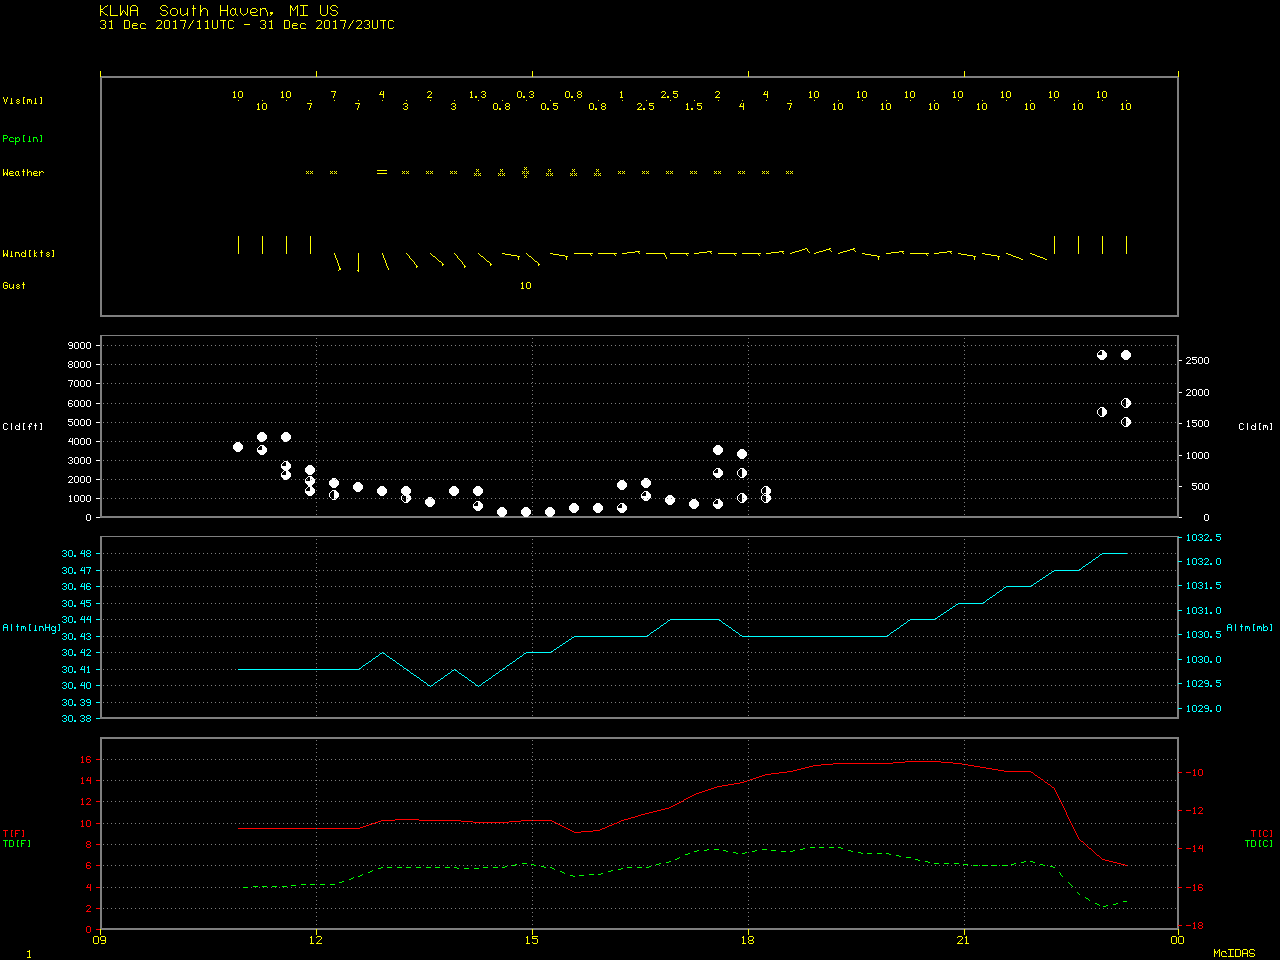
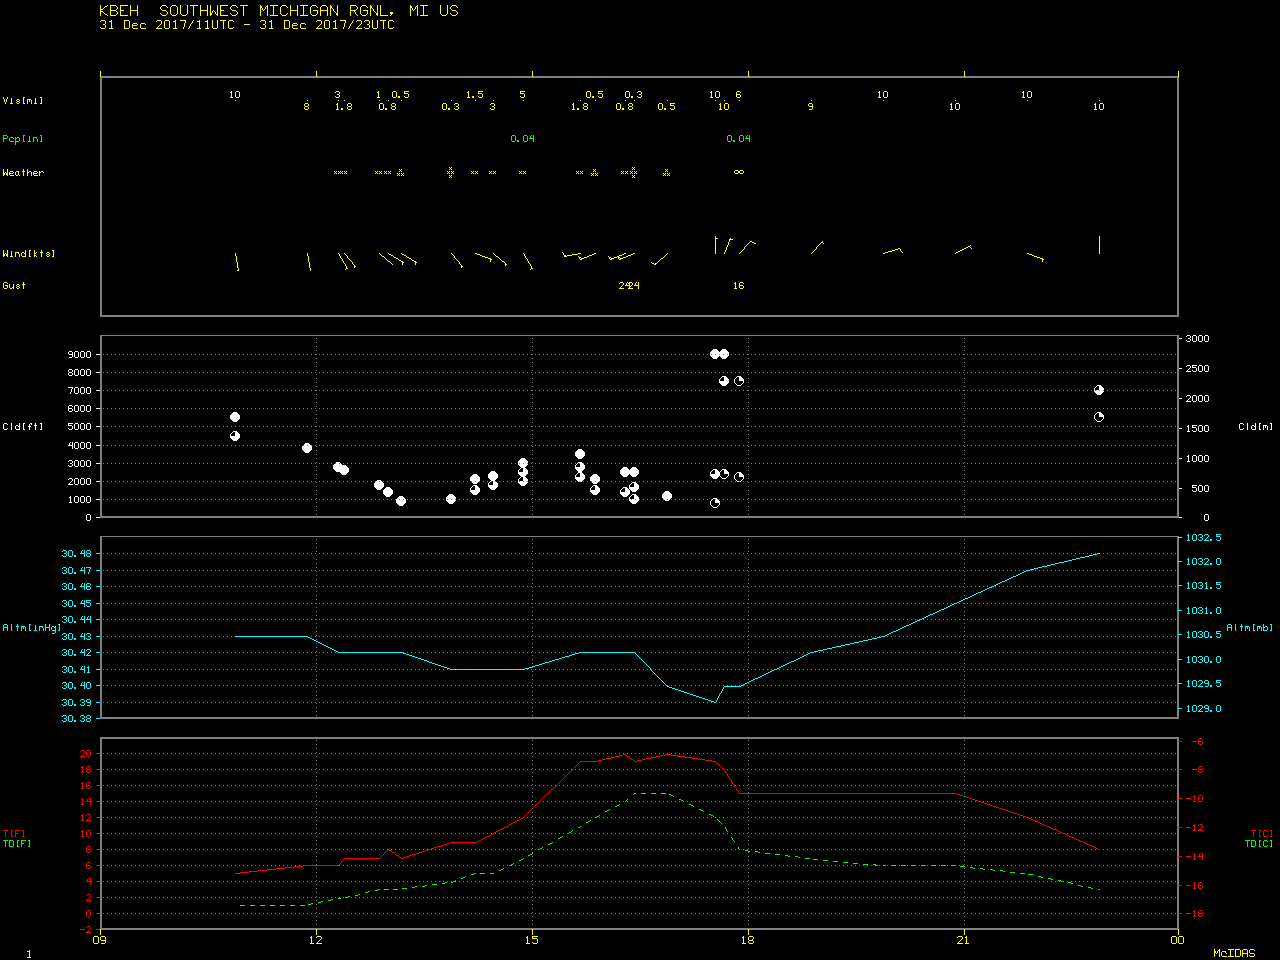
Comparisons of POES AVHRR/Terra MODIS/Suomi NPP Infrared (10.8 µm/11.0 µm/11.45 µm) and Visible (0.86 µm/0.65 µm/0.64 µm) images along with an overlay of the corresponding Real-Time Mesoscale Analysis (RTMA) surface winds (below) provided views of the mesovortex at 1522 UTC, 1714 UTC and 1852 UTC, respectively.
![POES AVHRR Infrared (10.8 µm) and Visible (0.86 µm) images at 1522 UTC, with 15 UTC RTMA surface winds [click to enlarge]](https://cimss.ssec.wisc.edu/satellite-blog/wp-content/uploads/sites/5/2017/12/171231_1522utc_poes_avhrr_Infrared_visible_rtma_winds_Lake_Michigan_mesovortex_anim.gif)
POES AVHRR Infrared (10.8 µm) and Visible (0.86 µm) images at 1522 UTC, with 15 UTC RTMA surface winds [click to enlarge]
![Terra MODIS Infrared (11.0 µm) and Visible (0.65 µm) images at 1714 UTC, with 17 UTC RTMA surface winds [click to enlarge]](https://cimss.ssec.wisc.edu/satellite-blog/wp-content/uploads/sites/5/2017/12/171231_1714utc_terra_modis_infrared_visible_rtma_winds_Lake_Michigan_mesovortex_anim.gif)
Terra MODIS Infrared (11.0 µm) and Visible (0.65 µm) images at 1714 UTC, with 17 UTC RTMA surface winds [click to enlarge]
![Suomi NPP Infrared (11.45 µm) and Visible (0.64 µm) images at 1852 UTC, with 19 UTC RTMA surface winds [click to enlarge]](https://cimss.ssec.wisc.edu/satellite-blog/wp-content/uploads/sites/5/2017/12/171231_1852utc_suomi_npp_viirs_infrared_visible_rtma_winds_Lake_Michigan_mesovortex_anim.gif)
Suomi NPP Infrared (11.45 µm) and Visible (0.64 µm) images at 1852 UTC, with 19 UTC RTMA surface winds [click to enlarge]
![Suomi NPP VIIRS Infrared (11.45 µm) and Day/Night Band (0.7 µm) images at 0729 UTC, with 07 UTC RTMA surface winds [click to enlarge]](https://cimss.ssec.wisc.edu/satellite-blog/wp-content/uploads/sites/5/2017/12/171231_0729utc_suomi_npp_viirs_Infrared_DayNightBand_rtma_winds_Lake_Michigan_mesovortex_anim.gif)
Suomi NPP VIIRS Infrared (11.45 µm) and Day/Night Band (0.7 µm) images at 0729 UTC, with 07 UTC RTMA surface winds [click to enlarge]
![Terra MODIS true-color and false-color images over southern Lake Michigan [click to enlarge]](https://cimss.ssec.wisc.edu/satellite-blog/wp-content/uploads/sites/5/2017/12/171231_terra_modis_truecolor_falsecolor_Lake_Michigan_anim.gif)
Terra MODIS true-color and false-color images over southern Lake Michigan [click to enlarge]