VIIRS composite flood products over Bangladesh and India
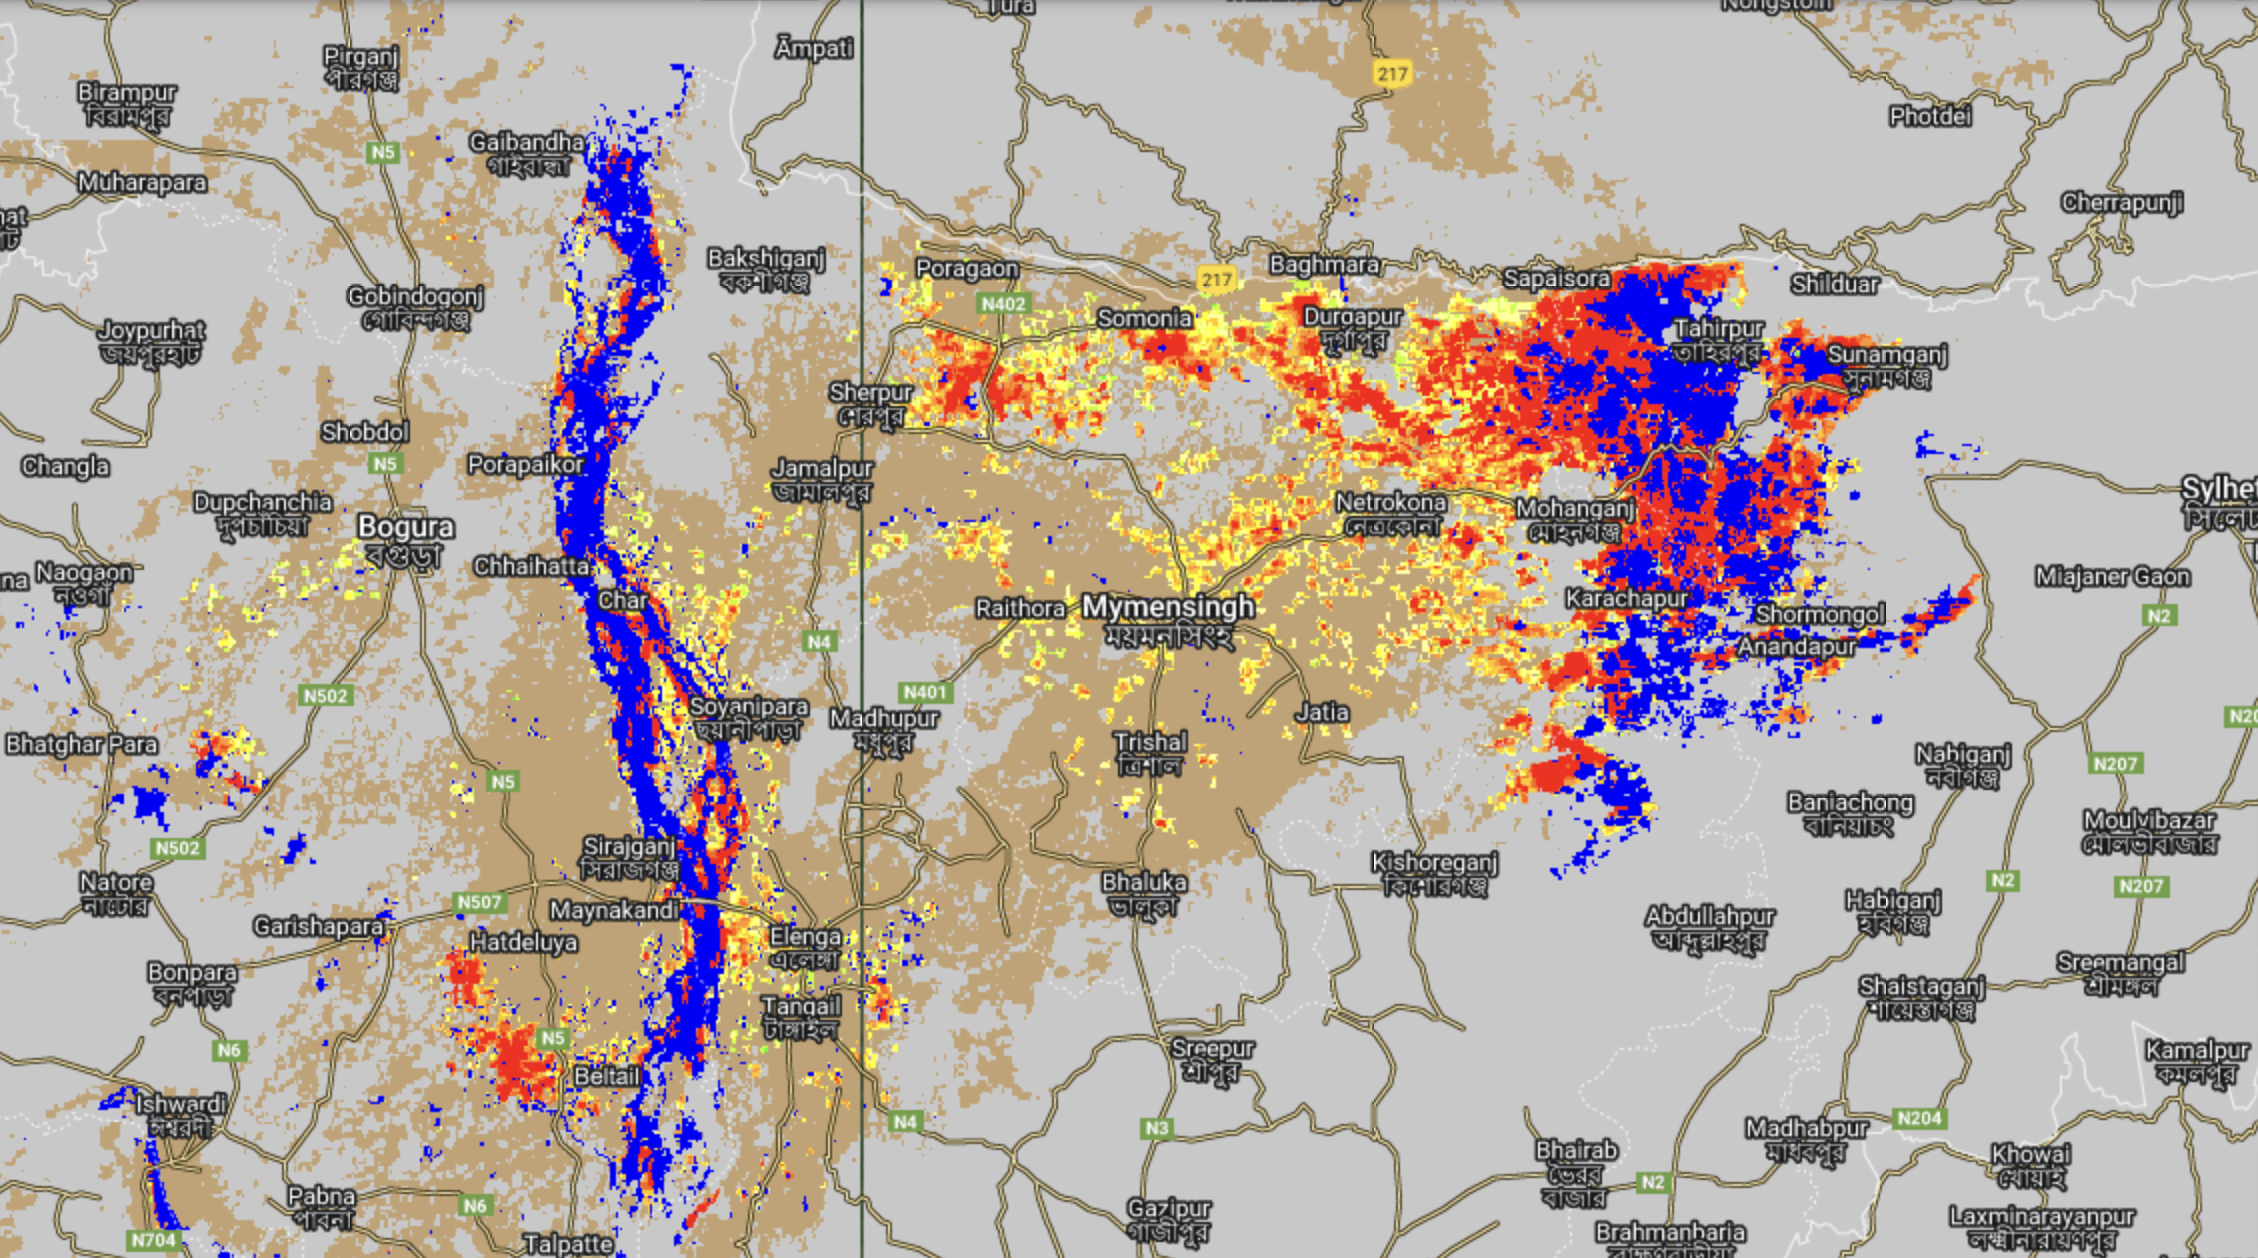
The five-day composite of the VIIRS flood product is just one flood product that can be viewed in RealEarth. VIIRS is an instrument aboard SNPP and NOAA-20, which are low earth orbiting satellites. This means that while only two daytime observations may be retrieved per day over a given region,... Read More

