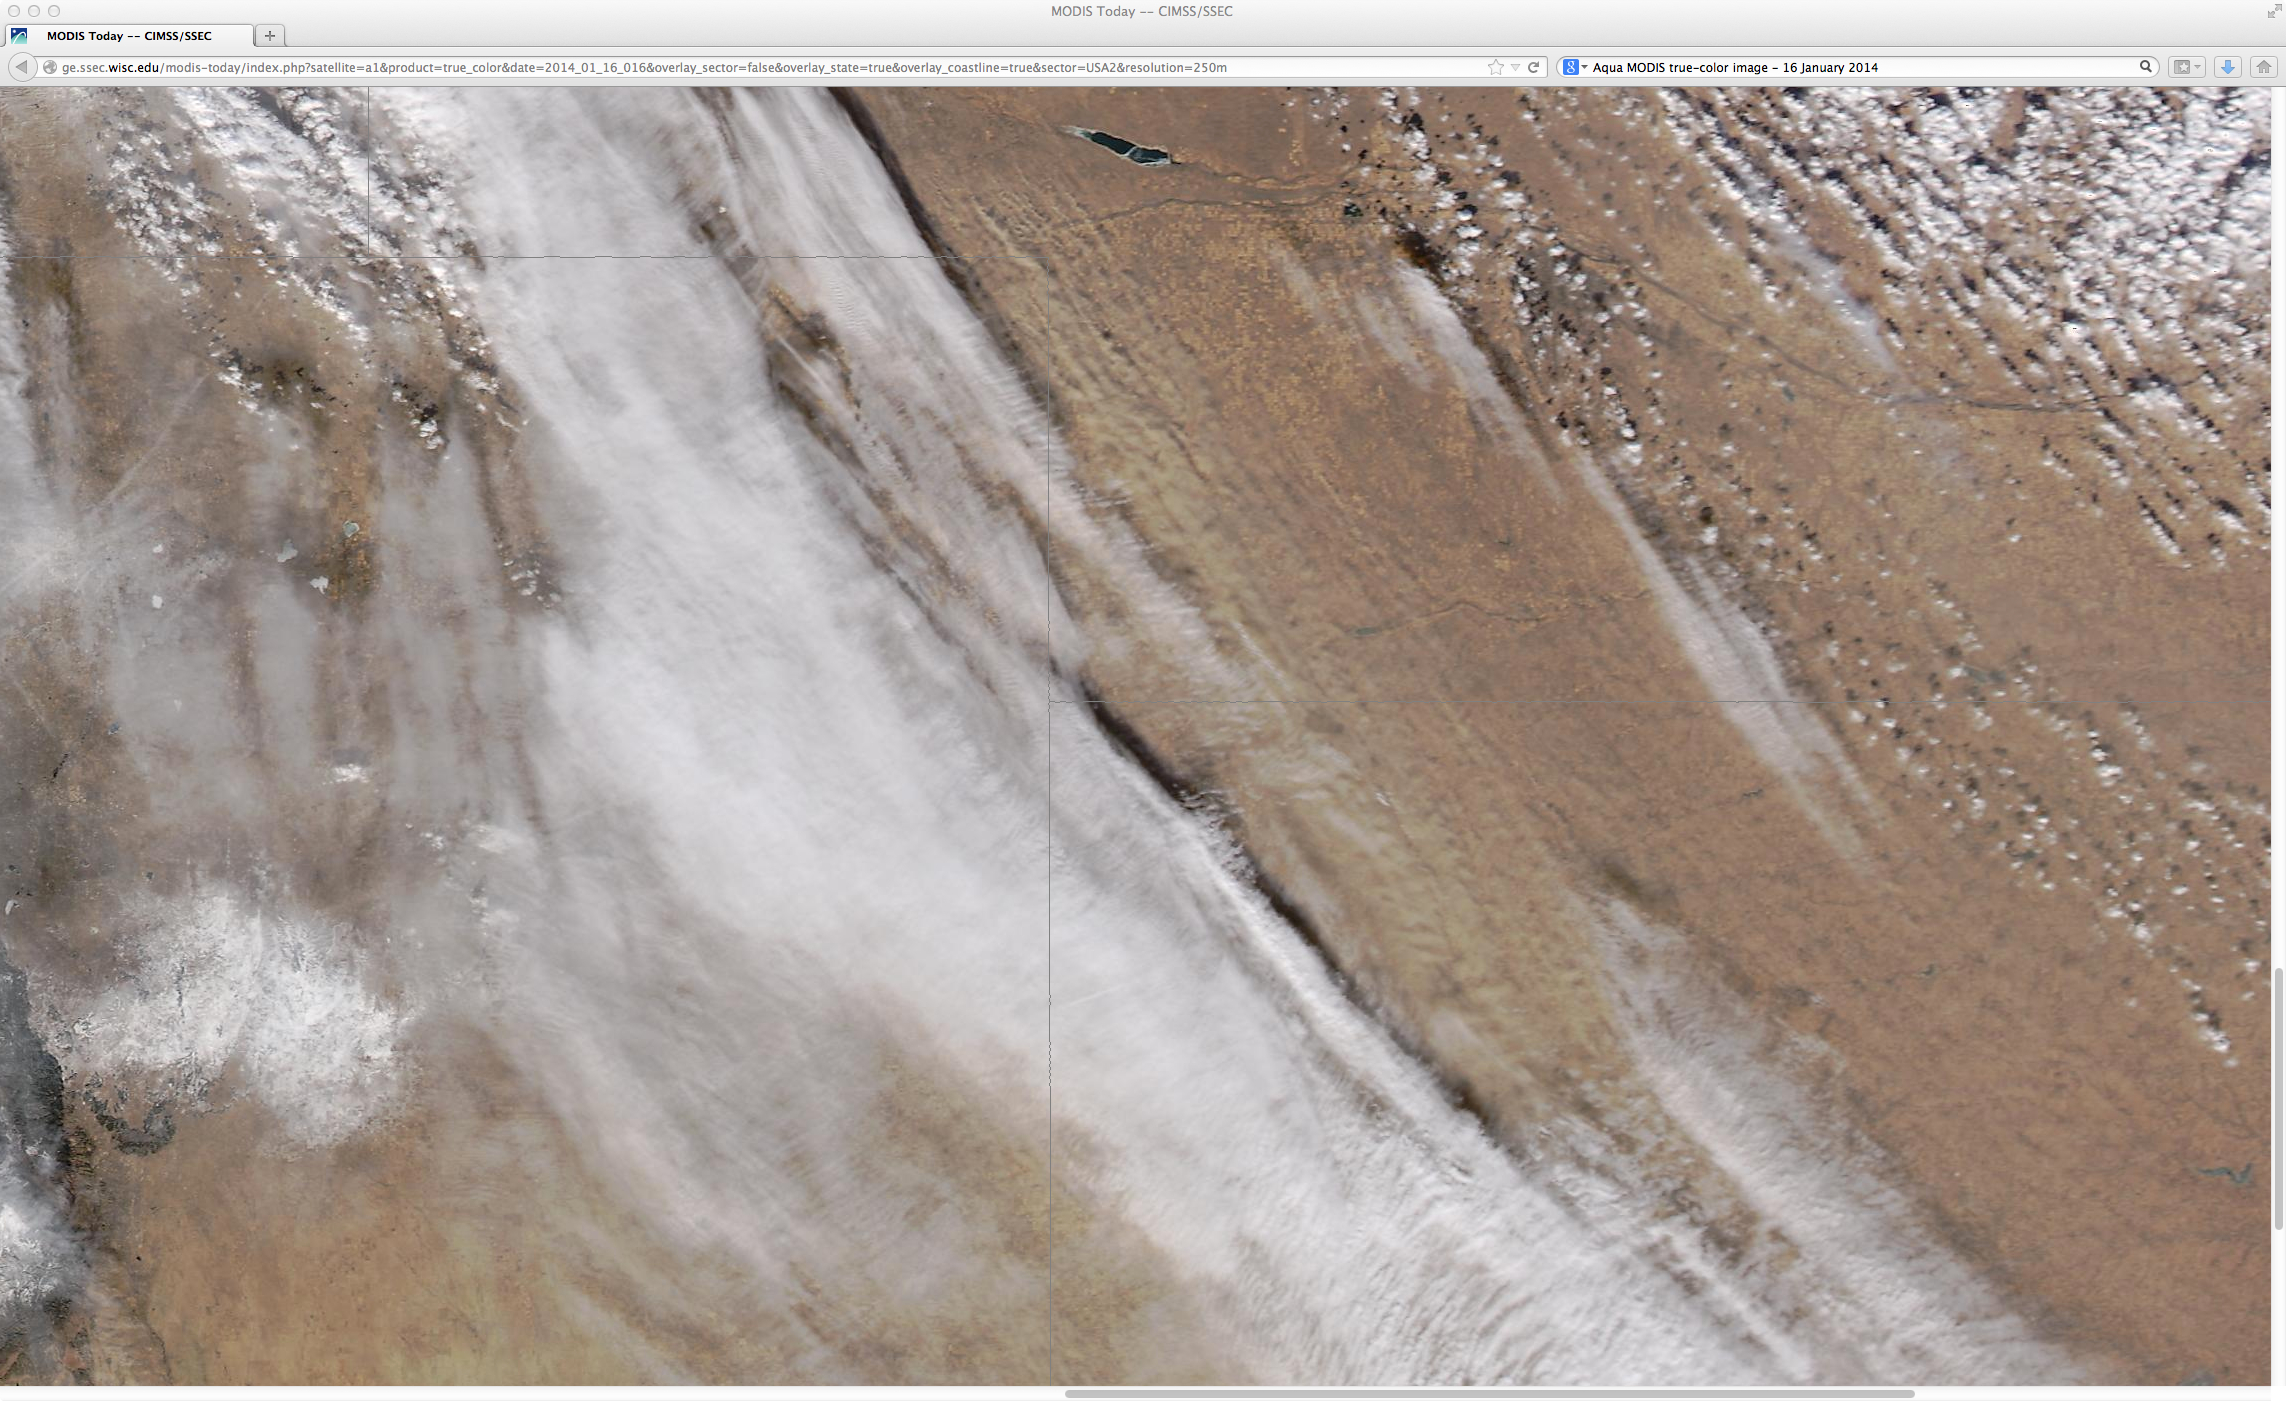
“Industrial-enhanced” snow in Texas
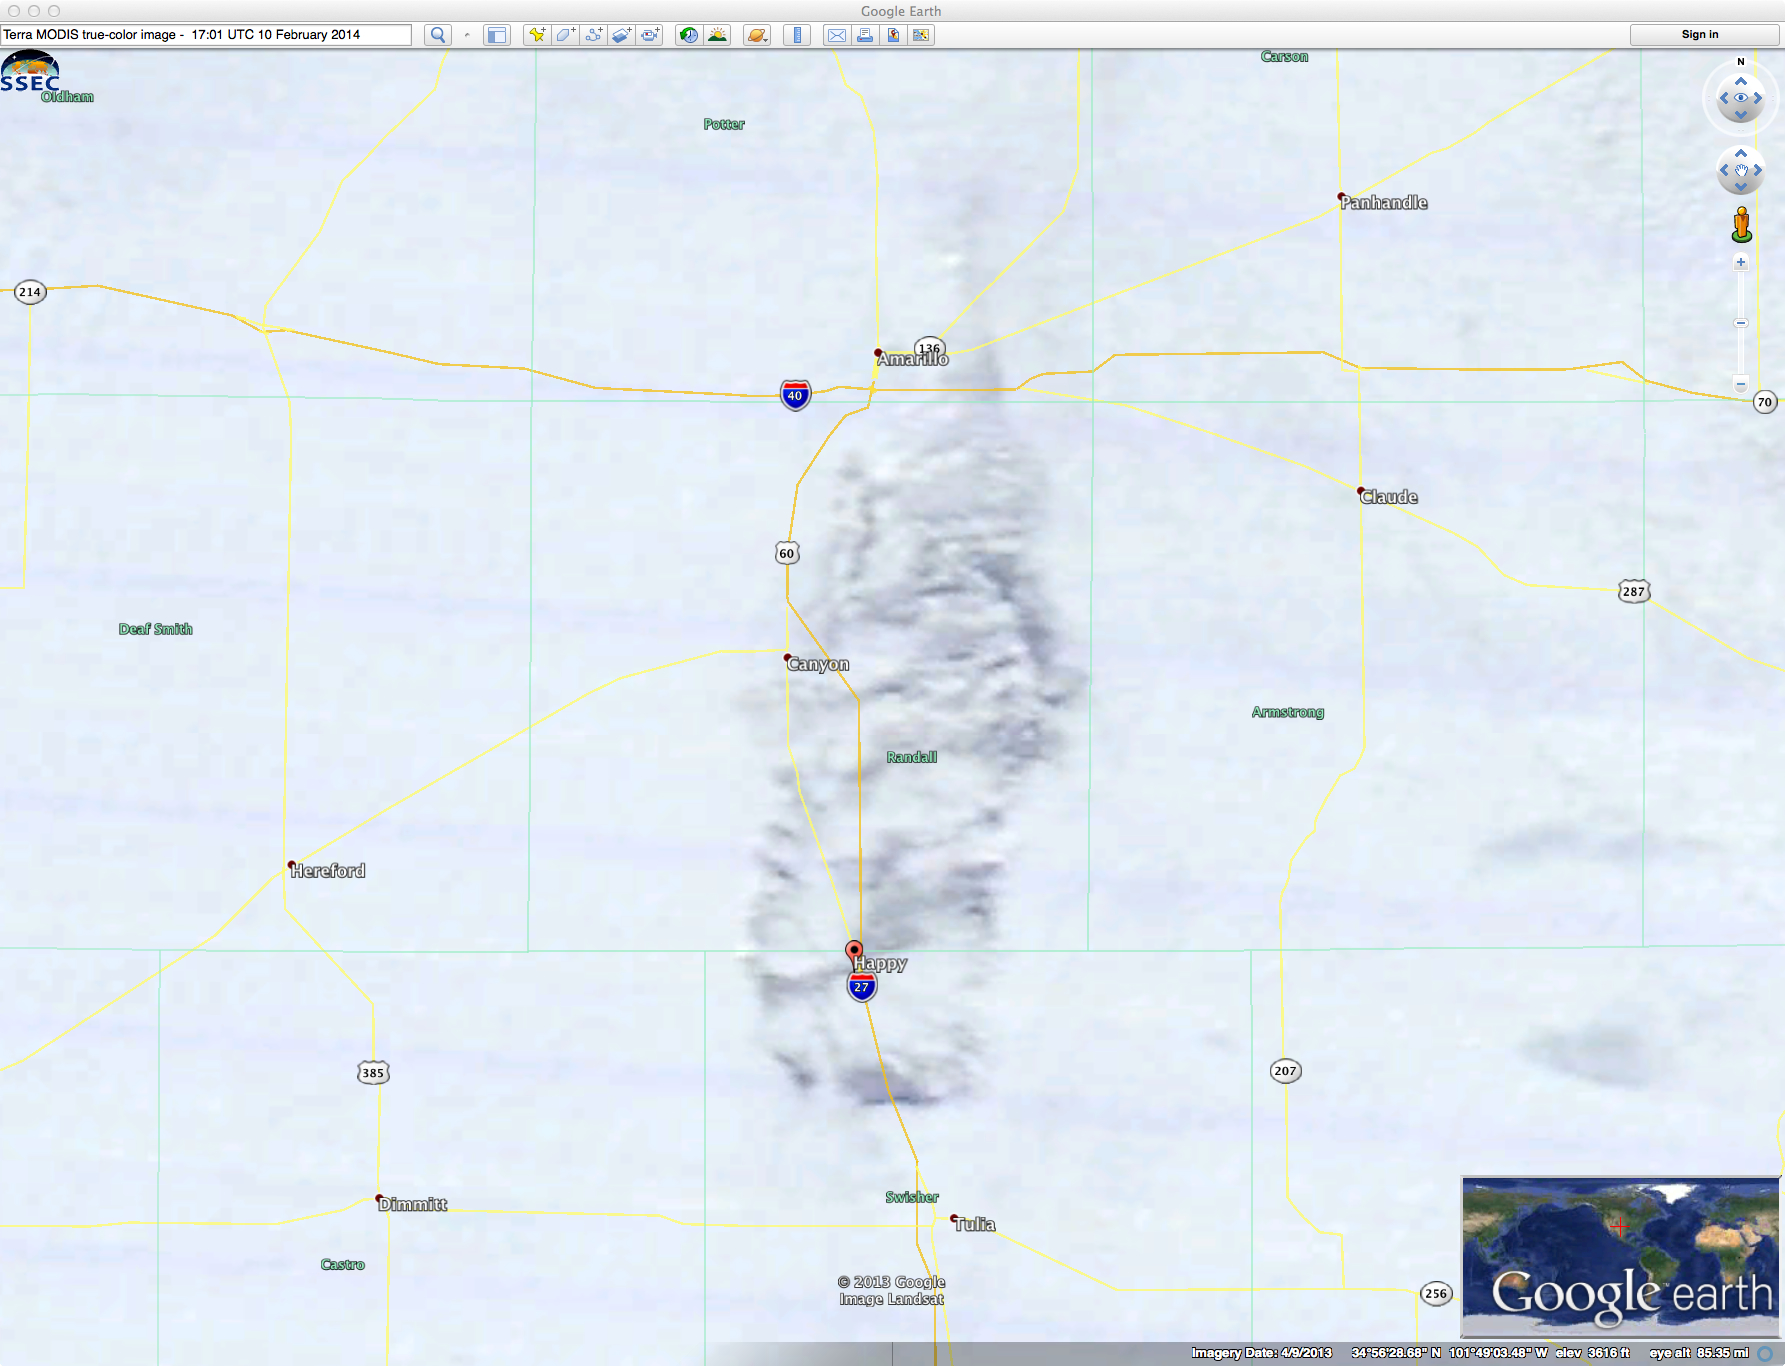
Examples of “industrial-enhanced snow” were seen in the Texas Panhandle region on 10 February 2014. In the overnight hours, areas downwind of agricultural plants near Borger (KBGD) received anywhere from 3.0 to 4.3 inches of snowfall. During the following morning and early afternoon... Read More