3 consecutive days with Canadian wildfire smoke across much of the north-central US
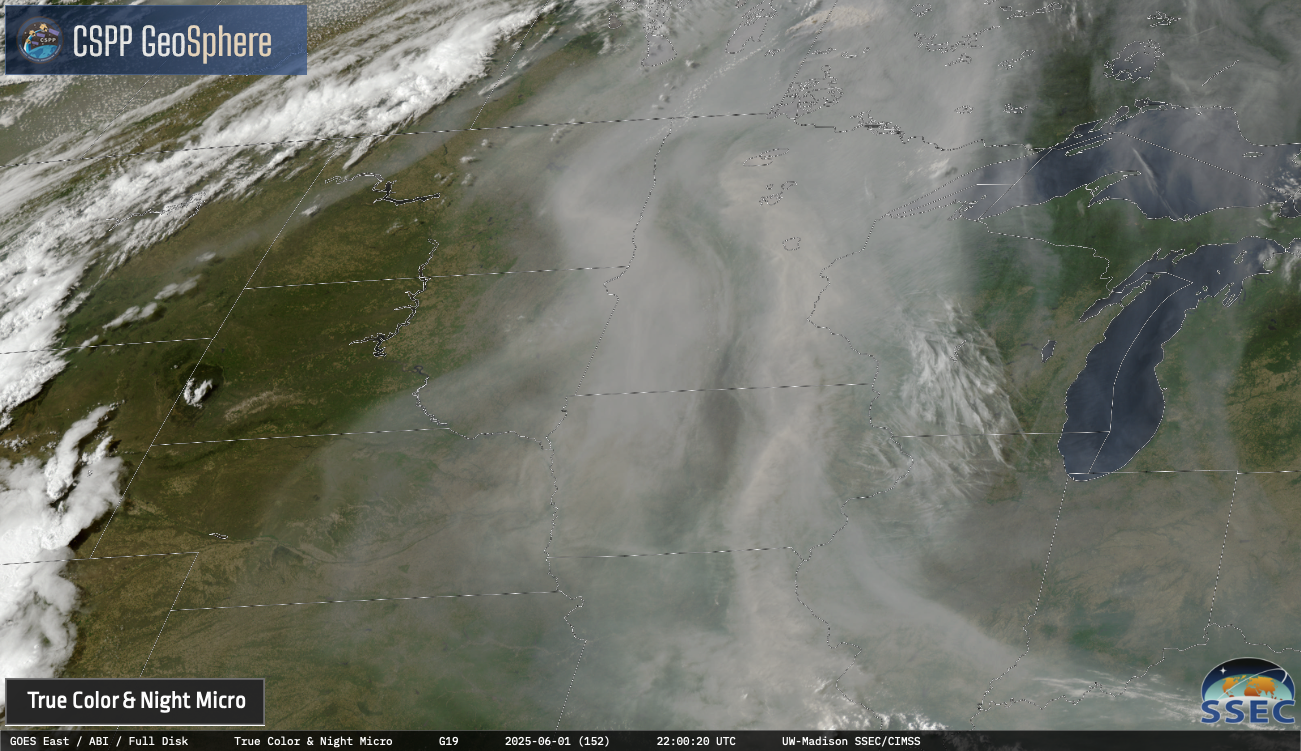
With numerous wildfires burning across the boreal forest regions of Alberta/Saskatchewan/Manitoba during late May 2025, dense smoke began to move southward across much of the north-central US beginning on 30 May. GOES-19 (GOES-East) True Color RGB images along with the Aerosol Optical Depth (AOD) derived product from the CSPP GeoSphere site (above) showed the... Read More
