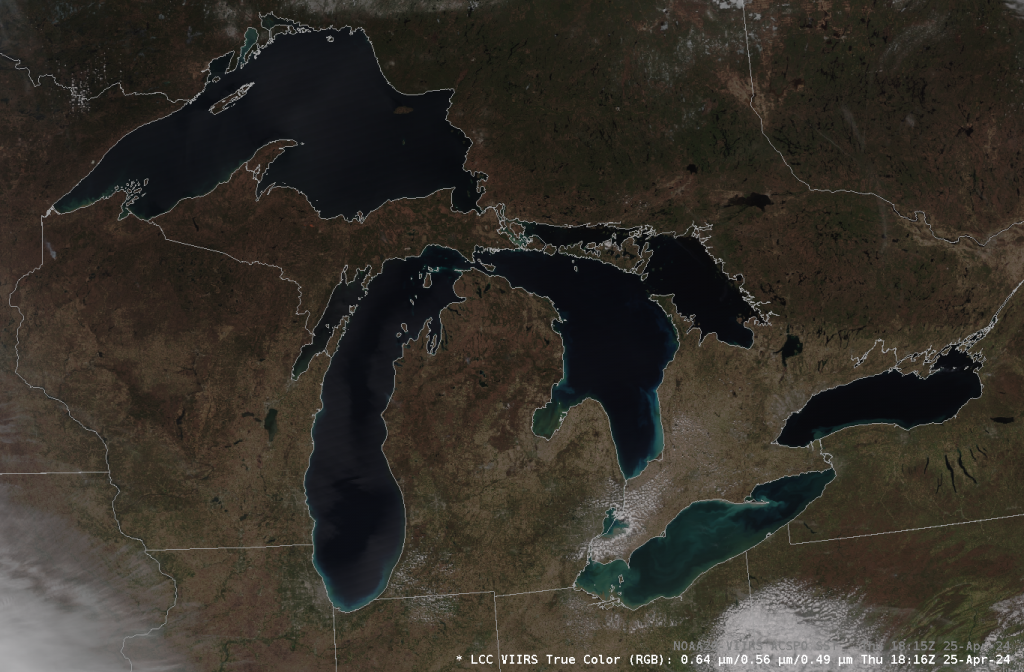
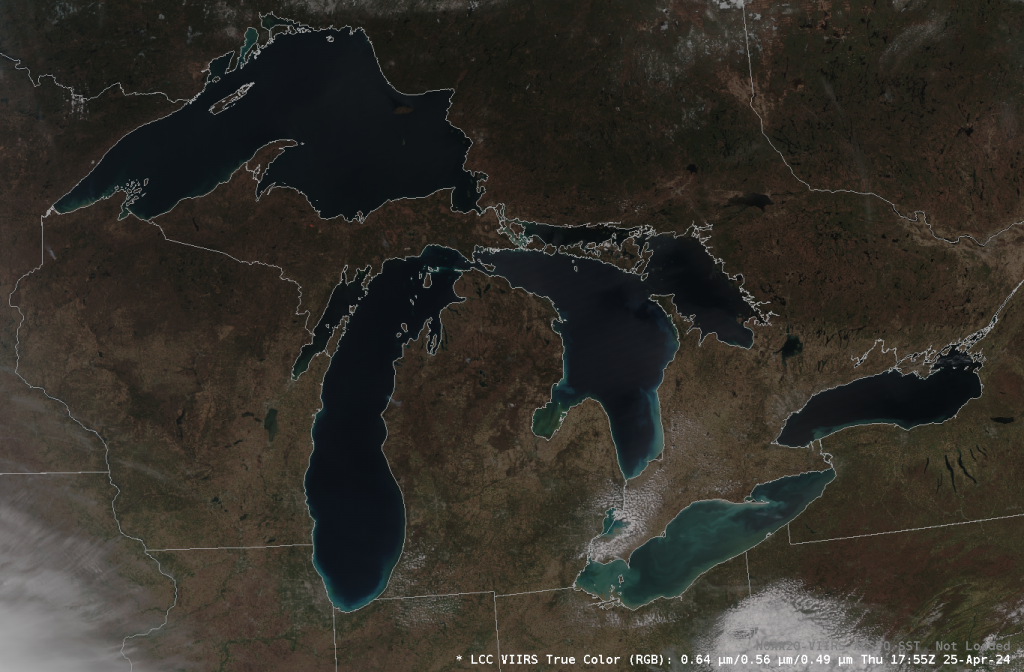
High Pressure over the Great Lakes on 25 April meant a spectacular true-color view of the 5 Great Lakes (apologies to Lake Champlain) by the VIIRS instruments on NOAA-20. A similar view was recorded at 1755 UTC by Suomi-NPP, shown below.
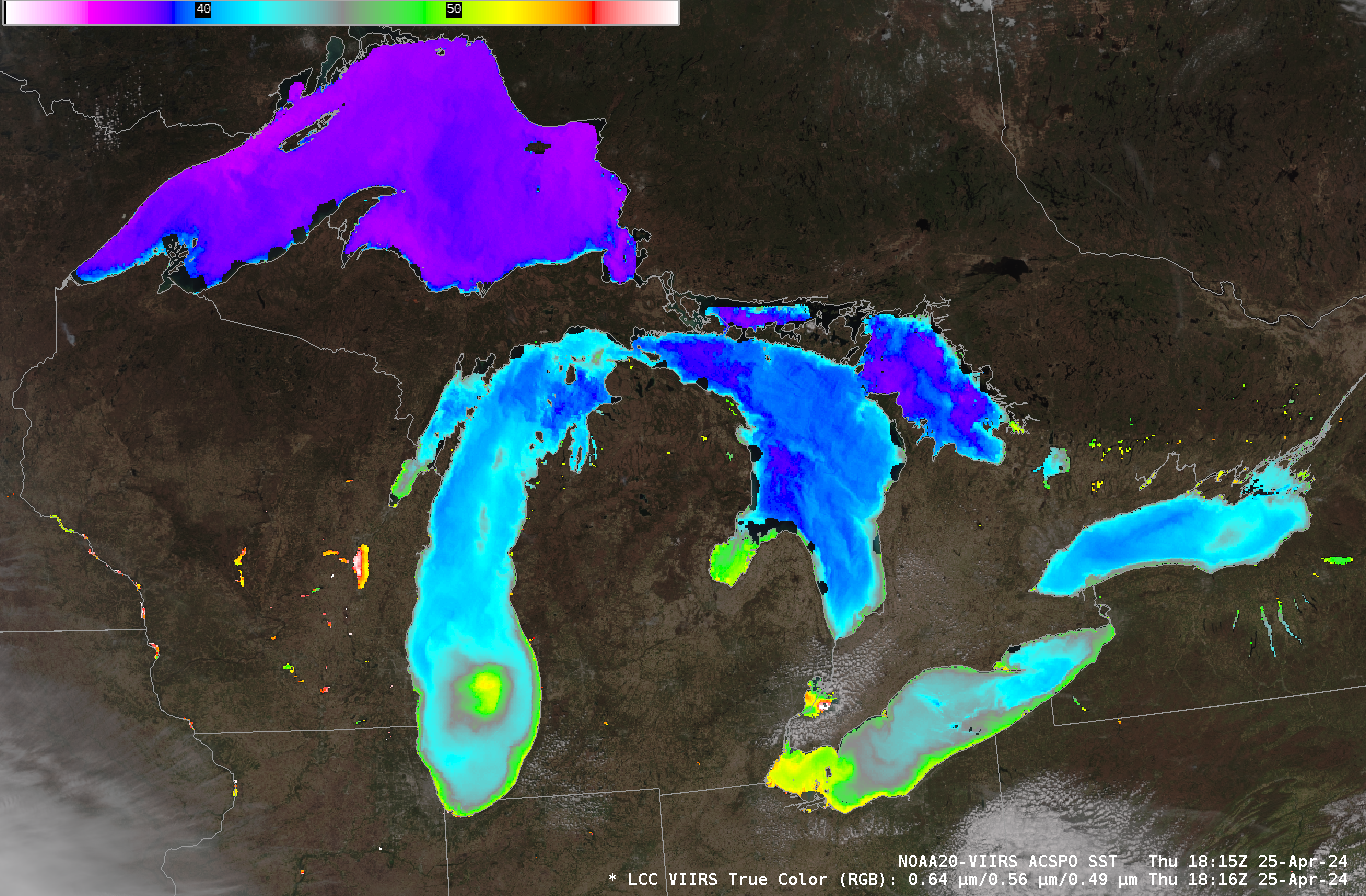
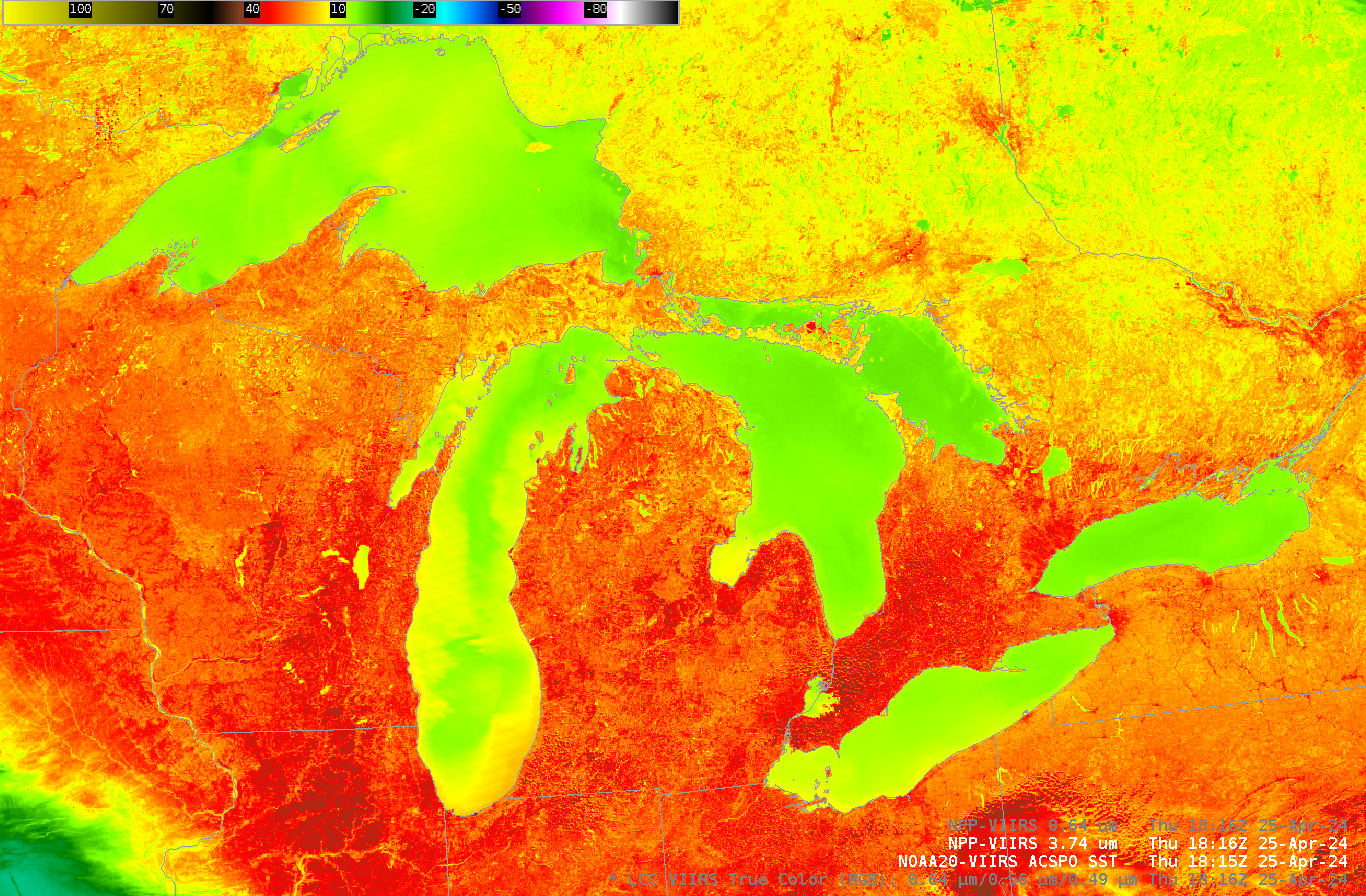
Clear skies also meant a determination of Lake Surface Temperatures, shown below (compare these to Monday, although note the scale here is 32 to 59oF v. 32 to 50oF on Monday). Relatively cool waters persist in eastern Lake Erie, Lake Superior is uniformly cold (37 to 38oF), and a curious warm ring has developed over southern Lake Michigan, 10oF warmer at its center than the surrounding lake waters!

AWIPS-ready JPSS Tiles are created from data downloaded at the Direct Broadcast antenna at CIMSS (processed by CSPP software) and are available from an LDM feed at CIMSS. Data are also available as imagery at this ftp site, and here.
Sometimes, warm water observations occur because of the reflection of solar radiation (although that should be accounted for in ACSPO algorithms as sunglint location can be calculated). In this case you don’t see glint in the True Color, and the I04 imagery doesn’t show spectacular warmth. The GOES-16 Land Surface Temperature does show a warm eddy moving westward across the Lake however, at fairly high speed! That earns this post the “What the heck is this?” tag!
____________________
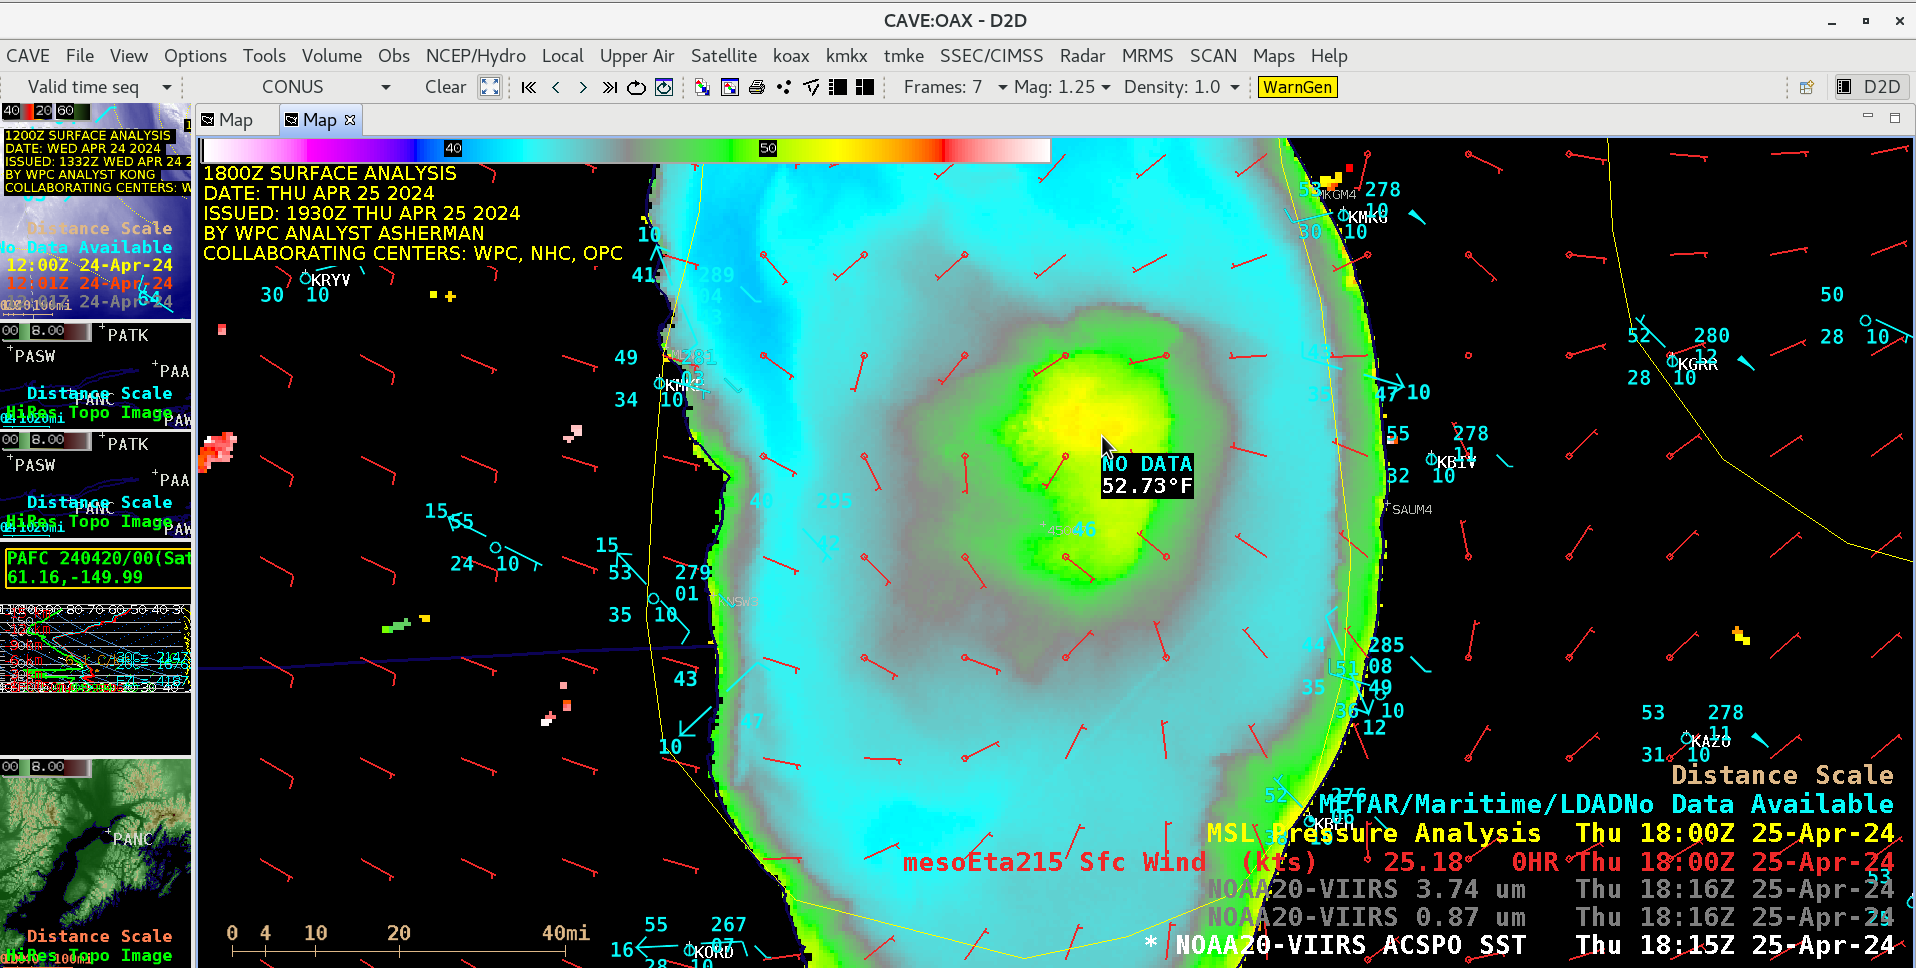
NOAA-20 VIIRS Sea Surface Temperature and Near-Infrared Vegetation (0.87 µm) images at 1816 UTC, with plots of 1800 UTC mesoEta215 model Surface Wind barbs in red, Mean Sea Level Pressure isobars in yellow and METAR/Maritime surface reports in cyan (courtesy Scott Bachmeier, CIMSS) [click to enlarge]
Has this type of warm-water feature appeared in Lake Michigan before? The answer is yes: such isolated warm water features are often associated with areas of very light winds — usually beneath the center of high pressure at the surface — which allows the relatively calm water surface to warm more rapidly. These areas of light winds will exhibit a darker appearance in Visible imagery — or in this case on 25 April, Near-Infrared imagery (above). The warmest VIIRS Sea Surface Temperature value was 52.73ºF, near the apparent center of the surface high pressure (judging by the model surface wind barbs). Details of 2 similar Lake Michigan events are available in previous blog posts here and here.
Although it was about 6 hours earlier than the NOAA-20 VIIRS images, an overpass of RCM-3 provided Synthetic Aperture Radar (SAR) imagery (source) which displayed lighter wind speeds (darker shades of blue) in southern Lake Michigan (below).

RCM-3 Synthetic Aperture Radar (SAR) image at 1201 UTC [click to enlarge]
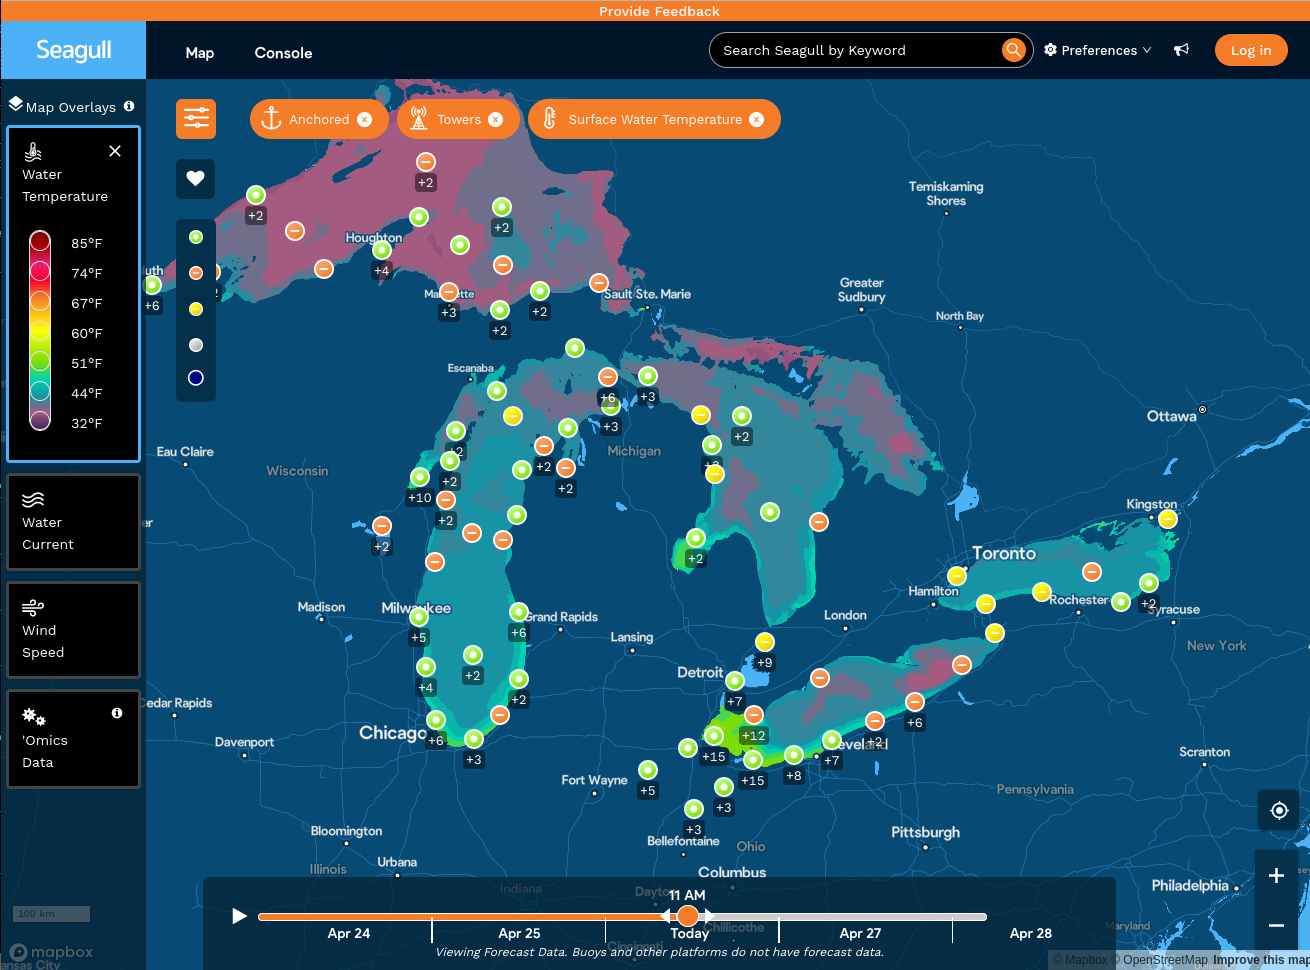
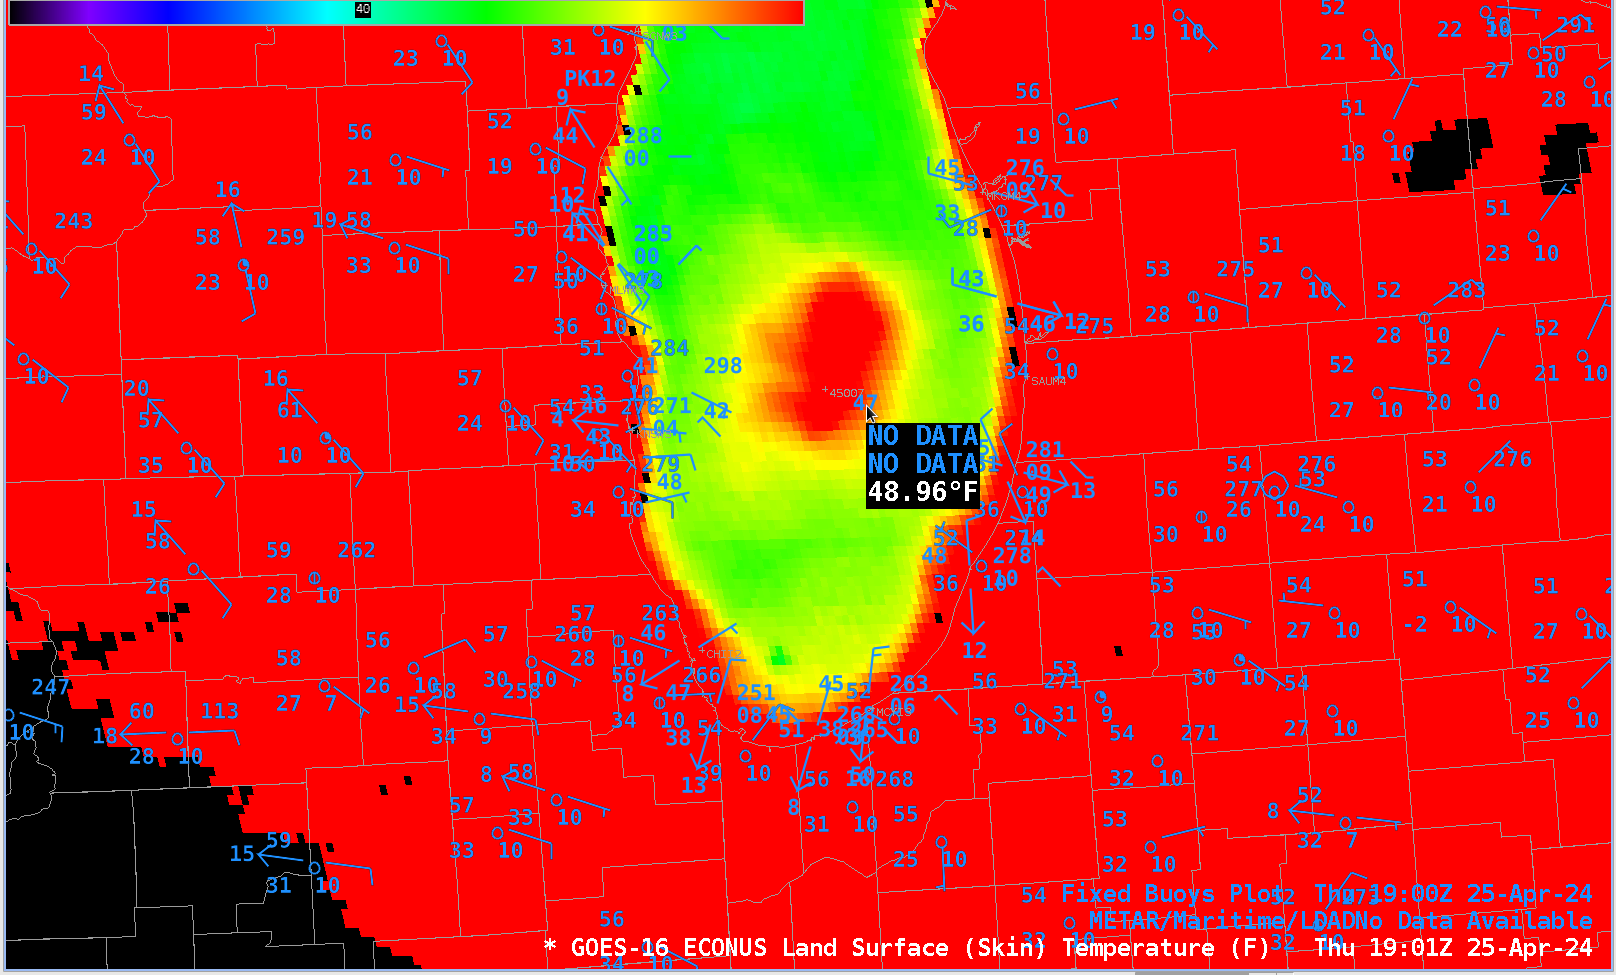
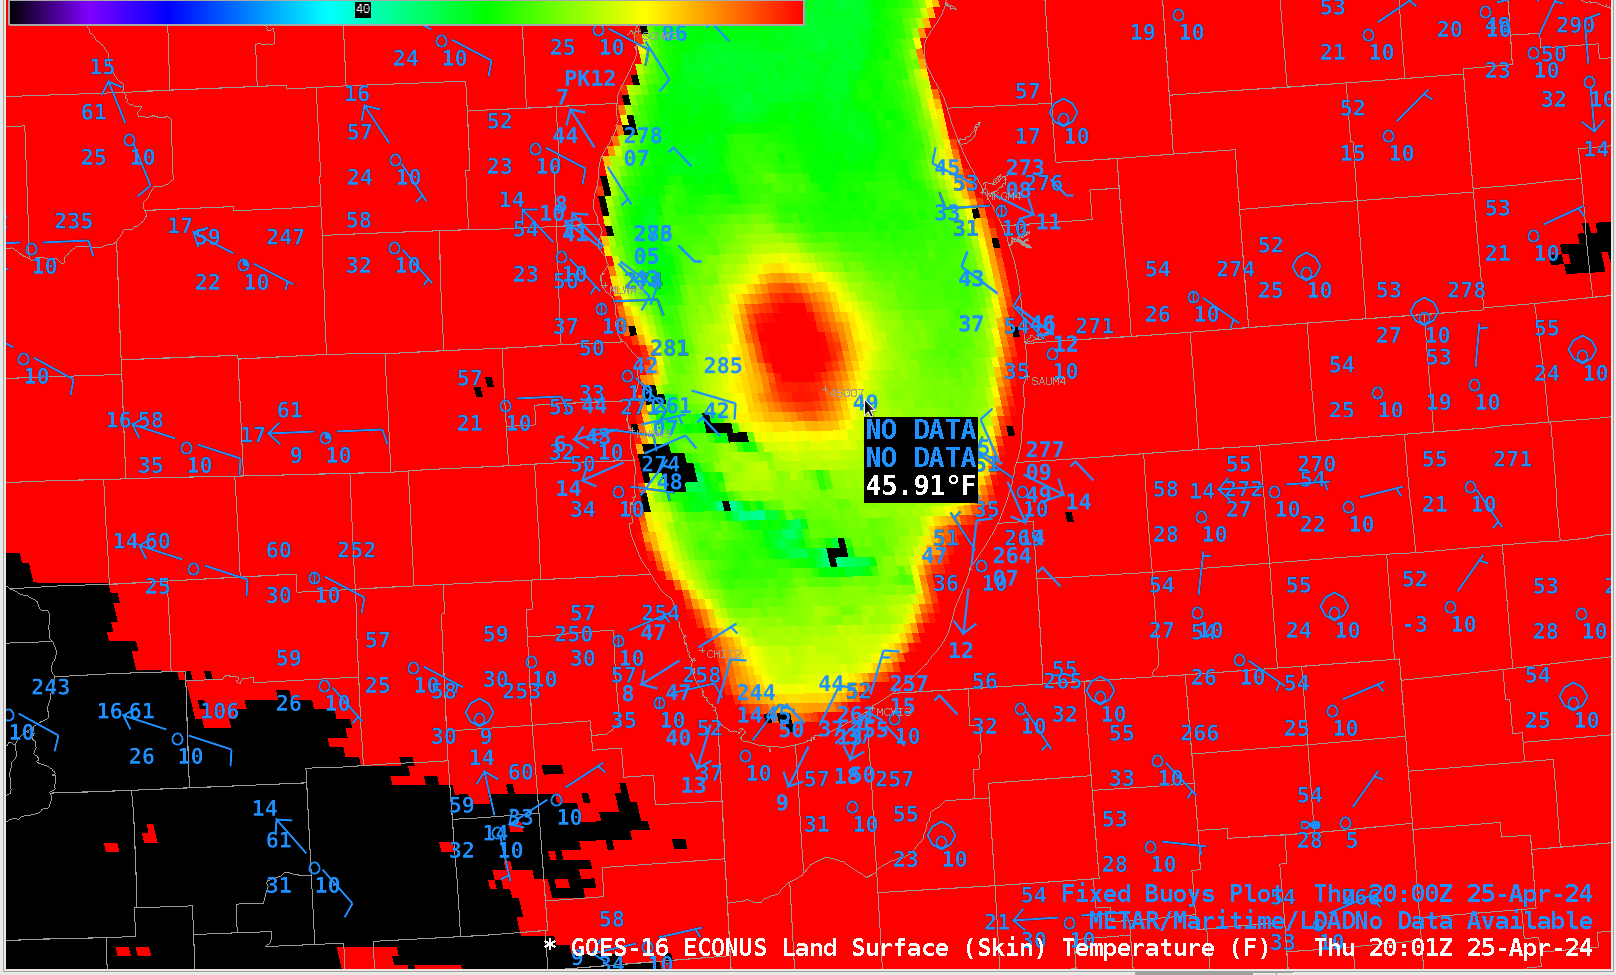
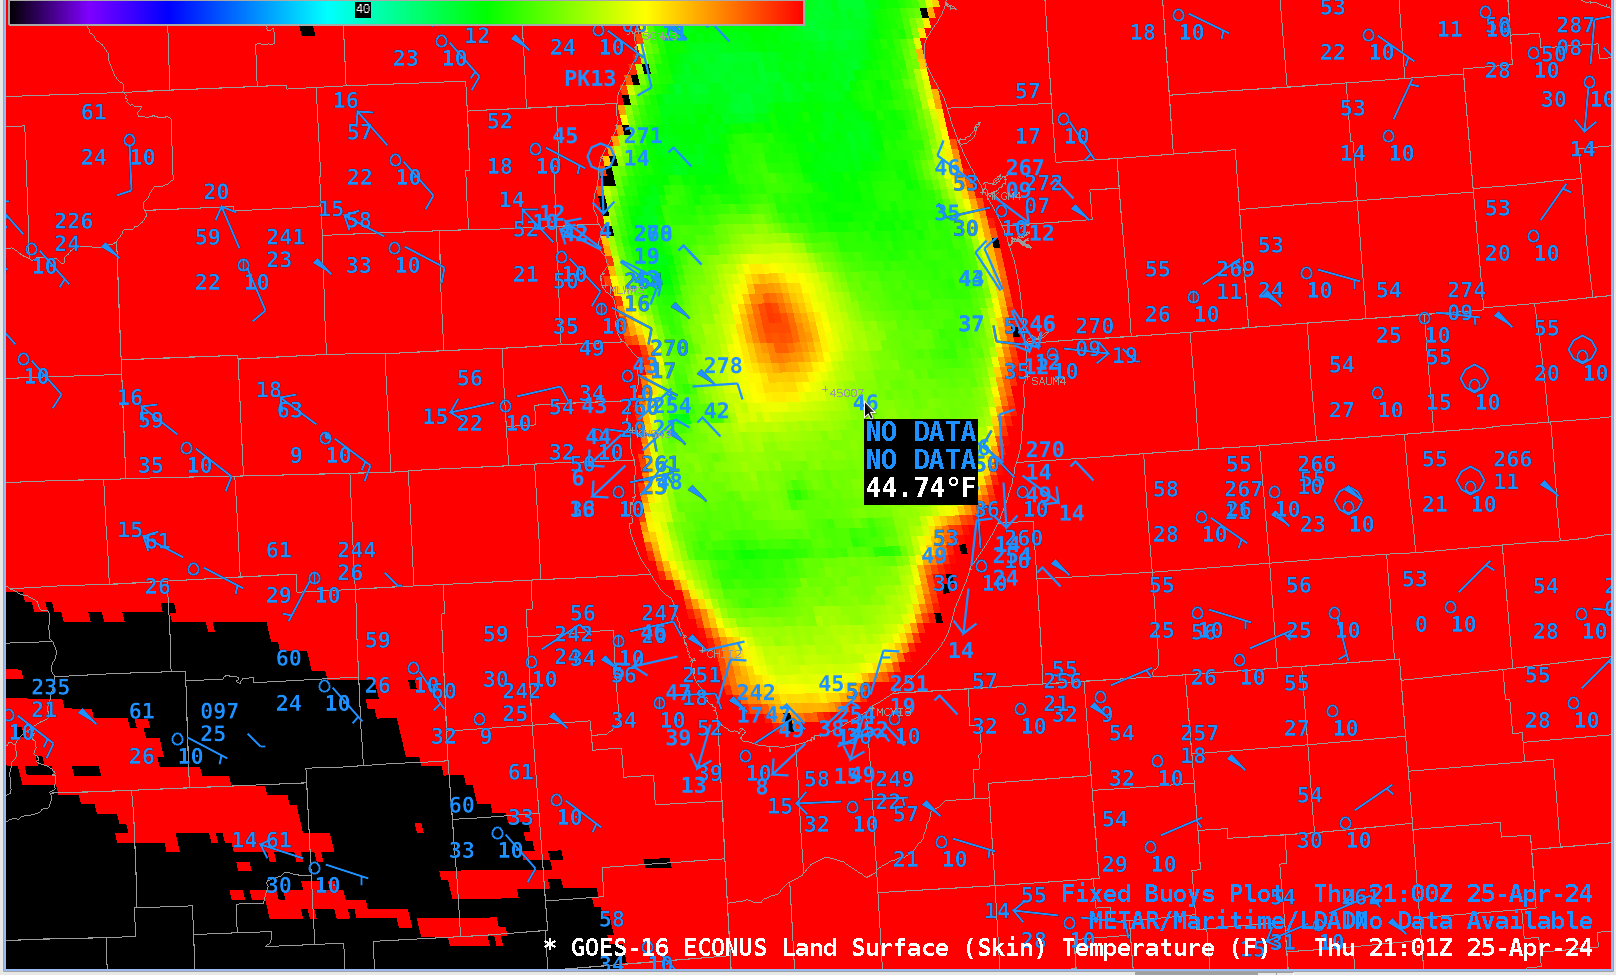
The animation below shows GOES-16 Hourly Land Surface Temperature fields from 1400 UTC 25 April 2024 through 0200 UTC 26 April 2024. That important central Lake Michigan observation appears to be part of the Great Lakes Observing System (link). A curious aspect of the in situ observations is that they are cooler than the sensed surface temperature as the warm lens of water moves through (up through 1900 UTC), but at 2000 and 2100 UTC, the buoy temperatures are warmer than the satellite-derived product.
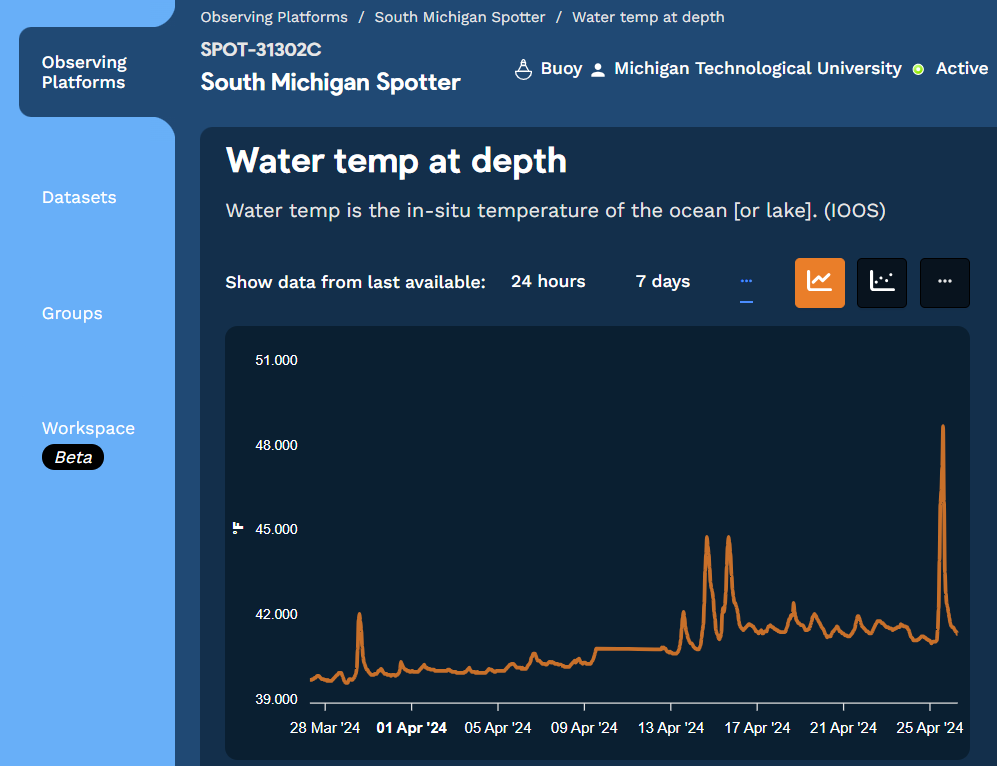
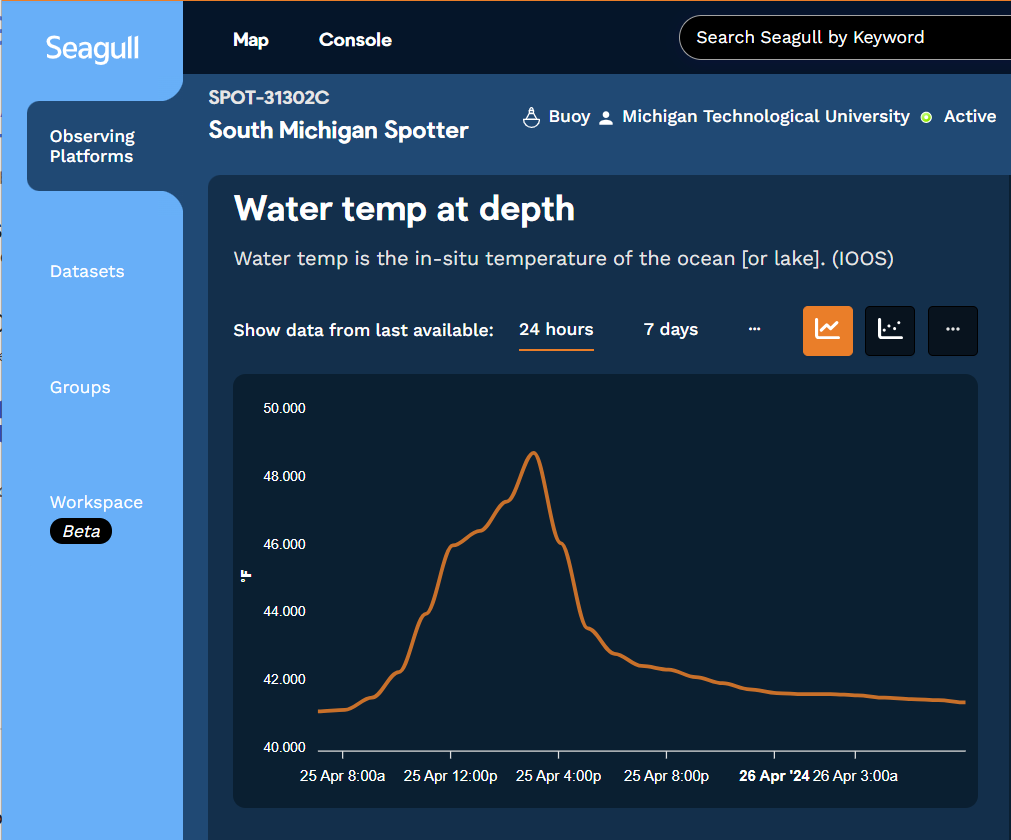
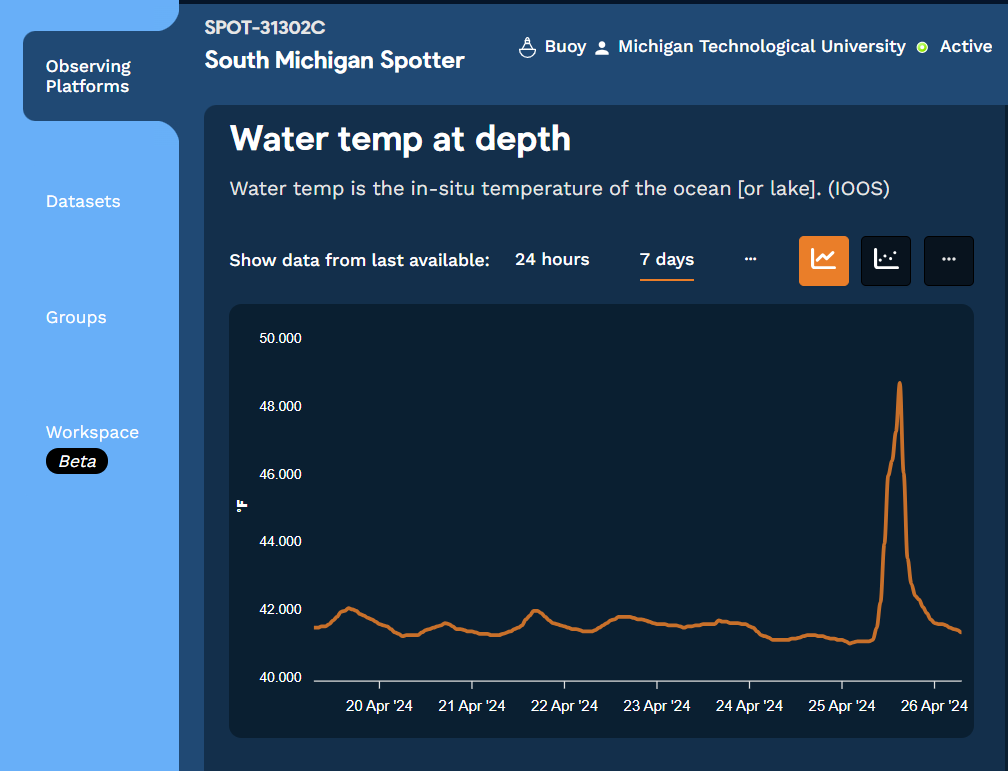
Data from the Spotter Buoy are available here. Data include observed significant wave heights and pressure, and Lake Temperatures. The monthly temperature trace is shown below, highlighting the intense character of this feature. (Daily and Weekly traces are also available).
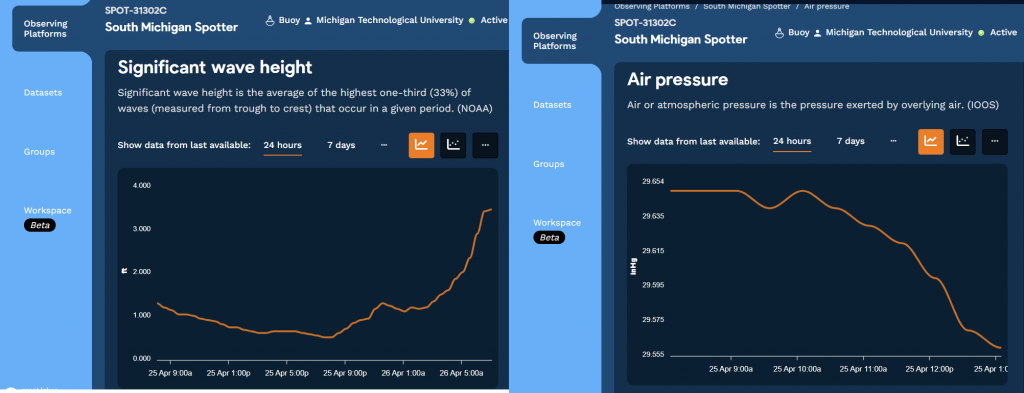
Significant wave heights during this time were minimal — generally less than 1 foot. The barometric pressure at the buoy started falling around 1500 UTC. (Direct wind observations at the buoy site are not available).
View only this post Read Less


