
GOES-13 10.7 µm IR imagery
GOES-13 10.7 µm IR imagery from the CIMSS Tropical Cyclones site (above) showed the development of large convective bursts around the center of Hurricane Alex during the 29 June – 30 June 2010 period. Alex became the first June hurricane in the Atlantic Basin since the 1995 tropical cyclone season (which produced Hurricane Allison).
An AWIPS image of POES AVHRR 11.0 µm IR channel data (below) showed very cold IR brightness temperatures of -80 to -90º C (violet color enhancement) associated with the convective bursts as well as the distant bands of intense convection surrounding the hurricane.

POES AVHRR 10.8 µm IR image
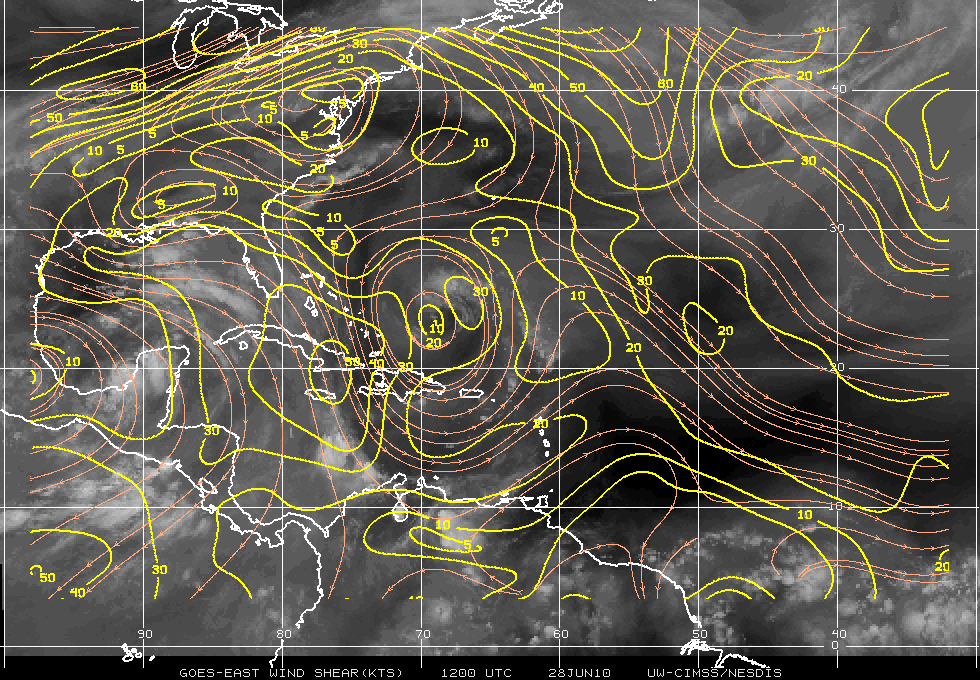
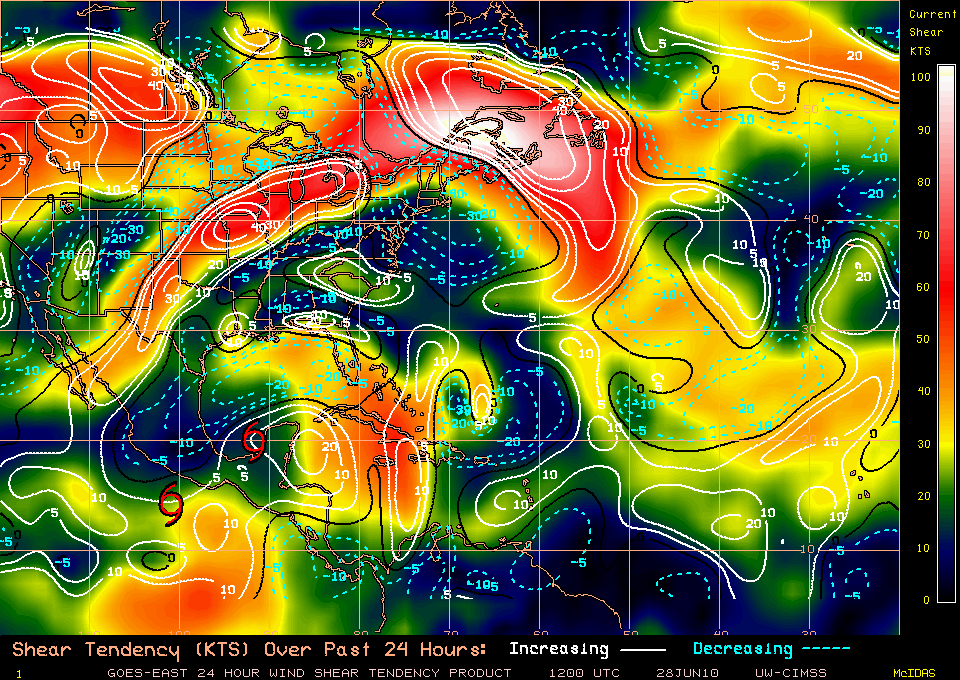
Deep layer wind shear (below) over the western Gulf of Mexico remained very light, which was favorable factor for further intensification prior to making landfall.

GOES-13 IR image + deep layer wind shear
DMSP SSMI/S 85 GHz microwave imagery (below) showed the possible development of some inner banding structure, as well as the larger and more intense bands of convection far from the center of Alex.

SSMI/S microwave image
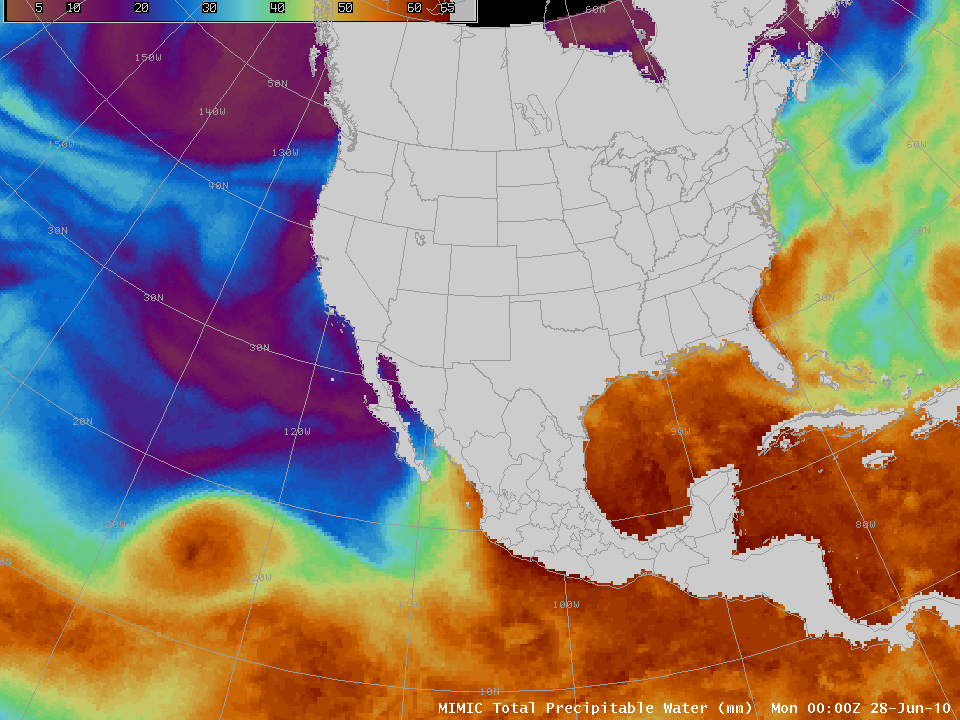
AWIPS images of the MIMIC Total Precipitable Water product (below) indicated that a rich source of moisture remained in place across the entire Gulf of Mexico region (with TPW values in excess of 60 mm).

MIMIC Total Precipitable Water product
UPDATE: AWIPS images of the MODIS 0.65 µm visible and 11.0 µm IR channel data with an overlay of ASCAT scatterometer surface winds (below) depicted the eye of Hurricane Alex at 16:58 UTC on 30 June.

MODIS 0.655 µm visible and 11.0 µm IR images + ASCAT scatterometer winds
===========================================

POES AVHRR Cloud Top Temperature, Cloud Top Height, and Cloud Type products
Later in the day, AWIPS images of the POES AVHRR Cloud Top Temperature (CTT), Cloud Top Height (CTH), and Cloud Type products at 22:05 UTC (above) displayed a large area of CTT values in the -80 to -83º C range (violet color enhancement), with CTH values as high as 17 km (darker blue color enhancement). The Cloud Type product categorized a large portion of the coldest/highest cloud tops surrounding the eye as “overshooting” (lighter violet color enhancement), in general agreement the the GOES InfraRed/Water Vapor difference overshooting top detection technique of Olander and Velden (2009).

GOES-15 and GOES-13 0.63 µm visible channel images
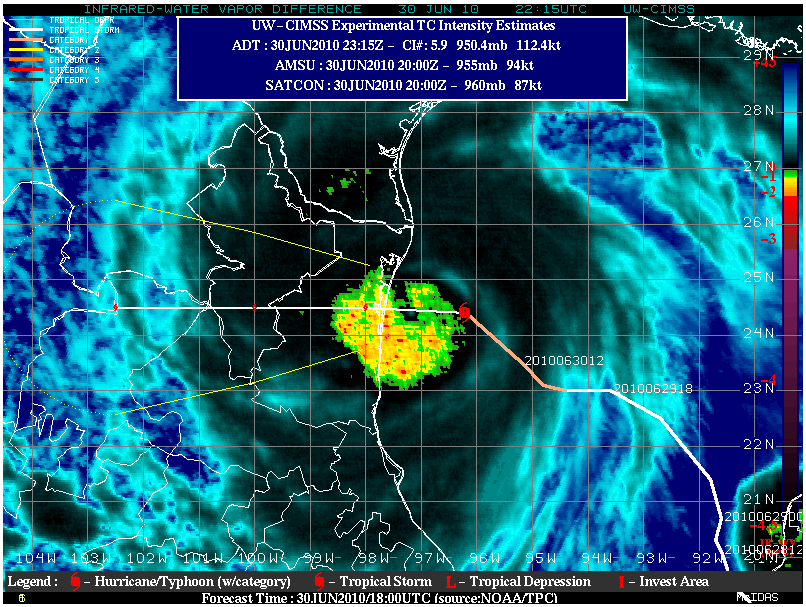
The eye of Hurricane Alex became more well-defined on GOES visible imagery as it approached the coast of Mexico, as seen on a comparison of GOES-15 and GOES-13 visible images at 15 minute intervals (above) and also on GOES-13 Rapid Scan Operations (RSO) images at 5-10 minute intervals (below). An impressive convective burst was evident just as the eye was nearing the coastline — in fact, Alex rapidly intensified into a 90 knot Category 2 hurricane just prior to making landfall, as can be seen on this plot of the CIMSS Automated Dvorak Technique. This made Alex the first Category 2 or stronger hurricane to occur in the month of June since Hurricane Alma back in 1966.
")
GOES-13 0.63 µm visible channel images (Rapid Scan Operations)
View only this post Read Less


 product")


 and false color (using bands 7/2/1) RGB images")

