
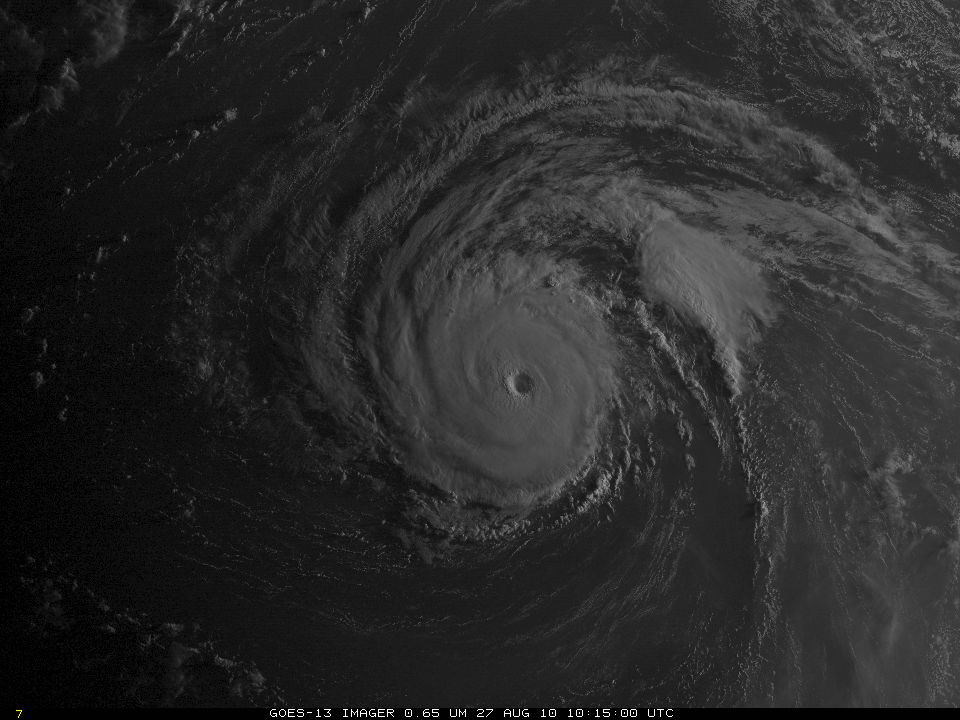
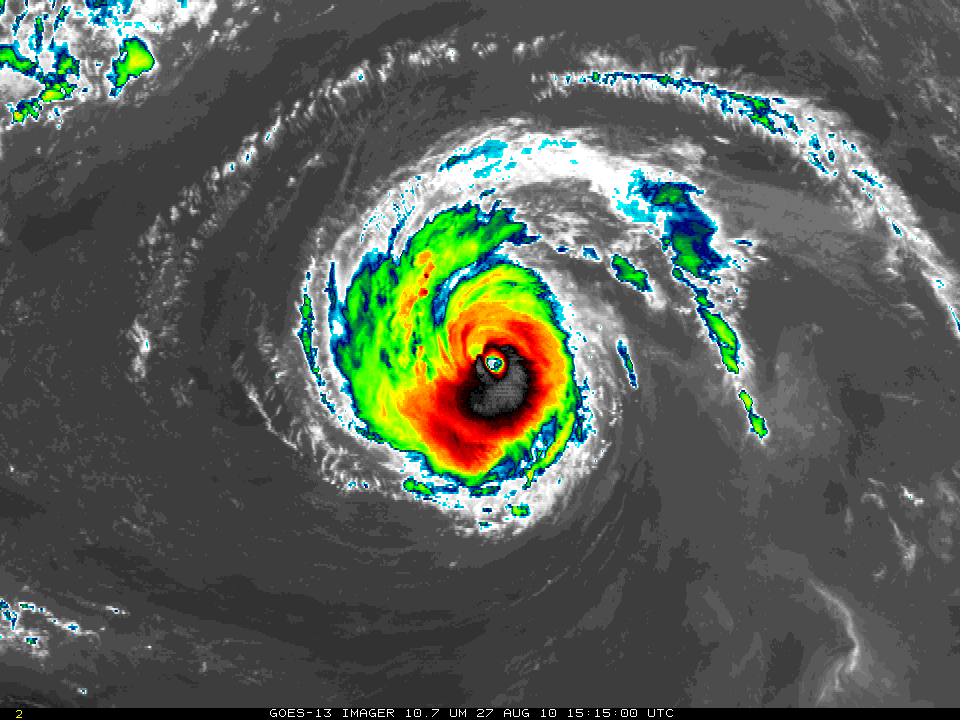
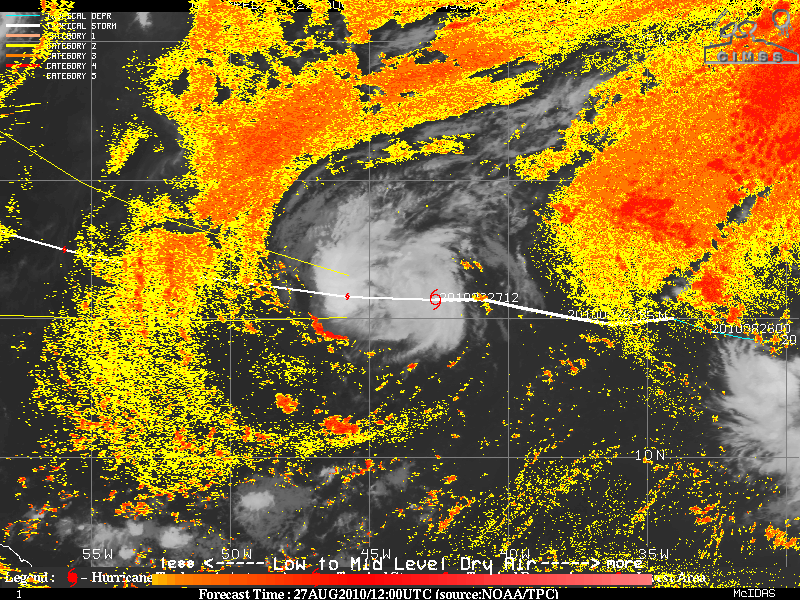
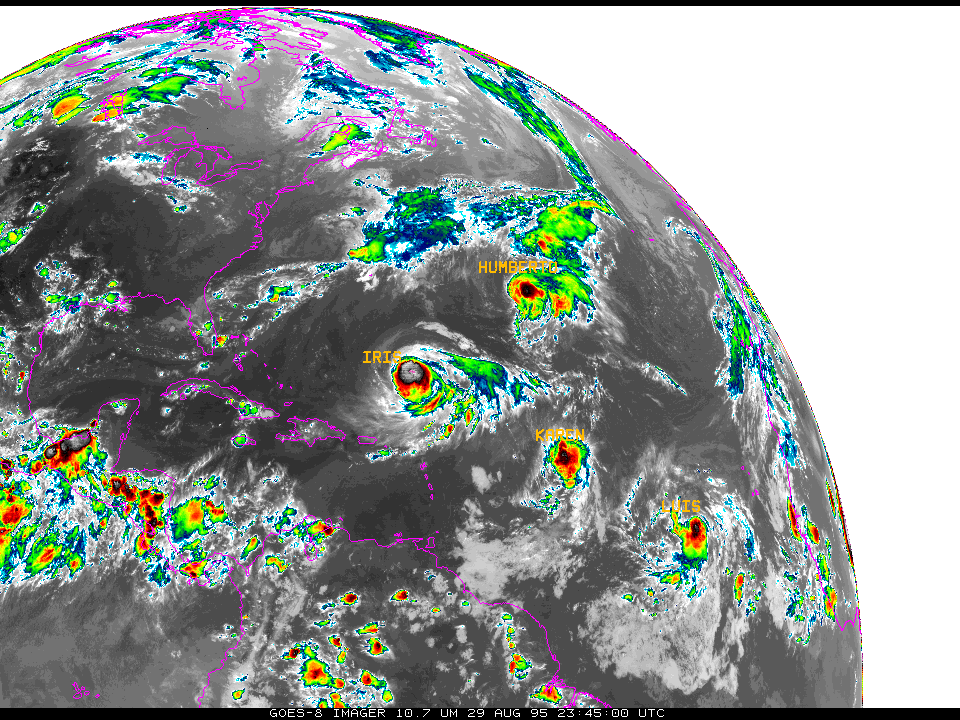
GOES-13 10.7 µm IR images
GOES-13 10.7 µm IR images (above) and 0.63 µm visible images (below) from the CIMSS Tropical Cyclones site showed Hurricane Earl after the storm reached Category 1 intensity on 29 August 2010. A Central Dense Overcast (CDO) could be seen developing in the images as Earl approached the Leeward Islands.

GOES-13 0.63 µm visible images + surface reports
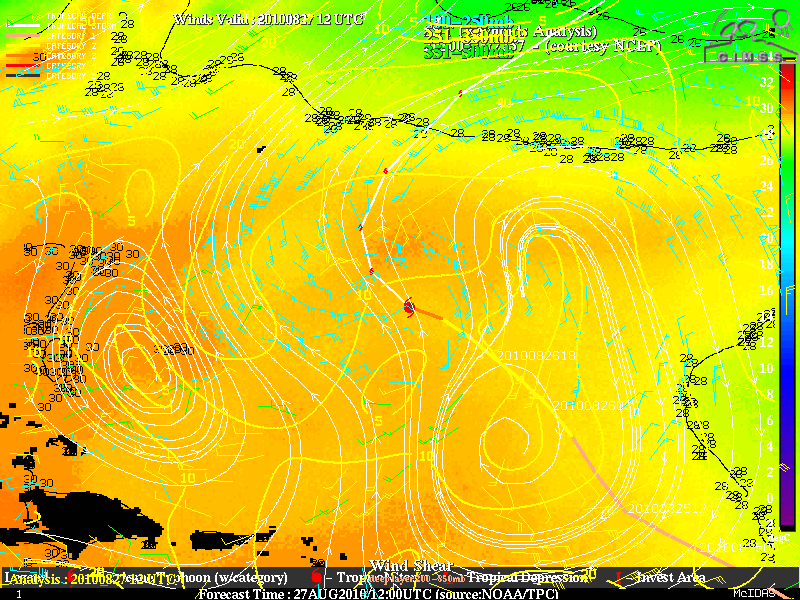
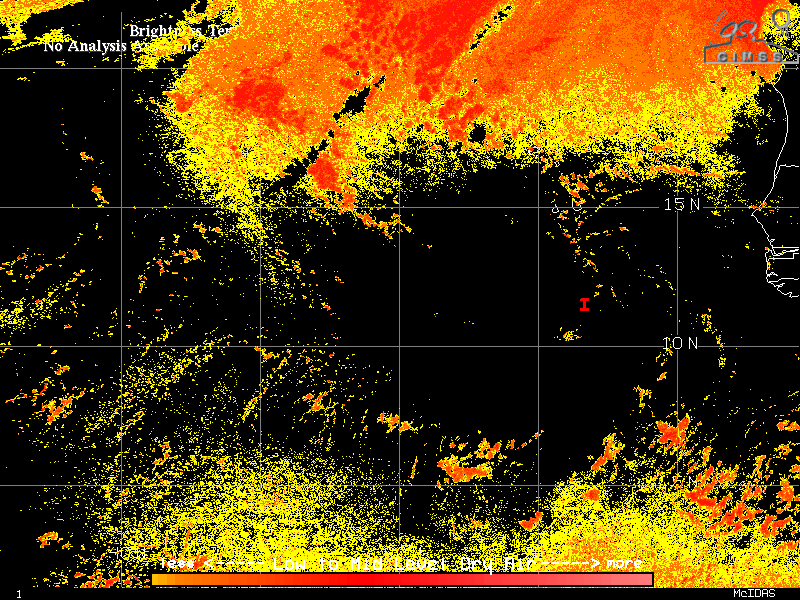
A comparison of 85 GHz microwave images at 11:02 UTC and 17:23 UTC (below) revealed the increasing organization of banded convective elements around the center of the hurricane.

SSMI/S-16 and AMSR-E 85 GHz microwave images
=========================================

GOES-15 0.63 µm visible images
As a part of the GOES-15 Post Launch Science Test, the satellite was placed into Rapid Scan Operations (RSO) mode, providing images periodically at 5-minute intervals. GOES-15 0.63 µm visible images (above; also available as a QuickTime movie) and 10.7 µm IR images (below; also available as a QuickTime movie) showed two distinct convective bursts that were developing within the CDO region (the 15 UTC and 18 UTC positions of the center of Earl are marked on the images). The coldest cloud top IR brightness temperatures were -86º C (darker violet color enhancement) at 16:15 UTC and again at 19:25 UTC.
The far eastern portion of the island of Guadeloupe can be seen mapped in dark blue along the lower left edge of the GOES-15 images.

GOES-15 10.7 µm IR images
Be sure to check out the PREDICT Field Experiment Blog for additional insights on other tropical cyclone activity in the Atlantic basin.
View only this post Read Less
 product")


