The normal operational GOES scan schedule provides one full disk image every 3 hours — but as part of the GOES-15 NOAA Science Test, the GOES-15 satellite was placed into a mode which allowed one full disk image to be scanned every 30 minutes. McIDAS images of GOES-15 6.5 µm “water vapor channel”... Read More
")
GOES-15 full disk 6.5 µm water vapor images (at 30-minute intervals)
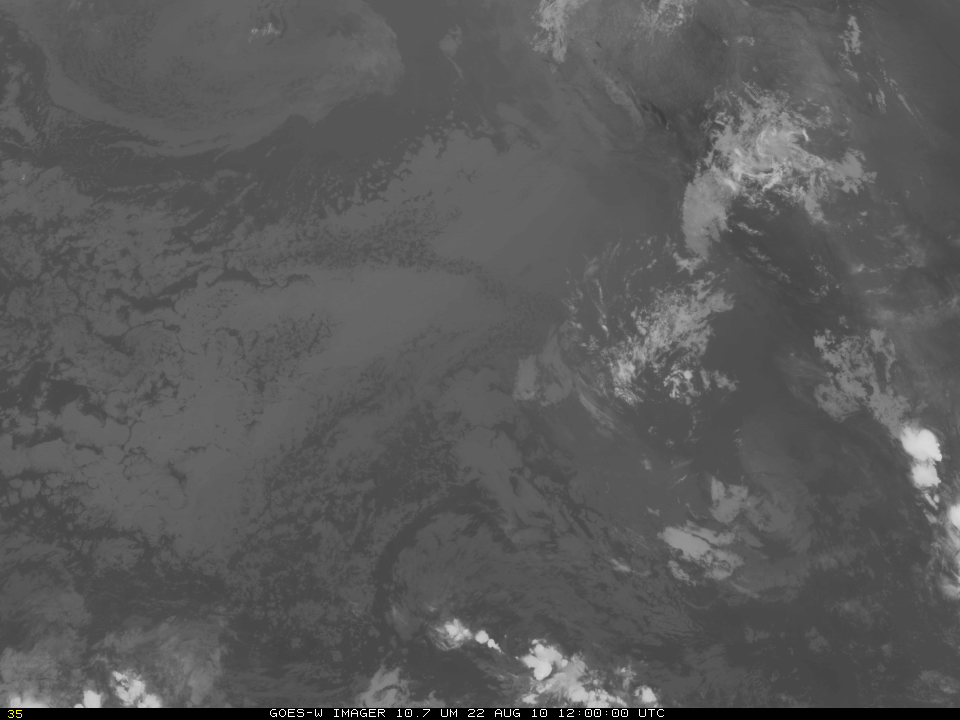
The normal operational GOES scan schedule provides one full disk image every 3 hours — but as part of the GOES-15 NOAA Science Test, the GOES-15 satellite was placed into a mode which allowed one full disk image to be scanned every 30 minutes. McIDAS images of GOES-15 6.5 µm “water vapor channel” data (above) showed a series of these 30-minute interval full disk images during a 24-hour period during 21 August – 22 August 2010. It should be pointed out that the ABI instrument on the GOES-R satellite will provide a full disk image every 5 minutes!
The image artifacts seen moving from west to east across the northern portion of the images (from 05:15 UTC to 06:45 UTC) were due to stray light contamination. This stray light problem affects the image quality to varying degrees during the Autumn and Spring season “eclipse periods”, since the newer GOES satellites (GOES-13 through GOES-15) have larger batteries that allow them to continue to operate through the eclipse periods when the satellite is in the Earth’s shadow.
Note that some of warmest water vapor brightness temperatures (yellow to orange color enhancement) — which normally indicate areas of very dry air in the middle to upper troposphere — were found over the central US during this particular period. This region of warm/dry air showed up well on GOES-11, GOES-12, GOES-13, and GOES-15 water vapor images (below), although the signal was less obvious on the 6.7 µm GOES-11 imagery (which is a spectrally narrow water vapor channel at an 8 km spatial resolution, compared to the spectrally broad 4-km resolution channels on GOES-12 and later). Each of the water vapor images is displayed in the native projection of the particular satellite.

GOES-11, GOES-12, GOES-13, and GOES-15 water vapor images
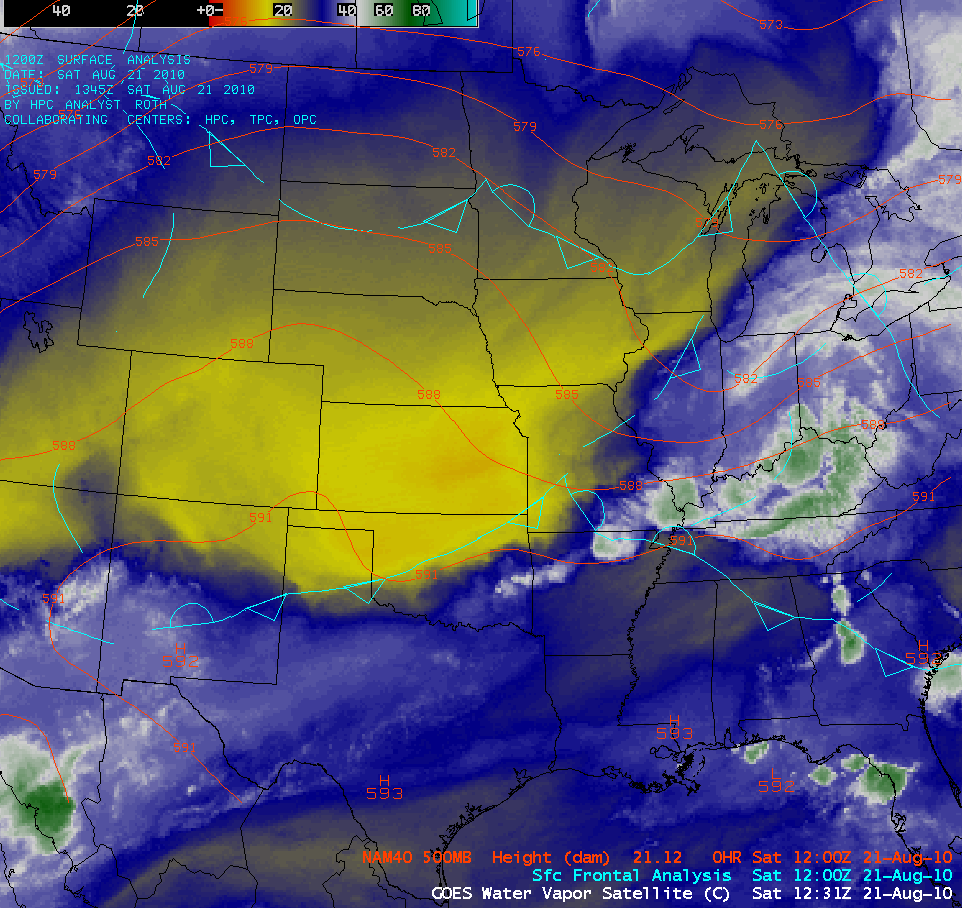
A closer view using AWIPS images of GOES-13 6.5 µm water vapor channel data (below) showed the evolution of this feature, which was becoming warmer/drier as a middle-tropospheric ridge of high pressure was building across the region. Water vapor brightness temperatures were as warm as -9.5º C (orange color enhancement), which is very unusual to see covering such a large area over the central US.
")
GOES-13 6.5 µm water vapor images (with rawinsonde locations)
4-panel images displaying the 3 GOES Sounder water vapor channels (6.5 µm, 7.0 µm, and 7.4 µm) along with the standard GOES-13 imager 6.5 µm water vapor channel are shown below. The water vapor channel weighting function of each of these channels peaks at different altitudes, which is obvious by the difference in water vapor brightness temperatures on each of the images (warmer/drier areas are enhanced with yellow to red colors).

GOES Sounder and GOES Imager water vapor channel images
The GOES-13 sounder and GOES-13 imager water vapor weighting functions for Topeka, Kansas (below) indicated that the altitudes of the weighting function peaks did indeed descend from 12 UTC on 21 August to 00 UTC on 22 August as the middle troposphere became warmer/drier — but the altitudes of the various weighting function peaks were not significantly lower than those computed using the US Standard Atmosphere.
")
Topeka, Kansas water vapor weighting function plots (compared to US Standard Atmosphere)
The rawinsonde date from Topeka, Kansas at 12 UTC on 21 August and at 00 UTC on 22 August are shown below. While the air aloft was certainly dry, it was also quite warm at those altitudes — and the warm temperature of this mid-tropospheric air was likely contributing to the unusually warm/dry appearance on the water vapor imagery. This case helps to highlight the fact that the water vapor channels are also IR channels, so they are sensitive to temperature as well — and some of the signal of the features seen on the imagery may be due to temperature as well as moisture aloft.
")
Topeka, Kansas rawinsonde plots (12 UTC 21 August, 00 UTC 22 August)
View only this post
Read Less


 0.63 µm visible images")
 product")

 0.63 µm visible images")


