A quick look at a 1-km resolution GOES-13 0.63 µm visible channel image (above) would suggest that it was a cloud-free day across Arkansas, Tennessee, and the surrounding region on 08 November 2010.However, a comparison of AWIPS images of the 1-km resolution MODIS 0.65 µm “visible channel” , the MODIS 11.0 µm... Read More

GOES-13 0.63 µm "visible channel" image
A quick look at a 1-km resolution GOES-13 0.63 µm visible channel image (above) would suggest that it was a cloud-free day across Arkansas, Tennessee, and the surrounding region on 08 November 2010.
However, a comparison of AWIPS images of the 1-km resolution MODIS 0.65 µm “visible channel” , the MODIS 11.0 µm “IR window” channel, and the 1.3 µm “cirrus detection” channel (below) revealed that there was a patch of thin cirrus clouds and contrails over much of Arkansas and Tennessee. As with the GOES-13 visible channel, there was no indication of any cloud features on the MODIS visible image. On the MODIS IR image, there was a signature of some sort of cloud features over that region, but the IR brightness temperatures were quite warm (mostly above 0º C), which would be much too warm for cirrus clouds. However, the MODIS cirrus detection channel did a very good job at highlighting the patch of very thin clouds. This is due to the fact that the near-IR 1.3 µm channel is very effective for detecting features that are good scatterers of light (such as ice crystals, volcanic ash, airborne dust, etc).

MODIS 0.65 µm "visible", 11.0 µm "IR window", and 1.3 µm "Cirrus detection" images
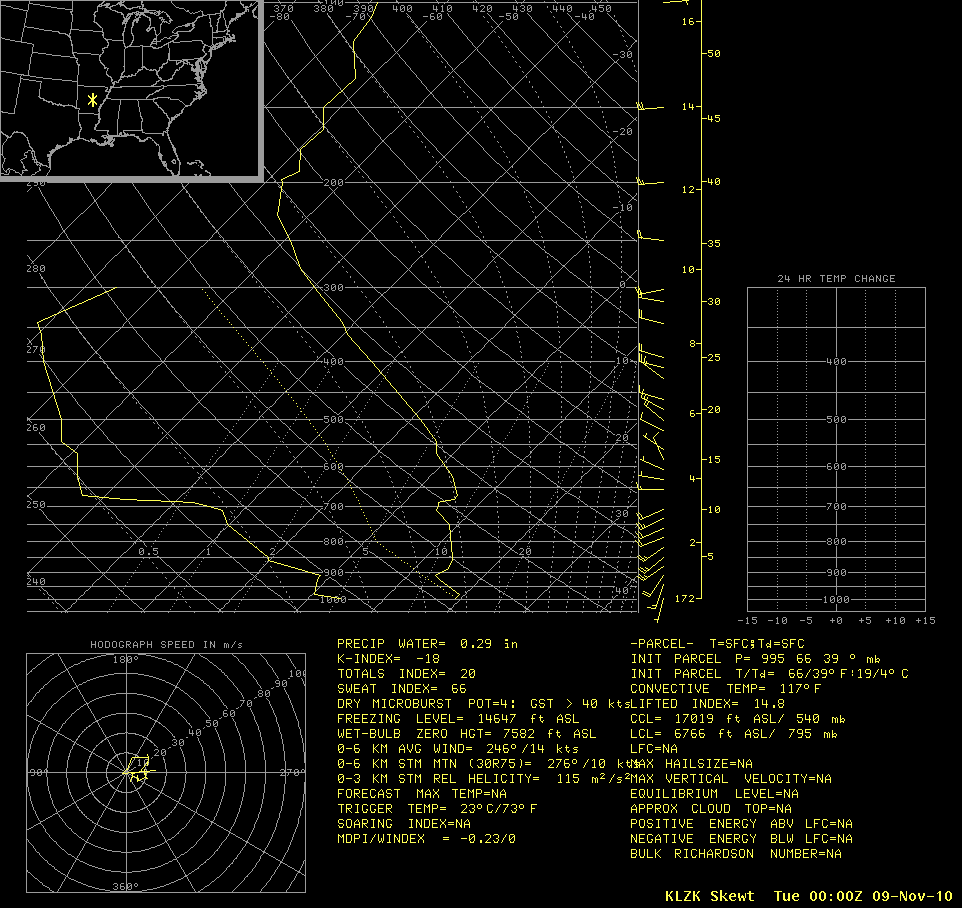
Rather surprising, however, was the fact that this patch of cirrus clouds and contrails existed within a region that appeared to be a fairly dry area (indicated by the lighter blue to yellow color enhancement) on the MODIS 6.7 µm “water vapor” image (below). The pronounced dryness of the middle to upper troposphere was quite evident of the Little Rock, Arkansas rawinsonde data.

MODIS 6.7 µm "water vapor channel" image
A false color Red/Green/Blue (RGB) POES AVHRR composite image (below) did show a subtle hint of some brighter cloud features against the green to brown background of the land surface, but again not to the extent of what was seen on the MODIS cirrus detection channel image.
 image")
POES AVHRR false color Red/Green/Blue (RGB) image
If we examine the 1-km resolution POES AVHRR Cloud Top Temperature (CTT) product (below), we do begin to see features that exhibited CTT values of -50º C and colder (yellow color enhancement), which is more representative of what you would expect for cirrus cloud features.

POES AVHRR Cloud Top Temperature product
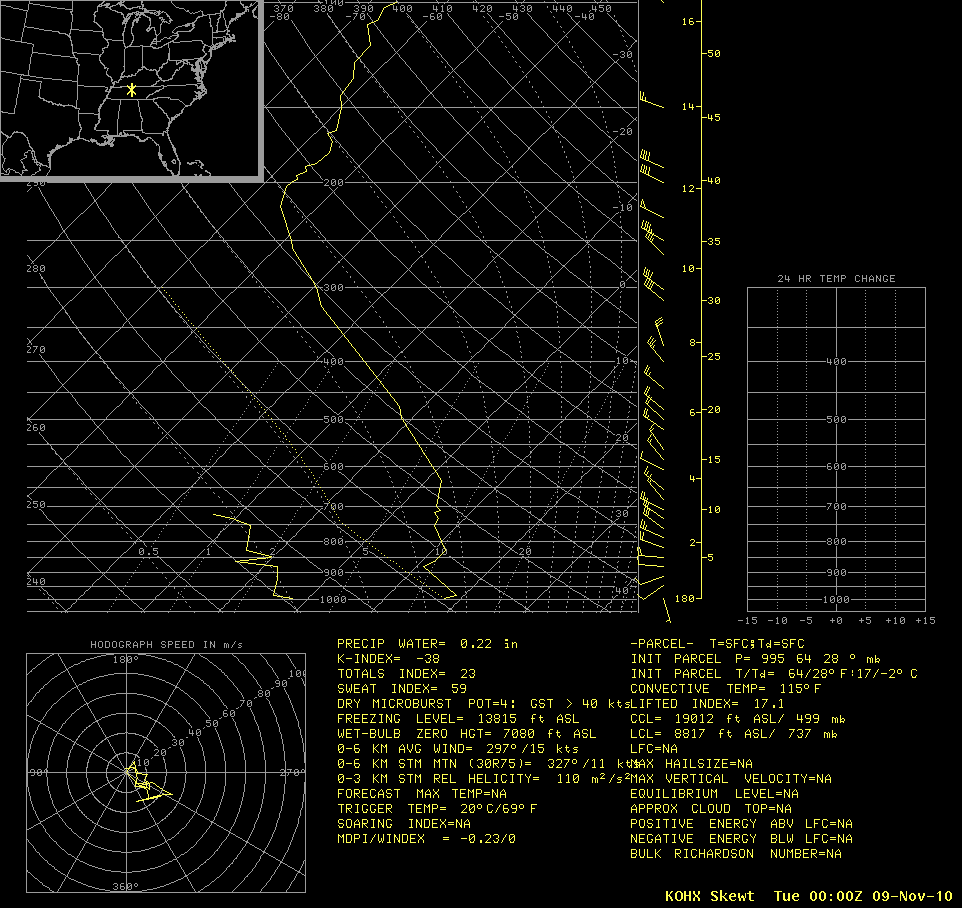
In addition, the 1-km resolution POES AVHRR Cloud Top Height (CTH) product (below) showed features with CTH values of 10-11 km (cyan color enhancement), which are also more representative of the altitude where cirrus cloud features would usually be located. These altitudes also matched the Cloud Top Temperature values around -50º C on the rawinsonde data from Little Rock, Arkansas and Nashville, Tennessee.

POES AVHRR Cloud Top Height product
Given that these cloud features were obviously quite thin, the 1-km resolution POES AVHRR Cloud Optical Depth product (below) showed correspondingly low values.

POES AVHRR Cloud Optical Depth product
Another way to distinguish ice clouds from water droplet clouds is examine the 1-km resolution POES AVHRR Cloud Particle Effective Radius product (below). Ice crystals are typically much larger (in this case, at least 30-40 micrometers in diameter) than water droplets (usually around 20 micrometers or less in diameter).

POES AVHRR Cloud Particle Effective Radius product
Because of the very thin nature of these cirrus and contrail features, the 1-km resolution POES AVHRR Cloud Tye product (below) did seem to struggle in assigning the correct type to the features — although many were correctly identified as Cirrus (orange color enhancement).

POES AVHRR Cloud Type product
View only this post
Read Less
")


")
 plot for Tomas")


