AWIPS images of 4-km resolution GOES-13 10.7 µm IR data (above; click image to play animation) showed an expansive deck of elevated stratus clouds covering much of eastern Texas and far southern Oklahoma on 13 January 2011.The Blended Total Precipitable Water (TPW) product (below) suggested that this elevated stratus cloud feature may... Read More
")
GOES-13 10.7 µm IR images (click image to play animation)
AWIPS images of 4-km resolution GOES-13 10.7 µm IR data (above; click image to play animation) showed an expansive deck of elevated stratus clouds covering much of eastern Texas and far southern Oklahoma on 13 January 2011.
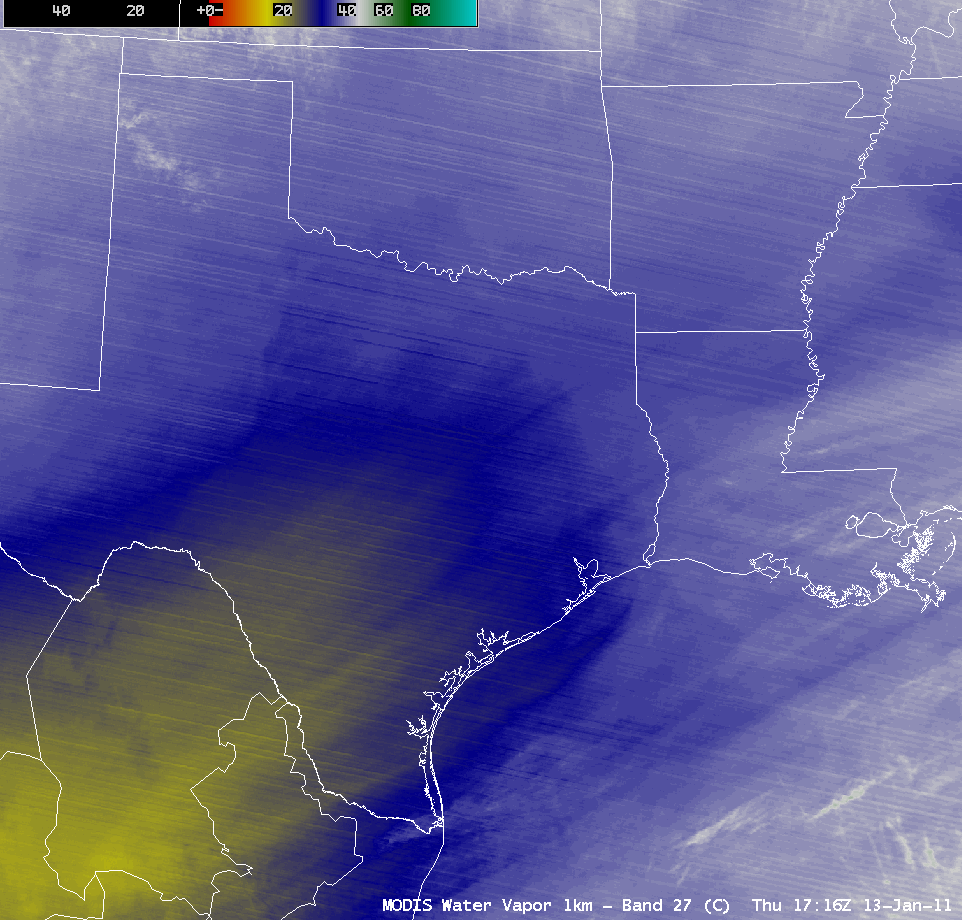
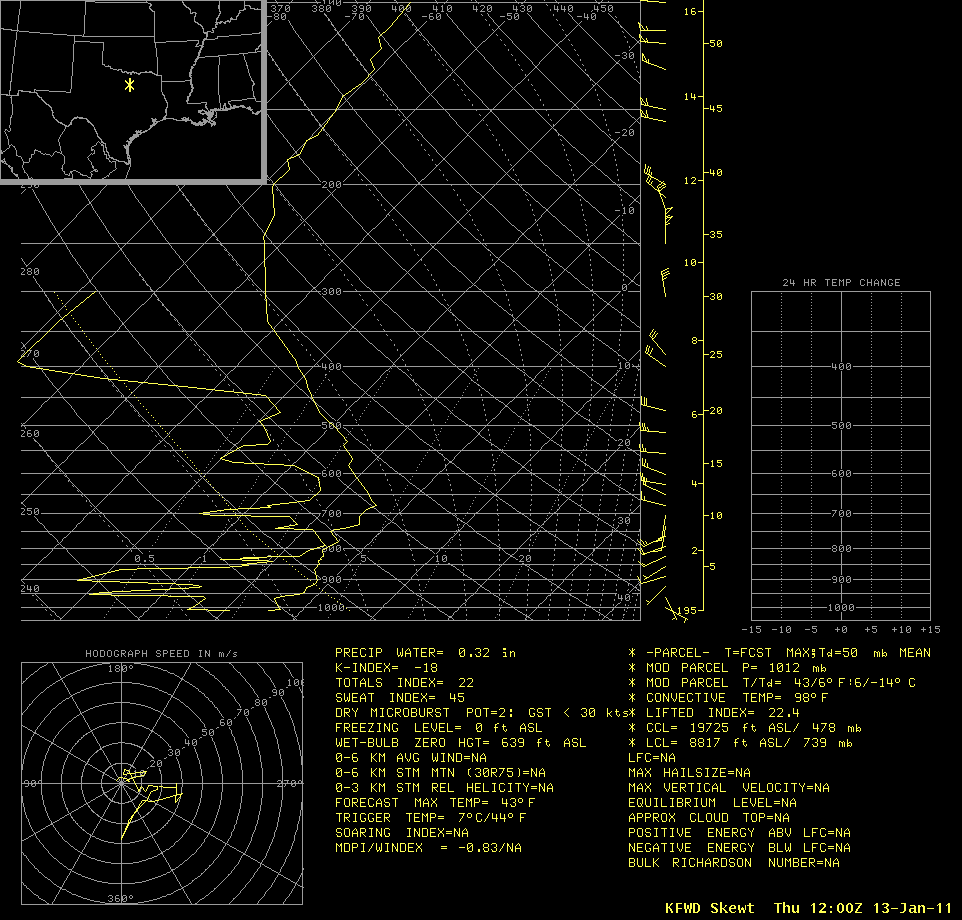
The Blended Total Precipitable Water (TPW) product (below) suggested that this elevated stratus cloud feature may have been associated with a plume of moisture that was beginning to move northward from the Gulf of Mexico. The bulk of this moisture plume was likely confined to the lower troposphere, since the MODIS 6.7 µm water vapor image showed that the middle to upper troposphere was fairly dry across the region. The Fort Worth, Texas rawinsonde data indicated that the stratus deck was probably located near the 750-800 hPa pressure level, well aloft of the dry arctic air near the surface.
 product")
Blended Total Precipitable Water (TPW) product
A comparison of the 1-km resolution POES AVHRR 10.8 µm IR image with the corresponding 1-km resolution POES AVHRR Cloud Type product (below) indicated that the stratus deck — which exhibited relatively warm cloud top IR brightness temperatures between -5º C and -12º C — was composed of primarily supercooled water droplets (green color enhancement on the Cloud Type product).

POES AVHRR 10.8 µm IR + POES AVHRR Cloud Type Product
Even though the elevated stratus cloud deck did not exhibit much of a temperature contrast on the 1-km resolution MODIS 11.0 µm IR image, it’s appearance on the corresponding 1-km resolution MODIS 3.7 µm shortwave IR image was much more complex (below). Since the shortwave IR channel is very sensitive to reflected solar radiation, portions of the cloud top that were composed of smaller cloud droplets (which tend to be more effective reflectors of solar radiation) appeared warmer (darker) on the shortwave IR image.

MODIS 11.0 µm IR + MODIS 3.7 µm shortwave IR images
This was confirmed by a comparison of the 1-km resolution POES AVHRR 3.7 µm shortwave IR image with the corresponding 1-km resolution POES AVHRR Cloud Particle Effective Radius product (below). The warmer (darker) areas on the shortwave IR image matched well with the areas of smaller cloud particles (10-20 µm radius, lighter blue color enhancement) on the Cloud Particle Effective Radius product — while the cooler (lighter gray) areas on the shortwave IR image corresponded to the larger cloud particle regions (25-35 µm radius, darker blue color enhancement).

POES AVHRR 3.7 µm shortwave IR image + Cloud Particle Effective Radius product
The stratus cloud deck was beginning to move northward over areas that had received significant snowfall a few days earlier — deep snow cover that remained on the ground showed up as the darker red areas on a MODIS false-color Red/Green/Blue (RGB) image (below), which was created using the MODIS 0.65 µm visible image as the Red component and the MODIS 2.1 µm near-IR “snow/ice channel” as the Green and Blue components of the image.
 image (created using channels 01/07/07)")
MODIS false-color Red/Green/Blue (RGB) image (created using channels 01/07/07)
The MODIS Land Surface Temperature (LST) product (below) indicated that LST values within the swath of snow cover remained in the upper 20s to low 30s F (darker blue color enhancement), in contrast to the warmer LST values in the low to mid 40s F (yellow to green color enhancement) over the adjacent bare ground areas.

MODIS Land Surface Temperature product
View only this post
Read Less
")


")
")


 image")
