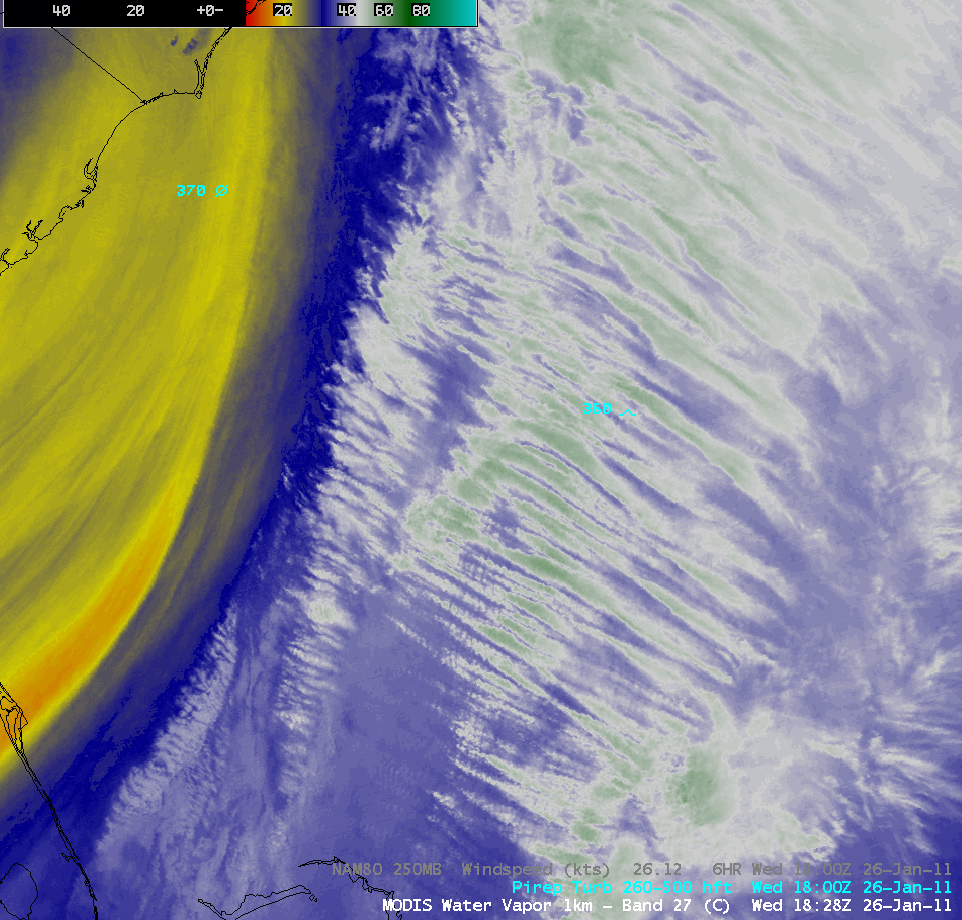
This website works best with a newer web browser such as Chrome, Firefox, Safari or Microsoft Edge. Internet Explorer is not supported by this website.

Madison sets a new record for total winter season snowfall

The previous all-time record for total winter season snowfall in Madison, Wisconsin was 76.1 inches (set in 1978/1979); however, the winter of 2007/2008 decided that would be an easy record to break…and on the morning of 12 February 2008, the old winter season record was finally eclipsed by 1.8 inches of fluffy... Read More

GOES-12 6.5µm water vapor images (Animated GIF)

The previous all-time record for total winter season snowfall in Madison, Wisconsin was 76.1 inches (set in 1978/1979); however, the winter of 2007/2008 decided that would be an easy record to break…and on the morning of 12 February 2008, the old winter season record was finally eclipsed by 1.8 inches of fluffy snowfall. Not content to stop there, the atmosphere conjured up another round of snowfall later in the day, courtesy of a potential vorticity (PV) anomaly that propagated eastward from eastern Iowa into northern Illinois and southern Wisconsin.

AWIPS images of the GOES-12 6.5µm “water vapor” channel (above) showed a warm/dry signature (darker blue enhancement) associated with the core of the PV anomaly — the “dynamic tropopause” (taken to be the pressure of the 1.5 Potential Vorticity Unit surface) was extruded downward to as low as about the 500 hPa pressure level early in the day. PV anomalies tend to induce upward vertical motions as they approach a given area, and in this case the approaching PV anomaly helped to generate another band of moderate snowfall in southcentral Wisconsin, as seen by the radar reflectivites (below) greater than 20 dBz (green enhancement) that added another 2.0 inches to Madison’s ever-growing winter season snowfall total.

Radar base reflectivity (Animated GIF)

An AWIPS image combination of the GOES-12 water vapor imagery (with a different color enhancement) plus the radar base reflectivity is shown below.

GOES water vapor + radar reflectivity (Animated GIF)

View only this post Read Less

Aircraft contrails over the Upper Midwest

Comparing AWIPS images of the MODIS visible channel, 11.0µm “IR window” channel, 3.7µm “shortwave IR” channel, and 1.6µm near-IR “cirrus channel” (above) showed how certain satellite channels are very useful in the detection of a broad area of aircraft contrails that existed over parts of Illinois, Indiana, and lower Michigan... Read More

MODIS images (Animated GIF)

Comparing AWIPS images of the MODIS visible channel, 11.0µm “IR window” channel, 3.7µm “shortwave IR” channel, and 1.6µm near-IR “cirrus channel” (above) showed how certain satellite channels are very useful in the detection of a broad area of aircraft contrails that existed over parts of Illinois, Indiana, and lower Michigan (likely resulting primarily from air traffic to/from Chicago and Detroit) on the morning of 12 February 2008. The 3.7µm shortwave IR and the 1.6µm cirrus channels offered the best depiction of the actual areal coverage of these contrails; the contrail features exhibited a slightly darker signal on the shortwave IR image (due to the smaller ice particle size of the contrails compared to the surrounding cirrus clouds), while they appeared slightly brighter in the cirrus image (since the smaller particles comprising the contrails were better scatterers than those comprising the surrounding cirrus clouds).

Examining other satellite products such as the MODIS Cloud Phase product, MODIS Cloud Top Temperature product, and the GOES sounder Cloud Top Height product (below) from that same time period confirmed that these aircraft contrails existed in an environment that consisted primarily of ice phase clouds (light red enhancement) which exhibited rather cold MODIS cloud top temperatures (-40º to -60º C, cyan to dark blue enhancement) and fairly high GOES sounder cloud top height values (30,000-39,000 feet above ground level, light blue to white enhancement).

MODIS + GOES sounder images (Animated GIF)

View only this post Read Less

Using GOES-10 imagery to detect ash clouds from the Tungurahua volcano in Ecuador

The Tungurahua Volcano in Ecuador began to have a series of eruptions during the first 2 weeks of February 2008 (Washington VAAC advisories). A comparison of 4 different GOES-10 Imager and Sounder products (above) shows the Imager 10.5µm “IR window”, the Imager 10.5-12.0µm “split window difference”, the Sounder 11.0-12.0µm “split window difference”,... Read More

GOES-10 imager and sounder products (Animated GIF)

The Tungurahua Volcano in Ecuador began to have a series of eruptions during the first 2 weeks of February 2008 (Washington VAAC advisories). A comparison of 4 different GOES-10 Imager and Sounder products (above) shows the Imager 10.5µm “IR window”, the Imager 10.5-12.0µm “split window difference”, the Sounder 11.0-12.0µm “split window difference”, and the Sounder 7.4-13.3µm “SO2 detection product”. A volcanic ash plume was evident on both the Imager and Sounder split window difference products, moving southwestward away from the volcano at 16:31-16:45 UTC on 06 February 2008. The lack of a signal on the SO2 detection product could have been due to masking by clouds, or the fact that very little SO2 was present in that particular volcanic ash plume.

GOES-10 spilt window + IR images (Animated GIF)

A comparison of GOES-10 split window difference and IR window images from 06:15-13:15 UTC on 06 February (above) show the improved volcanic ash detection capability of the 11-12µm technique — ash shows up as red features in the split window difference product.

GOES-10 visible images (Animated GIF)

An animation of the GOES-10 visible channel imagery from 06 February 2008 (above) shows the plume of volcanic ash drifting southwestward.

GOES-10 IR + IR difference images (Animated GIF)

An animation of GOES-10 IR “split window difference” (10.5µm – 12.0µm, top panel) and IR window (10.5µm, bottom panel) imagery from (above) showed two separate pulses of volcanic ash cloud (gray enhancement) that were drifting southwestward on that day. Two days later, on 08 February (below), a new ash cloud was seen to be drifting almost due west.

GOES-10 IR + IR difference images (Animated GIF)

Then on 10 February (below), two separate ash clouds could be seen — one drifting eastward, and one drifting westward — as changes in wind direction with height (wind shear) moved the volcanic ash plumes in different directions.

GOES-10 IR + IR difference images (Animated GIF)

View only this post Read Less

Super Tuesday 2008 Tornado Outbreak

The Super Tuesday 2008 Tornado Outbreak has been one of the deadliest tornado outbreaks on record in the US — with 59 fatalities reported so far, it ranks in the top 15 deadly tornado outbreaks (and the highest number of tornado deaths since... Read More

GOES-12 10.7 µm IR images (Animated GIF)

GOES-12 10.7 µm IR images

The Super Tuesday 2008 Tornado Outbreak has been one of the deadliest tornado outbreaks on record in the US — with 59 fatalities reported so far, it ranks in the top 15 deadly tornado outbreaks (and the highest number of tornado deaths since 1985). According to the SPC Storm Reports, there were over 300 reports of tornadoes, large hail (up to 4.25 inches in diameter in Texas, Arkansas and Missouri), and damaging wind gusts from Texas to Ohio and West Virginia. The outbreak produced a total of 87 tornadoes, some producing EF-3 and EF-4 damage.

AWIPS images of GOES-12 10.7 µm IR channel (above) and GOES-12 6.5 µm “water vapor channel” data (below) showed the development of widespread severe convection along and ahead of an advancing cold frontal boundary during the 05 February06 February 2008 period.

GOES-12 6.5µm water vapor images (Animated GIF)

GOES-12 6.5 µm water vapor images

============================================

GOES-12 sounder total precipitalbe water (Animated GIF)

GOES-12 sounder Total Precipitalbe Water

Hourly images of GOES sounder Total Precipitable Water (above) showed that moisture was increasing ahead of the cold front, with TPW values of 30-40 mm (1.2-1.6 inches) ahead of the front; the air mass ahead of the cold front was also marginally unstable, with GOES sounder CAPE values (below) of 1000-2000 J/kg.

GOES-12 sounder CAPE (Animated GIF)

GOES-12 sounder CAPE

AWIPS images of 1-km resolution MODIS 11.0 µm IR channel data (below) showed closer views of the severe convection around 03:39 UTC and 07:50 UTC — tornadoes and large hail were being reported in parts of Tennessee around those 2 times. As is often the case with winter season severe convection, no classic “enhanced-V” signatures were evident on the IR imagery.

MODIS 11.0 µm IR image

MODIS 11.0 µm IR image

MODIS 11.0 µm IR image

MODIS 11.0 µm IR image

===========================================

GOES-12 6.5µm water vapor images (Animated GIF)

GOES-12 6.5 µm water vapor images

Farther to the north, in the cold air, parts of southern Wisconsin received as much as 21 inches of snowfall, accompanied by strong winds that created near-blizzard conditions with significant blowing and drifting snow. The 13.3 inches that fell in Madison was the city’s second largest 24-hour snowfall amount on record, and about 2000 vehicles became stranded on Interstate 90 in southern Wisconsin (between Madison and Janesville). GOES-12 6.5 µm water vapor channel images (above) revealed several important signatures during the long-duration winter storm event: a dry slot (which helped to release convective instability along the Illinois/Wisconsin border region), a well-defined deformation zone that set up across Iowa/Wisconsin, and a Trough of Warm Air Aloft (TROWAL) that developed westward from southern Michigan into Wisconsin/Illinois. A vertical cross section of equivalent potential temperature (GEMPAK wizardry courtesy of J. Gerth, CIMSS) oriented north-to-south from Iron Mountain, Wisconsin (IMT) to Paducah, Kentucky (PAH) showed the TROWAL structure very well (below).

Cross Section of theta-e

Cross Section of theta-e

View only this post Read Less